HAL Id: hal-01118830
https://hal.archives-ouvertes.fr/hal-01118830
Submitted on 24 Feb 2015
HAL is a multi-disciplinary open access
archive for the deposit and dissemination of
sci-entific research documents, whether they are
pub-lished or not. The documents may come from
teaching and research institutions in France or
L’archive ouverte pluridisciplinaire HAL, est
destinée au dépôt et à la diffusion de documents
scientifiques de niveau recherche, publiés ou non,
émanant des établissements d’enseignement et de
recherche français ou étrangers, des laboratoires
Re-ranking Approach to Classification in Large-scale
Power-law Distributed Category Systems
Rohit Babbar, Ioannis Partalas, Eric Gaussier, Massih-Reza Amini
To cite this version:
Rohit Babbar, Ioannis Partalas, Eric Gaussier, Massih-Reza Amini.
Re-ranking Approach to
Classification in Large-scale Power-law Distributed Category Systems.
ACM Special Interest
Group on Information Retrieval (SIGIR 2014), Aug 2014, Gold Coast, Australia. pp.1059-1062,
�10.1145/2600428.2609509�. �hal-01118830�
Re-ranking Approach to Classification in
Large-scale Power-law Distributed Category
Systems
Rohit Babbar, Ioannis Partalas, Eric Gaussier, Massih-Reza Amini
University of Grenoble Alpes, LIG
F-38000 Grenoble, France
[email protected]
Abstract
For large-scale category systems, such as Directory Mozilla, which con-sist of tens of thousand categories, it has been empirically verified in earlier studies that the distribution of documents among categories can be mod-eled as a power-law distribution. It implies that a significant fraction of categories, referred to as rare categories, have very few documents assigned to them. This characteristic of the data makes it harder for learning al-gorithms to learn effective decision boundaries which can correctly detect such categories in the test set. In this work, we exploit the distribution of documents among categories to (i) derive an upper bound on the accuracy of any classifier, and (ii) propose a ranking-based algorithm which aims to maximize this upper bound. The empirical evaluation on publicly avail-able large-scale datasets demonstrate that the proposed method not only achieves higher accuracy but also much higher coverage of rare categories as compared to state-of-the-art methods.
1
Introduction
Big data analytics and large scale learning have gained increasing importance in recent years and have become a key focus of academia and industry alike. This is due to the tremendous growth in data from various sources such as social networks, web-directories and digital encyclopedias. In order to maintain interpretability and to make these systems scalable, digital data are required to be classified among one of tens of thousands of target categories. Directory Mozilla, for instance, lists over 5 million websites distributed among close to 1 million categories, and is maintained by close to 100,000 editors. In the more commonly used Wikipedia, which consists of over 30 million pages, documents are typically assigned to multiple categories which are shown at the bottom of each page. In order to minimize the amount of human effort involved in
such large-scale scenarios, there is a definite need to automate the process of classifying data.
1.1
Power-law distribution and rare category detection
It has been shown in the work by [7, 4] that the distribution of documents among categories follows power-law distribution. Formally, let Nr denote the
size of the r-th ranked category (in terms of number of documents), then : Nr= N1r−β (1)
where N1represents the size of the 1-st ranked category and β > 0 denotes the
exponent of the power law distribution. The fat-tailed power law distribution highlights the fact that many categories have very few documents assigned to them. For instance, 76% of the categories in the Yahoo! directory have less than 5 documents in them [3].
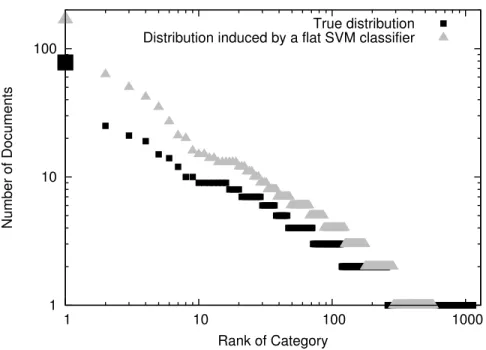
Rare category Detection Due to the fat-tailed power law distribution, a large number of categories have very few documents assigned to them. It is, therefore, statistically harder to learn good decision boundaries for these categories. The decision boundaries of the bigger categories are more attractive as compared to the rare categories. As a result, a test instance which actually belongs to one of the rare categories is assigned to a bigger category. On one hand, this leads to high False Positive rate for bigger categories, and on the other hand, rare categories are lost in the classification process. This is shown for one of the datasets in Figure 1, which depicts (i) the true distribution of test instances among target categories, and (ii) the distribution induced when a flat (multi-class) SVM classifier is used for classification (since its performance is close to state-of-the-art method proposed in [3]). For the distribution induced by the SVM classifier, observations in Figure 1 which demonstrate the high False-positive rate for large categories and inability to detect rare categories in such distributions are :
• On the left side of the plot, the graph for the distribution induced by the SVM classifier starts higher and remains higher as compared to true distribution, but drops much sharply on the right part, and
• Comparing the tails of the distributions on the right side of the plot, the true distribution has a fatter tail as compared to the induced distribution, i.e., it has many more categories of 1 or 2 documents as compared to the distribution induced by the SVM classifier.
More concretely, the category with the maximum number of documents in the true distribution has 78 documents (denoted by bigger solid square in black), while in the induced distribution it has 176 documents (denoted by bigger solid triangle in grey). Also, the actual number of categories in the test distribution is 1139, while the flat SVM classifier is able to detect merely 534 categories. Not only limited to flat SVM classifier, the state-of-the-art methods such as [3] also suffer from these two problems mentioned which is also apparent in low values of the Macro-F1 measure achieved by these methods.
1 10 100 1 10 100 1000 Number of Documents Rank of Category True distribution Distribution induced by a flat SVM classifier
Figure 1: Comparison of distribution of test instances among categories in the true distribution and in the distribution induced by a flat SVM classifier; the X-axis represents the rank of categories (by number of documents) and Y-axis the number of documents in those categories. Categories with same number of documents effectively have same rank.
1.2
Related work and our contributions
The work by [4] is among the pioneering studies in classification of power-law distributed web-scale directories such as the Yahoo! directory consisting of over 100,000 target classes. For similar category systems, classification techniques based on refined experts and deep classification have been proposed in [1] and [6] respectively. More recently recursive regularization based SVM (HR-SVM) has been studied in [3] wherein the optimization problem for learning the dis-criminant functions exploits the given taxonomy of categories. This approach represents the current state-of-art as it performs better than most techniques on large-scale datasets released as part of the Large Scale Hierarchical Text Classi-fication Challenge in last few years1. However, the drawback of this method is that the improvement in the Micro-F1 (same as accuracy for mono-label prob-lems) and Macro-F1 measures of this approach are not substantial over flat SVM classifier for which ready to use packages such as Liblinear are available. As shown in Table 3 of [3], the improvement over SVM baseline is less than 1% (in absolute terms) on most datasets. As a result, a natural question to ask is :
Does one really need the added complexity of a newer implementation and much higher computational cost in return for a small improvement in the measures of interest?
Our Contributions We propose an easy to implement method which per-forms post-processing on the posterior probabilities of categories given the in-stance. More concretely, we proceed as follows, (i) we propose a simple but useful upper bound on the accuracy of any classifier which classifies documents into target categories and hence induces a distribution of documents among them, and (ii) we then present a category ranking based algorithm which aims to maximize the bound on the accuracy derived in the first step and thereby favouring rare categories. This scheme performs better than the state-of-the-art HR-SVM technique in both Micro-F1 and Macro-F1 measures, and especially for the latter, at a much lower computational complexity. Also, the relative improvement in the total number of categories detected in classification is as high as 20% on some datasets.
2
Accuracy Bound on Power-law Distributed
Cat-egories
Now we propose an upper bound on the accuracy of a given classifier C. Unlike most learning theoretic error bounds [5], the nature of this bound is quite simple and is particularly suited for classification problems with a large number of target categories. The derivation of the upper bound on the accuracy of the classifier C is based on the distribution of unseen instances induced by it among the target categories.
We consider mono-label multi-class classification problems, where observa-tions x lie in an input space X ⊂ Rd and belong to one and only one category
from a discrete set Y of labels, where |Y| > 2. We suppose that examples are pairs of (x, y), with y ∈ Y, identically and independently distributed (i.i.d) ac-cording to a fixed, but unknown probability distribution D over X × Y. We further assume to have access to a training set Strain = {(x(i), y(i))}Ni=1 also
generated i.i.d with respect to D. In the context of text classification, x(i)∈ X
denotes the vector representation of document i and its label y(i)∈ Y represents the category associated with x(i). Using the statistics of the training data, we first provide confidence intervals for the estimate of the prior probability for each category.
Lemma 1 Let N denote the total number of instances in the training set such that the category y` consists of N` instances. Let py` denote the true prior
probability for category y` ∈ Y and NN` , ˆpy` its empirical estimate. Then ∀δ,
such that 0 < δ ≤ 1, with probability at least (1 − δ), the following upper bound holds simultaneously for all categories,
∀y`∈ Y, py` ≤ ˆpy`+
s
log |Y| + log1δ
where the probability is computed with respect to repeated samples of the training set.
The above lemma can be proved by applying Hoeffding’s inequality and then union bound for it to hold simultaneously for all |Y| categories. Using the bound in inequality (2), we now present a probabilistic upper bound on the accuracy of a classifier C evaluated on an independent set S.
Theorem 1 Let S = {(x(j), y(j))}M
j=1 be a set generated i.i.d. from D. Let
MC
` be the number of examples in S assigned to category y` by the classifier C
which is trained on Strain. Then for any 0 < δ ≤ 1, the following bound on the
accuracy of C over S, denoted by Acc(C), holds with probability at least (1 − δ):
Acc(C) ≤ 1 |S| |Y| X `=1 min{(ˆpy`× |S|), M C ` } , B(Acc(C)) (3)
where ˆpy` denotes the estimate on the prior probability of the category y` in the
training set as computed in Lemma 1.
For ` = 1, (ˆpy1×|S|) represents a probabilistic upper bound on the number of
instances in category y1 and using Lemma 1, the bound holds with probability
(1 − δ/|Y|), where |S| denotes the size of S. Clearly, the maximum number of instances for category y1 that can be correctly classified by C is given by
min{(ˆpy1 × |S|), M
C
` }. Summing over all |Y| categories gives an upper bound
on the total number of instances that can possibly be correctly classified by C with confidence atleast (1 − δ). The maximum accuracy rate of classifier C is, therefore, given by right hand side of (3).
Even though the bound given in (3) seems loose, it is indeed quite useful when learning classifiers on a large number of target categories which are power-law distributed. In the next section, we propose a ranking-based algorithm which aims at improving this upper bound.
3
bound maximization Algorithm
The min(., .) function in the bound derived in equation (3) has two arguments, where the first argument corresponds to the estimate of the number of instances in category ` and the second argument is the number of instances assigned to this category by the classifier C. A higher value of the bound is achieved for C, if the two arguments are close to each other for large number of categories. On the other hand, if C assigns a large number of false-positives to large classes, the value attained by the bound will be lower since :
1. For large categories, the first argument in min(., .) will be accounted to-wards computing the bound, and
2. For small categories which have false-negatives, the second argument in min(., .) will be close to zero and will be used in the computation of the bound.
The two problems correspond to the left and right portions respectively in Fig-ure 1 for the distribution induced by the flat SVM classifier. Therefore, when dealing with large number of target classes the bound on the accuracy repre-sents a criterion which can be optimized (maximized) in order to obtain better classification. It may be noted that the bound represents a necessary condition for a classifier C to have high accuracy. It does not provide a sufficient condition since it is possible in an adversarial setup to achieve an upper bound of 1 by simply assigning the test instances to categories in the same proportion as in the training set.
With the aim of maximizing the accuracy bounds by reducing the False pos-itive rate for top-ranked categories and detecting more of the rare categories, we present an efficient algorithm which achieves better measures for Micro-F1 and Macro-F1. Given the training set Strain, we first train a multi-class SVM
(using Liblinear) which can give probabilistic output. When predicting the cat-egory associated to the test instance x, the algorithm first computes the class posterior probabilities (ˆpyl|x), ∀1 ≤ l ≤ |Y| and ranks the categories according
to posterior probabilities. Let yr1= arg maxyl∈Y(ˆpyl|x) be the first-ranked
cat-egory and yr2= arg maxyl∈{Y−yr1}(ˆpyl|x) is the second-ranked category. Also,
let Nyr1 and Nyr2 be the number of training instances in these categories in
the training set Strain. For the instance x, we define a predicate pred(x) which
is true if and only if the following conditions are satisfied : (i) the difference (ˆpyr1|x) − (ˆpyr2|x) ≤ ∆, and (ii) Nyr1/Nyr2 ≥ R. If pred(x) evaluates to true, it
implies that x may be wrongly classified by the flat SVM classifier to category yr1. In this scenario, a majority-voting based re-prediction to distinguish the
top two categories for x is performed as follows. An instantaneous training set is created by randomly under-sampling the top-ranked category to match the number of training instances in the rare category, and all the training instances from the rare category are used. Using this instantaneous training set, a binary classifier is then trained and the class of the instance x is re-predicted. The above process of creation of instantaneous set, training and prediction is repeated an odd number of times and one of the categories from {yr1, yr2} with majority
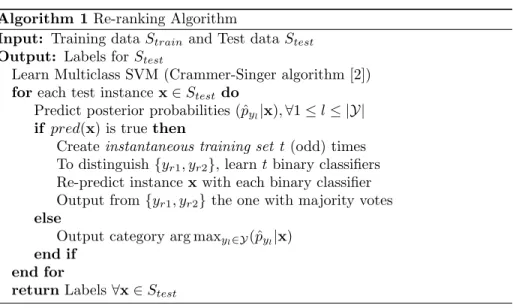
votes is finally predicted. Since this is performed for a small fraction of the instances in the test set and involves only two categories, this post-processing of the output adds only marginal computational cost as compared to learning the multi-class SVM for all the categories. The entire re-ranking procedure is explained below in Algorithm 1:
It may be noted that the proposed algorithm can be extended to consider top-k categories instead of top-2, which is one of our future works.
3.1
Handling Class-imbalance
It may be noted that the nature of class imbalance problem posed in the large-scale datasets with thousands of power-law distributed categories is different from the traditional classification problems in low-dimensional space such as in UCI datasets. A typical rare category consisting of 2-to-4 instances and spans a very low dimensional sub-space of a few hundreds of features in the entire
Algorithm 1 Re-ranking Algorithm
Input: Training data Strain and Test data Stest
Output: Labels for Stest
Learn Multiclass SVM (Crammer-Singer algorithm [2]) for each test instance x ∈ Stest do
Predict posterior probabilities (ˆpyl|x), ∀1 ≤ l ≤ |Y|
if pred(x) is true then
Create instantaneous training set t (odd) times To distinguish {yr1, yr2}, learn t binary classifiers
Re-predict instance x with each binary classifier Output from {yr1, yr2} the one with majority votes
else
Output category arg maxyl∈Y(ˆpyl|x)
end if end for
return Labels ∀x ∈ Stest
feature space which could be as big as hundreds of thousand dimensions, as shown in Table 1. This is in contrast to conventional imbalanced data-sets which lie in feature spaces of few tens of dimensions and all classes span the entire dimensionality of the entire feature space. As a result, the conventional methods of handling class-imbalance such as class-wise penalty in SVM (which penalizes a mis-classification for a class inversely in the ratio of number of instances in that class) do not improve classification in such settings. We tested this technique on our datasets and the results were poorer as compared to normal class-insensitive penalization. We therefore did not pursue this strategy any further.
4
Experimental Evaluation
Dataset Training/Test instances Categories |Y| Features d LSHTC-2010-s 4,463/1858 1,139 51,033 LSHTC-2010-l 128,710/34,880 12,294 381,580 LSHTC-2012 383,408/103,435 11,947 348,548Table 1: LSHTC datasets and their properties
We present empirical results on publicly available Directory Mozilla (DMOZ) datasets from the LSHTC challenge in 2010 (s and l suffixes correspond to smaller and larger versions) and 2012. The statistics of the data are shown in Table 1.
4.1
Comparison with state-of-art
Dataset Algorithm 1 HR-SVM [3] SVM base-line LSHTC-2010-s Micro-F1 47.36†† 45.31 45.15 Macro-F1 32.91†† 28.94 29.40 Training Time 1.1x 1.7x 1x LSHTC-2010-l Micro-F1 46.67†† 46.02 45.82 Macro-F1 34.65†† 33.12 32.63 Training Time 1.1x 1.6x 1x LSHTC-2012 Micro-F1 57.78†† 57.17 56.44 Macro-F1 34.15†† 33.05 31.59 Training Time 1.1x 1.6x 1xTable 2: Comparison of Micro-F1 and Macro-F1 for the proposed algorithm, HR-SVM and SVM baseline. The training time is shown as a multiple of time taken by the SVM-baseline. The significance-test results ((using micro sign test (s-test) as proposed in [7]) are denoted for a p-value less than 1%.
The metrics used for comparison are Micro-F1 measure and Macro-F1 mea-sure. The parameters ∆ and R used in Algorithm 1 are chosen by cross-validation and we observed that even intuitive values such as R = 5 and ∆ = 1/(10 × |Y|) give better results than the flat SVM-baseline. In Table 2, we compare the algorithm proposed in Section 3 with HR-SVM from the recent work in [3] and also against the SVM-baseline. Since we use the same datasets as the ones used in [3], the comparison with startegies such as Hierarchical SVM (H-SVM) and top-down SVM is omitted, since it is already presented in that work. Comparison of the approaches shows that the proposed method, aimed at maximizing the accuracy bound (2) yields improvement over the state-of-the-art HR-SVM technique. The results of the significance test are shown with respect to HR-SVM [3] and SVM-baseline, and †† represents significant im-provement over both the methods. Since our method is explicitly targeted at rare category detection, the improvement in Macro-F1 measure is particularly significant, which confirms that the method is able to correctly recognize rare categories. For instance, the relative improvement in Macro-F1 over HR-SVM for LSHTC-2010-s dataset is close to 15%.
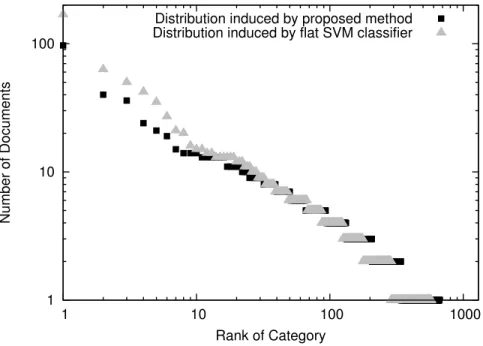
On comparing Figure 2 with Figure 1, we observe that the distribution induced by our method on the LSHTC-2010-s dataset is much closer to the true distribution as compared to SVM classifier. The left part of the plot shows that bigger categories have a lower False positive rate as compared to SVM classifier. The tail of the distribution shows that our method detects more rare categories,
which further confirms better rate of Macro-F1 measure as compared to state-of-art methods. To compare the computational cost of each method, training times are also shown in Table 2. The comparison to HR-SVM shows that our method enjoys favorable performance in terms of computational complexity.
1 10 100 1 10 100 1000 Number of Documents Rank of Category
Distribution induced by proposed method Distribution induced by flat SVM classifier
Figure 2: Comparison of distribution of test instances among categories for the method proposed in Algorithm 1 and SVM baseline.
5
Conclusion
In this work, we presented a method to improve classification and rare category detection for large-scale power-law distributed datasets. The proposed method not only performs better than state-of-art methods but is also easier to imple-ment and efficient in terms of computational complexity. Future directions for this work include, (i) handling multi-label problems such as in Wikipedia, and (ii) formal frame-work to optimize the derived accuracy bound.
6
Acknowledgements
This work has been partially supported by ANR project Class-Y (ANR-10-BLAN-0211), BioASQ European project (grant agreement no. 318652), LabEx PERSYVAL-Lab ANR-11-LABX-0025, and the Mastodons project Garguantua.
References
[1] P. N. Bennett and N. Nguyen. Refined experts: improving classification in large taxonomies. In ACM SIGIR, 2009.
[2] K. Crammer and Y. Singer. On the algorithmic implementation of multiclass kernel-based vector machines. JMLR, 2, 2002.
[3] S. Gopal and Y. Yang. Recursive regularization for large-scale classification with hierarchical and graphical dependencies. In SIGKDD. ACM, 2013. [4] T.-Y. Liu, Y. Yang, H. Wan, H.-J. Zeng, Z. Chen, and W.-Y. Ma. Support
vector machines classification with a very large-scale taxonomy. SIGKDD, 2005.
[5] V. N. Vapnik. The Nature of Statistical Learning Theory. Springer-Verlag New York, Inc., 1995.
[6] G.-R. Xue, D. Xing, Q. Yang, and Y. Yu. Deep classification in large-scale text hierarchies. In SIGIR, 2008.
[7] Y. Yang, J. Zhang, and B. Kisiel. A scalability analysis of classifiers in text categorization. In SIGIR, 2003.