PFC/JA-88-32
COMPARISON OF TWO ICCS CONDUCTORS AND FOR MHD
APLLICATION
*
Marston, P.G., Hale, J.R., Dawson, A.M.
August 22,1998
Plasma Fusion Center
Massachusetts Institute of Technology
Cambridge, M.4 02139
*
Supported by the US Department of Energy, Pittsburgh Energy Technology Center
under contact DE-AC22-84PC70512
COMPARISON OF TWO ICCS CONDUCTORS FOR MHD APPLICATION t
J. R. Hale, P.G. Marston and A.M. Dawson Plasma Fusion Center
Massachusetts Institute of Technology Cambridge, MA 02139
Abstract
Two subscale internally cooled, cabled superconductors have been examined as candidates for use in a retrofit MHD topping cycle magnet. One of these was a 3 x 3 x 3 cable in which all the strands were multifilamentary NbTi stabilized with copper. The other was a 3 x 3 x 3 cable in which two strands in each of the nine triplets was OFHC copper and one was multifilamentary NbTi. The overall copper-to-superconductor ratio for each of the two 27-strand cables was approximately the same. The two con-ductors were cowound onto a grooved mandrel in such a way that they could be tested alternately. Each sample was instrumented with a heater at the center of the conductor length, and with a pressure transducer, four pairs of voltage taps and one iron-doped gold/constantan thermocouple. Performance tests of the conductors were made at 6, 7 and 7.8 tesla background magnetic
fields and at heater input energies ranging from 60 mJ/cm3 to
1758 mJ/cm3 of conductor. The results of these tests and their significance for MHD magnet design and economics are discussed.
Background and Conductor Design
One phase of a three-year program to develop and test an internally cooled, cabled superconductor (ICCS) for large-scale MHD magnets was a comparison test of two niobium-titanium. (NbTi) subscale superconductors.'- Type A was made of nine cabled triplets in which each strand contained filaments of su-perconductor along with copper stabilizer. For these strands the copper:superconductor ratio was 7:1. The Type B conductor con-tained triplets in which only one of the three strands concon-tained superconductor in a copper:superconductor ratio of 1.35:1, while the other two strands were OFHC copper stabilizer. Type B conductor thus had an overall copper:superconductor ratio of
6.05:1. Both cables were wrapped with type 304 stainless steel
foil, 0.0025 cm thick, and sheathed in type 304 stainless steel tubing. They were compacted to 35% void space (65% density). The finished dimensions were 0.41 cm od with an 0.051 cm sheath thickness. The test sample length was 4.6 m. Table I lists
con-ductor parameters. Tlble I
Characteristics of Superconductor Strands for Conductor Types A and B
Characteristic Type A strand diameter critical field Cu:SC ratio Te at 6 T T, at 7 T Te at 8 T I, at 6 T
I,
at 7 T I, at 8 T 0.051 cm 12.2 T 7:1 6.4 K 6.1 K 5.6 K 783 A 621 A 459 A Type B 0.051 cm 12.2 T 1.35:1 6.4 K 6.1 K 5.6 K 1215 A 990 A 675 AThe goal of the test program was to determine whether the Type B conductor was similar in stability, quench propagation, and pressure dynamics performance to the former, conventional design. If it were, it would offer a potential significant savings in
manufacturing cost for a full-scale conductor. Experiment Design
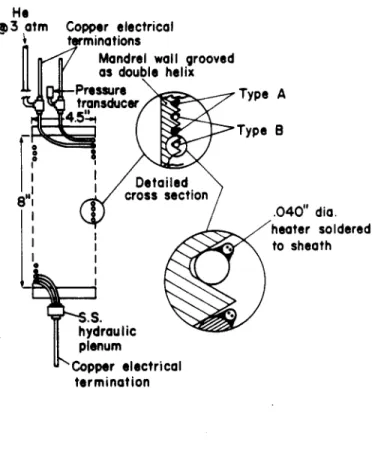
The two samples were cowound into a single-layer bifilar coil which is shown schematically in Fig. 1 and in a photograph in Fig. 2. The coil support mandrel is a 4.4" dia., 10" long grooved
G-10 cylinder. The samples were connected electrically in series
and so carried the same transport current at all times. However, only one sample at a time was subjected to an energy pertur-bation. The energy perturbation, designed to simulate frictional heating of the sheath, the principal potential source of heating in an MHD magnet, was administered through a heater soldered directly to the conductor sheath.
He
@3
atm
Copper electrical
terminations
Mandrel wall grooved
as double helix
Pressure Type A transducerType B
I
I
Detailed
8"11
cross section
.040" dia.
heater soldered
I .to sheath
I...hydraulic
plenum
Copper electrical
termination
Figure 1 Schematic Illustration of Test Coil
tSupported in part by US Department of Energy, Pittsburgh Energy Technology Center under contract DE-AC22-84PC70512
10 9 7 6 1CCS S-I.. 5 4 3 14 U 2 CAHAC QR
cm0mcAtov Capacitor T
aff-Pow" 3upply
Figure 2 Photograph of Test Coil
Data Collection and Test Procedure
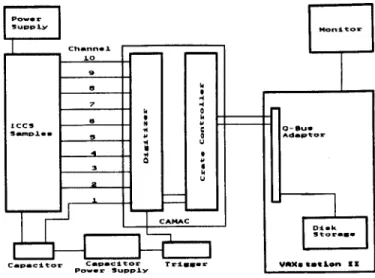
Figure 3 is a schematic diagram of the data acquisition sys-tem. Ten analog signals, listed in Table II, were monitored. These were connected to the inputs of a LeCroy model 8212A 32-channel digitizer. The entire sequence of digitizing and stor-ing the ten channels of data on Winchester disk was handled by the MIT MDS Software package.t Nine data channels were dis-played on a video monitor a few seconds after each digitize/store sequence. Each experimental run was organized by shot number and each shot was initiated manually by discharging the capaci-tor into the heater. Simultaneously, the data acquisition system began to convert and store the ten signals, and continued for two seconds, with a time resolution of 500 ps, yielding 4096 data points per channel for each shot.
Table II
Data Monitored by Channel
Channel Parameter Monitored
1 Current through pulse heater
2 Voltage across heater terminals
3 Thermocouple voltage
4 Potential difference on surface of sheath
between the ends of the heated length
5 Potential difference across one turn,
~ one turn above heated length
6 Potential difference across one turn,
- one turn below heated length
7 Total potential difference between ends of
test sample
8 Transport current in sample
9 Pressure inside sheath
10 Total potential difference between ends
of the unperturbed sample
t
@1986 Massachusetts Institute of Technology
Ad.Rt-DiLk
flora..e
Figure 3 Schematic Illustration of Data Acquisition System
Testing of each sample was carried out at three levels of background field: 6 T, 7 T, and 7.8 T, provided by the 6B mag-net at the Francis Bitter National Magmag-net Laboratory. Once the background field was set, the following looping sequence was used:
1. Transport current set to desired value.
2. Capacitor charged to desired voltage, initial choices based on analysis of expected performance, later choices on results of prior shots.
3. Capacitor discharged into heater by manual trigger,
simul-taneously triggering data acquisition system.
4. Sample voltage monitored on oscilloscope - if voltage rise is
rapid, indicating propagating normal zone, current supply interrupted to avoid sample damage.
5. Return to step 1, if more data is needed at preset field level;
otherwise change background field level and return to step
1.
The critical current of Type A conductor was measured at each of the three levels of background field. Since the current capacity of Type A was lower than that of Type B, and the two
were
in series, it was not possible to measure the critical current of Type B directly.Results
Early in the project two worst-case scenarios for conductor performance had been analysed. Because the measured critical current of Sample A exceeded the value claimed by the manufac-turer, these calculations were repeated to provide a more realistic basis by which to evaluate conductor experimental performance. Both scenarios had the common characteristic that nonrecovery from a heat pulse is inevitable if the temperature of the helium is driven above the current-sharing temperature. The difference between the two scenarios is that in case I the initial perturba-tion is a small fracperturba-tion of that required to raise the helium to this temperature, with the balance coming from joule heating, while
in case I1 the initial perturbation supplies all the input energy
The input to the stability analysis program, in addition to
the values in Table
I,
included an initial pressure of 3 atm, anini-tial temperature of 4.2 K and an energy perturbation of a single half-sinusoidal pulse 20 ms in duration. In case I the perturba-tion was applied to the full length of the conductor. Heat flows
by conduction directly from the heated sheath to the strands
such that the temperature distribution at time
Atl
following theperturbation is nearly identical to that if the same energy pulse were applied directly to the strands throughout the entire length of conductor. In case I1 the heat was transferred from the sheath
such that at time
Atj
1 following the perturbation, thetempera-tures of the sheath, the helium and the strands are the same. Atr and
Atlr
are estimates at best, and range from 1 to 20 ms. For conductor Type A the energy margin for worst case II is for the most part larger than for worst case I in which current-sharing occurs.The Type B conductor calculations were complicated by the fact that the existing stability program has no means for 'hybrid-ing' the strands in a cable. Therefore, the copper strands were considered to be both electrically and thermally innocuous, leav-ing only the very low copper-to-superconductor ratio of the nine superconducting strands which led to high joule heating for case
I.
For caseII,
however, all 27 strands contributed enthalpy andraised the energy margin to much greater values than case I. The degree to which these calculated scenarios are represen-tative of the physical arrangement of the constituent materials, and of the physical processes that occurred during the experi-mental testing was expected to be modest at best. For example, in calculating Worst Case I, the perturbation was applied to the
strands as a 10 ms inductive pulse over the whole length of the sample. The intent for the experiment, on the other hand, was
to apply the perturbation to 30 cm of the - 4.6 m samples as
a 10 ms heater current pulse to a heater soldered to the sheath. As thermocouple data showed later, however, it is likely that al-though the current pulse was 10 ms in duration, the actual pulse of heat energy at the sheath surface was more nearly 500 ms in duration; evidently, the ceramic insulation within the heater was much more of a barrier than expected.
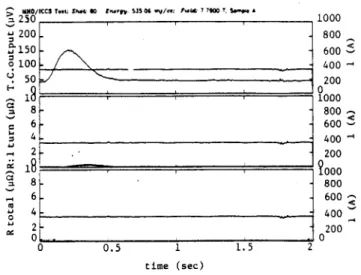
The following series of data from Type A conductor shown in Figs. 4-6 also indicates that actual behavior is more complex than that assumed in the computer model. The top trace in each plot is the thermocouple output, referenced to 0 K.t The middle trace is the resistance of the heated length of conductor, and the bottom trace is the total resistance of the sample. Superimposed on all three traces is the trace of transport current?, with the scale indicated on the right side axis.
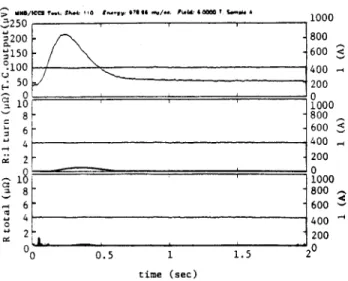
Figures 4 and 5 show a pair of sequential shots, one of which led to a propagating normal zone (#81), and one that did not
(#80). In #80, current-sharing commences at about 200 me, but
collapses after lasting for about 350 ms. A similar situation can be seen in the trace of shot #110 (Figure 6), although current-sharing in that case lasted longer. These traces show evidence that at least some of the strands are heated by contact with the sheath to a temperature above that of the interstitial helium, which is also being heated by contact with the sheath. But the
source of heat - the sheath - reaches a temperature lower than
t 40 1AV = 4 K, 150
pAV
= 11.4 K, 250 pAV = 17.3 K.$ The decay in current apparent whenever current-sharing is underway is due to the fact that the power supply acts as a constant voltage source rather than as a constant current source.
the current-sharing temperature, T.., before the helium temper-ature rises to Tc,, and therefore, the helium can continue to serve as a heat sink for the heated strands. In these two shots, the strands were able to cool to less than Tc,, despite the joule heating addition to their energy burden.
Shot #81 shows a case in which the strands, once current-sharing set in, were not cooled to less than Tc, before the inter-stitial helium's temperature was raised to Te, by contact with sheath and the warming strands.
In order to measure the speed with which a normal zone would grow, voltage taps were attached to the sheath approxi-mately three turns (24 inches) beyond the heated length in both directions. From limited data, the speed of propagation of the Tc, regime was calculated to be approximately 1.3 m/s. Addi-tional data with voltage taps repositioned to be closer to the ends of the heated length would make it possible to verify this value.
WIO/ICCS T-n S,.. go f-n $j$ 46.v~. . 7 7s00 T.7 S250 3 200--150
_
0 100 . 50 E_ 8-a if 6-4 -2 -L 0o 0.5 1 1.5 2 time (see) 1000 800 600 400 -200 0 1000 800 600 400 200 000 800 600 400 200 0Figure 4 Example of a Shot Showing Initiation and Collapse of a Normal Zone - E./ Z250 Z200 21500 0100 0-.
18
i 8 S6 04 3 10 0'5 0 T.V ?.10 M0. I-5 £.-4 "70 -V- IA 7 'ON0 T7- 1000 -800 - 6005
400 -- 200 800 - 1000 -600 400 200 0 S1000 800 600 400 200 0 0.5 1 1.5 2 time (sec)Figure 5 The Subsequent Shot in Which a Propagating Nor-mal Zone Develops
5250 :.200
-150 --. F\ U 0 0 0 501000
800 600 4nn 200 00 U 10I1000
8 800 6 4 800600 2 200 1018
1000
8 800 6 600 4 400 1200 U 0.5 1 1.5 2 time (sec)Figure 6 An Example of a Long Current-Sharing Period with No Propagating Normal Zone
Conclusions
Inasmuch as the effective duration of the energy pulse was greater than had been intended, no conclusions can be drawn re-garding the comparative stability of these two conductors against short duration (1-10 millisecond) perturbations. The conclu-sions regarding their response to longer duration (a few hundred millisecond) heat inputs applied to the surface of the sheath are:
1) If operated at equivalent I/Ic, these two conductors will
be-have comparably with respect to their response to so-called 'long' duration heat perturbations at the sheath surface. 2) There is good thermal heat-sink action provided by the
inter-stitial helium, enough so that the bulk of the energy needed to raise the temperature of the strands to T, comes from the initial source of the perturbation.
3) Although the thermal contact between the strands and the
sheath may be intermittent along a given conductor length, it is adequate to enable at least some of the strands to be heated by conduction from the inner surface of the sheath. This suggests that the electrical contact is also moderately good, although not necessarily equally good to all strands in any given length interval.
The general conclusion to be drawn from the tests is that it is reasonable to assume that the lower cost two-in-one triplet cable configuration will be perfectly satisfactory for large-scale NbTi internally cooled, cabled superconductors. Such perfor-mance must, of course, be verified at full scale.
References
(1] Design Requirements Definition Report for ICCS for Large
Scale MHD Magnets, Plasma Fusion Center, MIT, Cam-bridge, MA, November 1985.
[2]
Analysis Report, Develop and Test an Internally Cooled,Ca-ble Superconductor (ICCS) for Large-Scale MHD Magnets, MIT, January 1986, DOE/PC-70512-5.
u
[3] Develop and Test an Internally Cooled, Cabled
Supercon-ductor for Large-Scale MHD Magnets: Test Plan, August
1986, Revised May 1987, DOE/PC-70512-5.
[4] Develop and Test an Internally Cooled, Cabled Supercon-ductor for Large-Scale MHD Magnets: Semiannual Progress Report, January 1 to June 30, 1987, DOE/PC-70512-10, Sept. 1987.
[5] C.J. Heyne, D.T. Hackworth, S.K. Singh, Y.L. Young,
West-inghouse Design of a Forced Flow NbsSn Test Coil for the Large Coil Program, and references therein, Eighth Sym-posium On Engineering Problems in Fusion Research, pp
1148-1153, 1979.
[6] P.A. Materna, Design Considerations of Forced-flow
Super-conductors in Toroidal Field Coils, Tenth Symposium on En-gineering Problems in Fusion Research, pp 1741-1746, 1983.
[8] L. Dresner, D.T. Fehling, M.S. Lubell, J.W. Lue, J.N.
Lu-ton, J. McManamy, C.T. Wilson, R.E. Wintenberg, Stability
Tests of
the
Westinghouse Coil in the IFSMTF, TenthIn-ternational Conference on Magnet Technology, Sep. 1987, to be published in IEEE Trana. Mag., March 1988.