Compressibility of electrospun fiber mats
The MIT Faculty has made this article openly available. Please share how this access benefits you. Your story matters.Citation Choong, Looh Tchuin, Matthew M. Mannarino, Sandip Basu, and
Gregory C. Rutledge. “Compressibility of Electrospun Fiber Mats.” J Mater Sci 48, no. 22 (June 25, 2013): 7827–7836.
As Published http://dx.doi.org/10.1007/s10853-013-7528-x
Publisher Springer-Verlag
Version Author's final manuscript
Citable link http://hdl.handle.net/1721.1/92365
Terms of Use Creative Commons Attribution-Noncommercial-Share Alike
Compressibility of Electrospun Fiber Mats
Looh Tchuin (Simon) Choong1, Matthew M. Mannarino2, Sandip Basu3, Gregory C. Rutledge1*
1Department of Chemical Engineering, Massachusetts Institute of Technology 2 Department of Material Science & Engineering, Massachusetts Institute of Technology
3Nano Scale Science Division, Agilent Technologies
*Corresponding author. Tel.: +1 617 253 0171; fax: +1 617 258 5766.
E-mail address: [email protected] (G. C. Rutledge).
Abstract
Compressive properties of electrospun fiber mats are reported for the first time. Mats of bisphenol-A polysulfone (PSU) and of poly(trimethyl hexamethylene terephthalamide) (PA 6(3)T) were electrospun and annealed at a range of temperatures spanning the glass transition temperature of each polymer. The data for applied stress versus mat solidity were found to be well-described by a power law of the form 𝜎!! = 𝑘𝐸 𝜙!− 𝜙
!
! , where
𝜎!! is the applied stress and ϕ is solidity, in accord with the analysis of Toll. The values of n range from 3.2 to 6 for PSU and from 8.0 to 20 for PA 6(3)T. The lowest values in each case were exhibited by mats annealed near the glass transition temperature of the fiber material. The values of n are independent of fiber diameter. The higher values of n are attributed to fiber slippage via a mechanism analogous to that of work hardening of metals. The values of kE can vary by an order of magnitude and were difficult to determine precisely, due to the nature of the power law and the inhomogeneity of the mats. The compressibility of electrospun mats in response to an applied stress is sufficiently large that it cannot be neglected in applications where large pressures may be involved, such as filtration or membrane separations. In addition to the initial solidity of the mats, the material compressibility and the operating pressure relevant to the application is important to describe the structure of electrospun mats quantitatively under conditions of use.
Keywords: Compression, nanofibers, electrospinning, solidity
1. Introduction
Electrospinning is a process that produces nonwoven mats consisting of fibers with diameters in the range from less than 100 nm to several microns. The electrospun mats have a wide variety of applications in areas like tissue engineering, filtration, textiles, and sensors. This popularity is due to three useful properties that are typical of electrospun mats: high specific surface area (the surface area per unit mass), low solidity (or high porosity) and high interconnectivity of pore spaces [1]. Solidity is sometimes called “relative density”, and corresponds to the density of the fiber mat relative to the bulk density of the polymer that comprises the fibers. The high specific surface area allows electrospun mats to function as effective scaffolds for growing cells [2,3], delivering drugs [4], remediating toxic gases or acting as sensors for certain molecular species [5,6]. The low solidity coupled with high interconnectivity of pores makes electrospun mats good candidates for filtration media because the resistance to flow and likelihood of clogging are low, which results in higher flux for a given pressure drop across the filter [7].
There is, however, a potential drawback in using electrospun mats for filtration membranes. Filtration is typically a pressure driven process. Since electrospun mats are low in solidity and consist of flexible, small diameter fibers, they tend to be highly compressible. The attractive properties of high specific surface area and low solidity are diminished as a result of compression of the electrospun mats. This effect is even more significant for high pressure operations like reverse osmosis (up to 7MPa). Therefore, an understanding of the compressive response of electrospun mats is critical in order to evaluate their use as filtration media or separation membranes. This potential problem is not limited to electrospun fiber mats, but may be found in other types of polymer filters or membranes where solidity is low (and porosity is high).
The mechanical properties of electrospun mats can be improved by the welding of fiber contacts through thermal annealing or solvent vapor treatment. Several studies have shown improvements in the in-plane tensile and wear properties [8, 9] after annealing the mats thermally or chemically, but through-plane compressive properties were not investigated.
Van Wyk first proposed a mechanistic deformation model for a fibrous medium under compression [10]. In his model, fiber slippage and fiber extension are neglected for simplicity, and the only mode of deformation is fiber bending. The resulting equation relating transverse stress (𝜎!!) and solidity (ϕ) is:
𝜎!! = 𝑘𝐸 𝜙!− 𝜙
!! (1)
where k is an empirical constant that accounts for the variations in length, contour, elasticity, and other characteristics of the fiber elements; E is the Young’s modulus of the fiber; ϕ0 is the initial solidity of the fibrous medium at zero pressure. The subscript zz denotes the normal component of stress applied to the surface (the z-plane) of the mat.
More complex models for compression of fibrous media have been proposed since Van Wyk, such as those of Komori [11], who included fiber assemblies where the bending units are not straight; and Pan [12] and Komori [13], who modified the expression for fiber contacts to include the effect of steric hindrance between fibers. Carnaby and Pan [14] introduced slipping fiber contacts and showed that fiber slippage contributes to the compression hysteresis. Toll [15] derived a power law equation similar to Eq. 1 for planar random fiber networks, with an exponent of 5, and aligned fiber networks, with an exponent of n>5 more generally. Baudequin [16] also derived a non-linear relation for stress versus solidity using scaling analysis.
The models of Van Wyk and of Toll have been verified experimentally for fibers with diameter greater than 10µm, such as wool and paper pulps [17,18,19,20], and the corresponding 𝜎!!-ϕ curves follow the predicted power law relationship. Despite the
widespread use of electrospun fiber mats, we are not aware of any studies of the compressive behavior of mats comprising submicron diameter fibers. In this paper, the more general expression of the power law relationship developed by Toll is used to characterize the compressive response of electrospun mats. The effect of thermal annealing on the compressibility of electrospun mats is also presented.
2. Theory
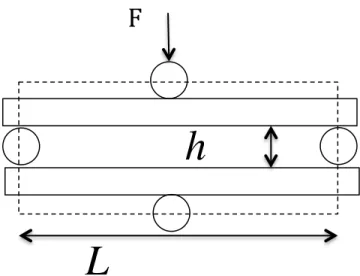
For purposes of mechanical property estimation, fibrous media are frequently modeled by a representative volume element such as that shown in Fig. 1 for a medium with fibers oriented parallel to a plane. Fiber bending is the dominant mode of deformation assumed in the models of Van Wyk and of Toll. The work of deformation is assumed to be stored as strain energy when the fibers bend, and to good approximation:
𝑑𝜎!! = 𝜂ℎ𝑑𝐹 (2)
where η is the total number of fiber-fiber contacts per unit volume, ℎ is the average height of the pore space, and 𝐹 is the average force acting at each fiber-fiber contact. In this work we assume that d, h and F are uniform throughout the material. The transverse stress (σzz) increases non-linearly with increasing strain (and solidity, 𝜙) because new fiber-fiber contacts are formed when the fibers bend; since all the quantities on the right hand side of Eq. 2 are functions of solidity, Eq. 2 must be integrated with respect to solidity in order to get the expression for stress:
𝜎!! 𝜙 = !!!!
!" 𝑑𝜙 !
!! (3)
Using the definition for linear compliance, 𝑠 = −𝑑ℎ/𝑑𝐹 and 𝑑ℎ/ℎ = −𝑑𝜙/𝜙, Eq. 3 can be rewritten as:
𝜎!! 𝜙 = !! !!!"!𝑑𝜙
For a phantom network of non-aligned, slender fibers (length >> diameter), the expression for the total number of fiber-fiber contacts and average compliance can be expressed approximately as follows:
𝜂 =!"!!!!!!! (5)
. (6)
where 𝑓 = sin 𝜃′− 𝜃 𝜓 𝜃′ 𝜓 𝜃 𝑑𝜃′𝑑𝜃 , and 𝜓 𝜃 is the in-plane fiber
orientation distribution. F can assume a value between 0 (unidirectional) and 2/π (planar random); here also, E is the Young’s elastic modulus of a single fiber. The expressions for h and L are different for different types of fiber networks [15]. For a wool of fibers randomly oriented in all three directions, h ∝ d/ϕ, where d is the fiber diameter; in a planer fiber mat in which fibers are randomly oriented within a plane, h ∝ d. In both fiber networks, the free segment length, L ∝ d/fϕ. The resulting equation for the transverse stress is:
𝜎!! = 𝑘𝐸 𝜙!− 𝜙!! (7)
where n = 3 for a 3D random fiber network and n = 5 for a planar random fiber network. For the special case of Figure 1 interpreted literally, one obtains the result k~f4. Thus, one expects that the prefactor kE in Eq. 7 may be very sensitive to small variations in the fiber orientation distribution. For further details, the reader is referred to Toll [15]. In certain cases, the exponent n can be greater than 5. Toll has suggested that values of the exponent greater than 5 could occur due to the fact that fibers are aligned, which leads to a line contact geometry. The segment length L is then assumed to be proportional to
d/ϕ1+α, where α is an empirical parameter that accounts for the deviation from the point contact geometry. In this case, Eq. 7 still applies, with n= 3(1+α).
s ∝ L 4 Ed4
Fig. 1 A schematic of a representative volume element (enclosed within the dashed lines)
for deformation of a planar fiber network. F is the load applied at the fiber-fiber contact,
h is the height of the pore space, and L is the segment length between two fiber-fiber
contacts
3. Experimental
3.1 Materials. Bisphenol-A-polysulfone (PSU) and poly(trimethyl hexamethylene
terephthalamide) (PA 6(3)T) were purchased from Sigma Aldrich and Scientific Polymer Products, respectively. Both PSU and PA 6(3)T are glassy amorphous solids at room temperature, with glass transition temperatures of 188°C and 151°C, respectively, as measured by Differential Scanning Calorimetry (TA Q100). N,N-dimethyl formamide (DMF), N,N-dimethyl acetamide (DMAc), and N-methyl pyrrolidone (NMP) were obtained from Sigma-Aldrich and used as received, as solvents for preparing the polymeric solutions used for electrospinning. Formic acid (FA) was added to some solutions in small amounts to modify their electrical properties in order to change fiber diameter.
3.2 Fabrication. A vertically aligned, parallel plate setup was used for electrospinning,
as described elsewhere [9]. The top plate was 15cm in diameter and charged with a high voltage supply (Gamma High Voltage Research, ES40P) in the range of 10-30 kV. The grounded bottom plate, which also acts as the collector for the fiber mat, was a 15cm
h
L
F
x15cm stainless steel platform. The tip-to-collector distance (TCD) was varied from 15 to 40 cm by adjusting the height of the bottom plate. The polymeric solution was loaded into a syringe attached by Teflon tubing to a stainless steel nozzle (1.6 mm OD, 1.0 mm ID) that protruded 21 mm through the center of the top plate. A digitally controlled syringe pump (Harvard Apparatus, PHD 2000) was used to control flow rates of the polymer solution in the range of 0.005-0.02mL/min. The thickness of the mat was controlled from ~15 µm to 200+ µm by varying the time allowed for deposition (30 minutes to 3 hours).
3.3 Post-processing. The as-spun mats were annealed thermally in a Thermolyne lab
oven (FD1545M) to strengthen the electrospun mat, as previously reported [9]. The mats were held in plane during the annealing process by draping over on a petri dish that is 10 cm in diameter. The PSU mats were annealed at temperatures between 180 and 210 °C for one hour, whereas the PA 6(3)T mats were annealed at temperatures between 130 and 170 °C for 2 hours. Both annealing ranges were chosen to span from below to above the glass transition (Tg) for each polymer.
3.4 Characterization. The fiber diameter, fiber orientation and initial solidity of electrospun mats were characterized. The average fiber diameter was calculated from the measurement of 30 to 50 fibers from images taken with a scanning electron microscope (SEM, JEOL-JSM-6060). The SEM images were also used for the analysis of fiber orientation using the method by Tzeranis [21]. This algorithm is based on the orientation of “simple neighborhoods” i.e. a function of only one coordinate after orienting the coordinate system along the principal directions, as proposed by Jahne [22]. The derivatives of the pixel intensity along the x- and y- directions form a structure tensor, of which the eigenvectors represent the local orientation of the fibers. An orientation angle, 𝜃, with respect to the x-axis can also be obtained. The orientation factor f can then be computed from the fiber orientation distribution.
The initial solidity was calculated by
𝜙! =!!.!!!!!.!!
𝜙!.!! is the solidity calculated using a gravimetric method in which the mat thickness
(𝑡!.!!) was measured using an adjustable measuring force digital micrometer (Model CLM 1.6”QM, Mitutoyo, Japan) with a contact force of 0.5N. The quantity 𝑡! is an estimate of the mat thickness based on the probe position of the Agilent T150 UTM at 20µN contact force (c.f. compression testing).
3.5 Compression test. An unconfined uniaxial compression test was carried out using the
Agilent T150 UTM (Agilent Technologies, Chandler, AZ) with a load cell of 500 mN. Five 1 mm diameter discs were cut out from each of the as-spun or annealed mats. Each of the discs was subjected to five cycles of loading and unloading in compression, with a maximum load of 50mN in each cycle. The compression was carried out at a strain rate of 0.01s-1 according to the ASTM D575 procedure [23]. The surface of the compression platens was lubricated with Teflon spray. The applied load (F) on the specimen and the corresponding change in thickness (Δt) of the specimen were recorded.
The planar surface area (A = 0.785mm2, assumed to be constant), initial thickness (t0) and initial solidity (ϕ0) of the mat were used to convert the raw data from the UTM into transverse engineering stress (or pressure) (σzz = F/A), engineering strain (e=Δt/t0) and solidity.
𝜙 = !!!!
!!!!" (9)
t0 was measured by the UTM with a contact force of 20µN as described above. Eq. 7 was fitted to the post-processed data in log-log form using unconstrained nonlinear optimization (fminunc in MATLAB v2011b) and the corresponding kE and n values were obtained. The total hysteresis, defined as the ratio of the unrecoverable work to the total work of deformation, was also calculated for each compression cycle and expressed as a percentage.
4. Results and Discussion
4.1 Morphology. PA 6(3)T mats consisting of smooth fibers with diameters of (0.45 ±
(0.34 ± 0.04) µm and (0.7 ± 0.3) µm were successfully electrospun, as shown in Figure 2. The PA 6(3)T and PSU mats with smaller fiber diameter have narrower fiber diameter distributions than those of PA 6(3)T and PSU mats with larger fiber diameter. The samples used in this report were those with fibers diameters of (0.45 ± 0.03) µm and (0.7 ± 0.3) µm for PA 6(3)T and PSU, respectively, unless specified otherwise.
Annealing the electrospun mats at a temperature below Tg did not noticeably change the morphology of the fibers. Welding between fibers at fiber-fiber junctions was observed for the mats annealed at Tg, and became more prominent with increasing annealing temperature, as shown qualitatively in Figure 3. For both polymers, at temperatures approximately 20oC above Tg, welding occurs not only at fiber-fiber junctions but also along the lengths of parallel fibers, resulting in the formation of fiber “bundles”. The morphological changes of PA 6(3)T fibers were more significant than those for PSU when annealed at approximately 20oC above Tg of the respective polymer. This could be due to the longer annealing time used for PA 6(3)T.
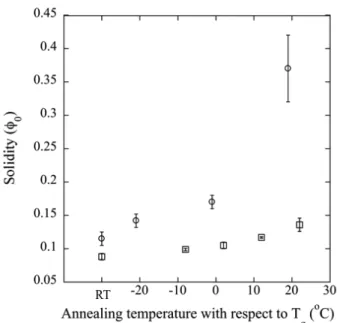
The initial solidity of the electrospun mats was observed to increase with increasing annealing temperature, as shown in Figure 4. The solidities of the PA 6(3)T mats increased from 0.14 ± 0.01 to 0.37 ± 0.05 as the annealing temperature was increased from approximately 20°C below Tg to approximately 20°C above Tg; the solidities of the PSU mats increased from 0.099 ± 0.005 to 0.14 ± 0.01 as the annealing temperature was increased from 10°C below Tg to 20°C above Tg
Fig. 2 SEM images of as-spun electrospun PA 6(3)T and PSU mats with different fiber
diameters. A) PA 6(3)T with average fiber diameter of 0.45µm; B) PA 6(3)T with average fiber diameter of 1.2µm; C) PSU with average fiber diameter of 0.7µm; D) PSU with average fiber diameter of 0.34µm. The scale bars for the micrographs are 0.5µm, 2µm, 1µm, and 1µm, respectively
Fig. 3 SEM images of the electrospun PA 6(3)T (average fiber diameter = 0.45µm) and
PSU (average fiber diameter =0.7µm) mats after thermal annealing. The scale bars for the PA 6(3)T micrographs are 1µm, and the scale bars for the PSU micrographs are 2µm
Fig. 4 Solidities of electrospun PSU (squares) and PA 6(3)T (circles) mats after thermal
annealing. The annealing temperature of room temperature (RT) represents the as-spun mats
4.2 Compressive properties. Typical stress-strain curves for five consecutive
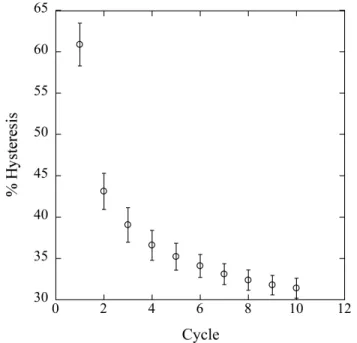
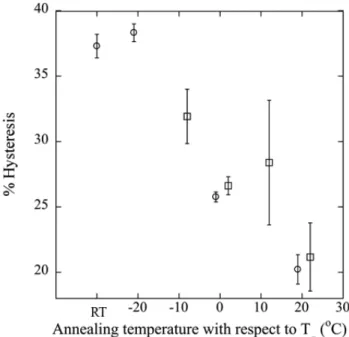
compression load-unload cycles are shown in Figure 5 for a mat of PA 6(3)T annealed at 130°C. The first compression cycle resulted in the greatest unrecoverable strain (~0.55 mm/mm in this sample shown). This is likely due to a significant amount of fiber slippage occurring during the first loading segment [24]. The irreversible fiber slippage is also a major contributor to the large hysteresis in the first compression cycle of the mat. The hysteresis was highest for the first cycle (~61%) and decreased with each subsequent cycle, as shown in Figure 6. The hysteresis of the fifth compression cycle was (35 ± 2)% and for the tenth compression cycle was (31 ± 1)%, suggesting that the electrospun mats were well conditioned after five compression cycles. Hence, all the electrospun mats were compressed up to five cycles, and data from the fifth compression cycle were used for analysis. The hysteresis (of the fifth compression cycle) was found to decrease with increasing annealing temperature, as shown in Figure 7. This is likely due to reduced fiber slippage for mats annealed at higher temperature as a result of welding at fiber-fiber junctions, as confirmed by the SEM micrographs.
Fig. 5 A typical stress-strain curves for five consecutive load-unload compression cycles
on an electrospun mat. The sample shown here is a PA 6(3)T mat annealed at 130°C
Fig. 6 A plot of % hysteresis after each compression cycle. The error bar is obtained from
the standard deviation of five replicates
Fig. 7 Hysteresis of the fifth compression cycle for PSU (squares) and PA 6(3)T (circles)
mats annealed at different temperatures. The annealing temperature at room temperature (RT) represents the as-spun mats. Compression test was not performed on as-spun PSU mat due to the lack of mechanical integrity for sample handling
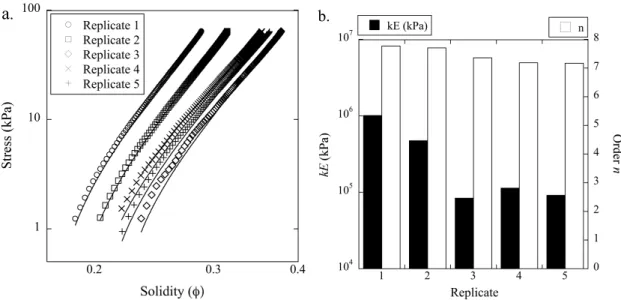
Data from the unloading segment of the fifth compression cycle was fitted to the power law of Eq. 7, in log-log form. It is worth noting that all five compression cycles have almost identical unloading curves, indicating that the fiber slippage during the unloading segments is insignificant. Typical results for fitting of the fifth unloading segment are shown in Figure 8(a) for five replicates from the same electrospun mat . Although the fit for each individual replicate is good (R2 > 0.9), there is considerable variation (a spread of ~1 order of magnitude) in the fitted kE values, Figure 8(b). This is due to the fact that the fitting equation is a power law; thus, even a small change in n results in an order of magnitude change (10n) in kE. The initial solidity for each replicate in Figure 8(a) corresponds to that at the end of the fifth unloading cycle, φ5,0, which varies significantly from replicate to replicate due to inhomogeneities both in the original mat and in the response of each replicate to conditioning.
Fig. 8 Results from fitting Eq. 7 to the experimental data from the fifth unloading
segment obtained for five replicates of PA 6(3)T mat annealed at 130oC. (a.) A plot of stress vs. solidity for the five replicates; the solid lines are the fits using Eq. 7. (b.) The best-fit kE and n values from the replicates
Figure 9 shows the experimental results for the dependence of solidity on transverse stress for PSU and PA 6(3)T mats annealed at different temperatures, along with the best fits using Eq. 7. Since solidity is a major factor in determining transport properties of porous media, it is desirable to be able to rank different materials according to their solidity under conditions of operation. It is readily apparent from Figure 9(a), however, that the order of the solidity of the thermally annealed samples, from the lowest to the highest, are (180°C < 190°C < 210°C < 200°C) for stresses in the range 0.1-1 kPa. This changes to (180°C < 210°C < 190°C < 200°C) for 1-20 kPa and to (210°C < 180°C < 200°C < 190°C), for stresses >20 kPa. While initial solidity plays an important role in the relative ranking of materials, it is not the only important parameter. For the PSU mats annealed at different temperatures and operated at applied stresses greater than 20kPa, the rank order follows the magnitude of n (or kE). For PA 6(3)T annealed at different temperatures, the one annealed at 150°C has the lowest solidity, followed by the as-spun mat and then those annealed at 130°C and 170°C. For most filtration applications, the membrane experiences operating pressures in the range from 10 kPa to 500 kPa [25]. The compressibility is defined as β=dφ/φdσzz, which can be simplified to β=1/(nkEφn); thus,
the compressibilities of electrospun mats are functions of n and kE. A high value of kE results in a less compressible mat; whereas a high value of n results in a more compressible mat at low solidity but a less compressible mat at high solidity. From Figure 9, it is apparent that performance of a fibrous membrane or filter depends strongly on both the initial solidity and the pressure-dependent compressibility of the material (as described by ϕ0, kE and n) and the relevant operating pressure for the application. For self-supported membranes that may also experience in-plane tension during operation, it is also worth noting that the electrospun PSU and PA 6(3)T mats annealed below Tg have lower tensile strengths (~1-2 MPa) [9]; thus, it is advisable to anneal the electrospun mats at or above Tg for better overall mechanical integrity.
Fig. 9 Stress versus solidity for PSU (a) and PA 6(3)T (b) annealed at different
temperatures. The lines are the best-fit results using Eq. 7, extrapolated to higher transverse stress (stress)
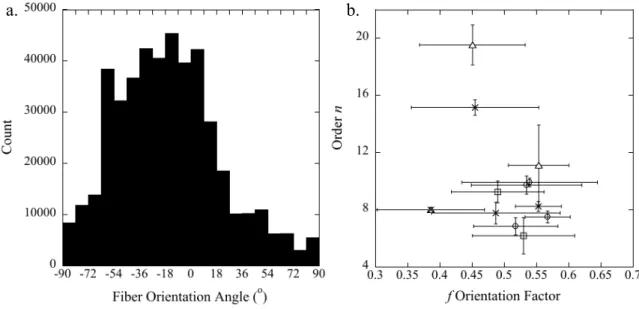
Next, we consider factors that may affect the compressibility of the electrospun mats. Toll [15] attributes the observation of n values higher than 5 to the nearly parallel alignment of fibers, through the strong dependence of the free segment length on solidity. To check this, we measured the orientation parameter f for a variety of mats having different fiber diameters, annealing temperatures and mat thicknesses. A typical
orientation distribution of the fibers within the plane of the mat is shown in Figure 10 (a); the corresponding f is 0.47 for this sample. The n values for all of the mats thus characterized are plotted versus the orientation parameter in Figure 10 (b). No strong correlation is observed.
Fig. 10 (a.) The angle distribution of the fibers from the PA 6(3)T annealed at 130°C.
The corresponding f orientation factor is 0.47. (b.) Fitted n values versus the fiber orientation for the PA 6(3)T mats. PA 6(3)T of different annealing time (circles); PA 6(3)T of different fiber diameter (squares); PA 6(3)T of different annealing temperature (triangles); PA 6(3)T of different mat thickness (crosses)
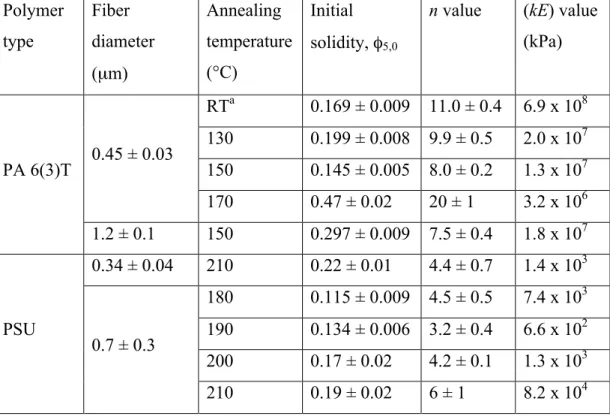
Values of n and kE of electrospun PA 6(3)T and PSU mats are shown in Table 1. The results for the as-spun PSU mat are not included because the mat was difficult to handle due to the lack of mechanical integrity. For both PA 6(3)T and PSU, the value of the exponent n is lowest for the samples annealed at their respective Tg’s. The higher n values for samples annealed below Tg are attributed to more fiber slippage (high hysteresis as shown in Figure 7), which is a result of less fiber-fiber junction welding in these mats relative to those annealed near Tg. The higher n values for samples annealed above Tg are attributed to a reduction in the thickness of the membrane as the mats shrunk in the through-plane direction during annealing; in this case, reduction of thickness implies a more planar 2D orientation of the fibers. The exceptionally high n
value of PA 6(3)T annealed at 170oC is attributed to the significant amount of bonding along the lengths of the fibers, as is apparent from Figure 3. The n values for the electrospun PA 6(3)T mats are generally much higher than those of PSU mats.
The compression test was also performed on PA 6(3)T and PSU mats of different fiber diameter. An increase in the fiber diameter of PA 6(3)T resulted a slight decrease in the n value; whereas an increase in the fiber diameter of PSU resulted a slight increase in the n value, as shown in Table 1. There is no statistically significant correlation between the n values and fiber diameter, even though the fiber diameters vary by a factor of 2 to 3. The lack of any fiber diameter dependence is consistent with Eq. 7, in which fiber diameter does not appear explicitly.
Table 1: Compressibility properties of electrospun mats. The error bars reported were obtained from the standard deviation of five replicates. The standard deviations of the kE values are comparable to the orders of magnitude; these values should be interpreted with caution. Polymer type Fiber diameter (µm) Annealing temperature (°C) Initial solidity, φ5,0
n value (kE) value (kPa) PA 6(3)T 0.45 ± 0.03 RTa 0.169 ± 0.009 11.0 ± 0.4 6.9 x 10⁸ 130 0.199 ± 0.008 9.9 ± 0.5 2.0 x 10⁷ 150 0.145 ± 0.005 8.0 ± 0.2 1.3 x 10⁷ 170 0.47 ± 0.02 20 ± 1 3.2 x 10⁶ 1.2 ± 0.1 150 0.297 ± 0.009 7.5 ± 0.4 1.8 x 10⁷ PSU 0.34 ± 0.04 210 0.22 ± 0.01 4.4 ± 0.7 1.4 x 10³ 0.7 ± 0.3 180 0.115 ± 0.009 4.5 ± 0.5 7.4 x 10³ 190 0.134 ± 0.006 3.2 ± 0.4 6.6 x 10² 200 0.17 ± 0.02 4.2 ± 0.1 1.3 x 10³ 210 0.19 ± 0.02 6 ± 1 8.2 x 10⁴ (a) RT stands for room temperature.
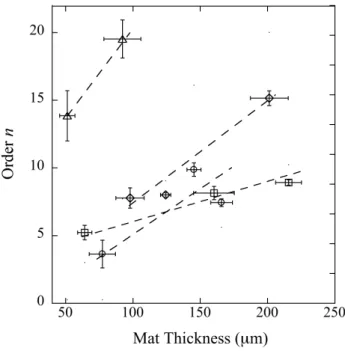
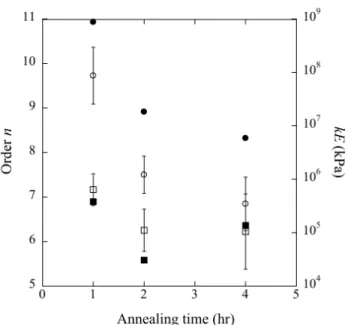
The n values were found to increase with increasing mat thickness, regardless of composition or annealing temperature, as illustrated best in Figure 11 by the data for the PA 6(3)T mats annealed at 150°C. We speculate that the increase in n values with thickness can be attributed to incomplete welding between fibers in the thicker samples for the annealing times used (2 hours for PA 6(3)T and 1 hour for PSU). To confirm this, mats of PSU and PA 6(3)T with the same as-spun thickness (250µm) were annealed for 1, 2 and 4 hours at 150oC (PSU) or 200oC (PA 6(3)T). These results are shown in Figure 12. It is observed that the fitted n values decreased with increasing annealing time in the vicinity of Tg, indicative of more complete welding at fiber junctions. It should be noted, however, that this trend does not persist far above Tg, where bonding of parallel fibers leads to a significant change of morphology from the original fibrous form (c.f. Figure 3).
Fig. 11 Effect of mat thickness on n for PSU and PA 6(3)T fiber mats. PSU mats
annealed at 210°C (squares); PA 6(3)T mats annealed at 130°C (circles); PA 6(3)T mats annealed at 150°C (diamonds); PA 6(3)T mats annealed at 170°C (triangles). The dashed lines are provided as guides to the eye
Fig. 12 Effect of annealing time on n (open symbols) and kE (filled symbols) for PSU
mats (squares) and PA 6(3)T mats (circles). The as-spun thickness are 250µm for the PA 6(3)T and PSU samples annealed at different length of time at 150oC and 200oC, respectively
The decrease in n value for mats with welded fiber-fiber junctions can be rationalized by analogy to the phenomenon of work hardening in metals. Work hardening occurs due to the generation and movement of dislocations within the crystal structure of the metals [26]. Analogously, we suggest that fiber slippage occurs more readily in mats that are not highly welded at fiber-fiber junctions. Slippage of fibers in the network, like dislocation motion in the crystal, allows the material to reorganize its structure into one that is stiffer and more compact, with fewer additional opportunities for slippage and reorganization in the “hardened” network. The models of Van Wyk and Toll do not account explicitly for such reorganization of the network with increasing strain, but it is reflected instead in the form of higher n values observed empirically.
Finally, we note that there is a correlation between kE and n values, as shown in Figure 13. The kE values increase with an increase in n values. We speculate that the k value changes along with the fiber reorientation due to slippage because k is an adjustable factor that accounts for the fiber orientation distribution, in addition to other fiber characteristics.
Fig. 13 A plot of the kE values against the n values for all of the PA 6(3)T mats. PA
6(3)T of (77 ± 4), (150 ± 10), (166 ± 7)µm thick annealed at 130°C (circles); PA 6(3)T of (100 ± 10), (124 ± 4), (200 ± 20)µm thick (in order of increasing n value) annealed at 150°C (squares); PA 6(3)T annealed for 1,2 and 4 hours (in order of decreasing n value) at 150°C (triangles); PA 6(3)T mats annealed at 170°C are not included because the significant change in morphology renders them no longer well described as fibrous media
5. Conclusions
The compressive behavior of electrospun mats was found to be well described empirically by the power law relationship proposed by Toll relating the transverse stress and the resulting solidity of fibrous media. The kE values are proportional to the n values, and they are independent of fiber diameter. The values are lowest for samples annealed near Tg, and decrease with increasing annealing time. This behavior is attributed to the increasing development of welds at fiber-fiber contacts, which prevents fiber slippage, but without sacrificing the underlying fiber morphology. Fiber slippage gives rise to a phenomenon similar to work hardening in metal. To evaluate fiber mats for transport applications like filtration or membrane separations, one needs to consider the compressibility and the relevant operating pressure, in addition to the initial solidity of the mat.
Acknowledgement
The authors would like to thank the King Fahd University of Petroleum and Minerals (KFUPM) in Dhahran, Saudi Arabia, for funding through the Center for Clean Water and Clean Energy at MIT and KFUPM under PROJECT NUMBER R5-CW-08. We would also like to thank Dr. Zafarullah Khan and Dr. S.M. Javaid Zaidi of KFUPM for many helpful discussions, and the Institute for Soldier Nanotechnology at MIT for use of facilities.
References
[1] Burger C., Hsiao B., Chu B. (2006) Annu Rev Mater Res 36 (1), 333- 368.
[2] Cancedda R., Dozin B., Giannoni P. (2003) Quarto R., Matrix Biol. 22, 81-91. [3] J.L. Lowery, N. Datta, G.C. Rutledge (2010) Biomaterials 31, 491-504.
[4] Luu Y., Kim K., Hsiao B., Chu B., Hadjiargyrou M. (2003) J. Control. Release 89, 341-353.
[5] Liu H., Kameoka J., Czaplewski D., Craighead H. (2004) Nano Lett. 4, 671-675. [6] L. Chen, L. Bromberg, J. A. Lee, H. Zhang, H. Schreuder-Gibson, P. Gibson, J.
Walker, P.T. Hammond, T.A. Hatton, G.C. Rutledge (2010) Chem. Mater. 22 (4), 1429-1436.
[7] Yoon K., Hsiao B., Chu B. (2008) J. Mater. Chem. 18, pp. 5326-5334. [8] Huang L., Manickam S., McCutcheon J., J. Membrane Sci.,
http://dx.doi.org/10.1016/j.mem- sci.2012.12.037
[9] Mannarino M.M., Rutledge G.C. (2012) Polymer 56, 3017-3025. [10] Van Wyk C.M. (1946) J. Textile Institute Trans. 37 (12), T285-T292. [11] Komori T., Itoh M. (1991) Textile Res. J. 61, 588-594.
[12] Pan N. (1993) Textile Res. J. 63, 336-345.
[13] Komori T., Itoh M. (1994) Textile Res. J. 64, 519-528. [14] Carnaby G.A., Pan N. (1989) Textile Res. J. 59, 275-284.
[15] Toll S. (2004) Polymer Engineering & Science 38 (8), 1337-1350.
[16] Baudequin M., Ryschenkow G., Roux S. (1999) Eur. Phys. J. B 12, 157-162. [17] Dunlop J. (1983) J. Textile Institute 74 (2), 92-97.
[18] Lundquist L., Leterrier F., Manson J. (2004) Polym Eng Sci 44 (1), 45-55. [19] Kim Y., McCarthy S. (1991) Polym Composite 12 (1), 13-19.
[20] Jaganathan S., Tafreshi H.V., Shim E., Pourdeyhimi B. (2009) Colloids and
Surfaces A 337, 173-179.
[21] Implementation of the Tzeranis method in MATLAB (R2009a, The Mathworks Inc.) was kindly provided by Dimitrios Tzeranis.
[22] Jahne B., (2005) Digital Image Processing, Springer, New York. [23] ASTM Standard D575, 1991 (2012), Standard Test Methods for Rubber
Properties in Compression, ASTM International, West Conshohocken, PA, 2012. [24] Kim Y., McCarthy S. (1991) Polymer Composites 12 (1), 13-19.
[25] Li N., Fane A., Ho W., Matsuura T. (2008) Advanced Membrane Technology and
Applications, Wiley, New Jersey, 102, Fig.5.1.
[26] Degarmo P., Black J.T., Kohser R. A. (2003) Materials and Processes in
Manufacturing (9th ed.), Wiley, New Jersey.