The Impact of Therapeutic
Improvements in Reducing Peptic
Ulcer Mortality in Europe
CARLO LA VECCHIA* •*, FRANCA LUCCHINI\ EVA NEGRI", VALERIO REGGI* AND FABIO LEVI#•*
La Vecchia C (Institut Universitaire de Medecine Sociale et Preventive, Bugnon 17, 1005 Lausanne, Switzerland), Lucchini F, Negri E, Reggi V and Levi F. The impact of therapeutic improvements in reducing peptic ulcer mortality in Europe. International Journal of Epidemiology 1993; 22: 96-106.
Trends in death certification rates from peptic ulcer between 1955 and 1989 have been analysed for 24 European countries on the basis of age-specific and age-standardized rates, and a log-linear model to estimate the effects of age, cohort of birth and period of death. For males, in all Western countries there were substantial declines in mortality. In the late 1950s, the range of variation of the world standardized rates was between 4/100 000 in France and 17.8 in Portugal. In the late 1980s, only Ireland had a rate over 5/100 000, and values for most Western countries ranged between 2 and 4/100 000. The average fall in rates over the last three decades was 56%. Of this, a high proportion (45%) was registered between 1975 and 1984. In Eastern Europe, no systematic change was observed until the early 1970s, but over the last 15 years peptic ulcer mortality declined by an average of 20%. In 1985-1989 the lowest rate was 4.5/100 000 in Bulgaria, and for all other countries peptic ulcer mortality ranged between 5 and 7.2/100 000. Peptic ulcer mortality was substantially lower in females, and showed no appreciable modification in Western Europe, and several increases in Eastern Europe until the mid 1970s. Thereafter, mortality declined by an overall 25% in the West and 15% in the East. Earlier declines for males in Western Europe were chiefly related to a cohort effect, reflecting more favourable risk factor exposure {such as diet, Helicobacter pylori or smoking) of subsequent generations. The recent falls, in contrast, were mainly on a period of death basis indicating therapeutic advancements (including the introduction of H2-receptor-antagonists in the mid-1970s) as the major determinant. These falls correspond to about 20 000 deaths from peptic ulcer avoided every year in the whole of Europe.
Peptic ulcer had become a major public health prob-lem and a common cause of death by the middle of the current century. The rates had been rising in most developed countries during the first half of the century.1'2
Thereafter, however, ulcer rates have started to decline, mainly on a cohort of birth basis, i.e. starting from younger generations.3"13 This trend pattern prob-ably reflects favourable changes in exposure to risk factors (such as diet, smoking and infectious agents) in more recent generations.
Important downward trends in peptic ulcer mor-tality were also observed from the late 1970s, following the introduction of effective therapies (mainly histamine-2(H2)-receptor-antagonists). These rate
• Institut Universitaire de Medecine SociaJe et Preventive, Bugnon 17, 1005 Lausanne, Switzerland.
*• Istitulo di Ricerche Farmacologiche "Mario Negn', via Eritrea 62, 20157 Milano, Italy.
f Division of Drug Management and Policies, WHO, av. Appia 20, 1211 Geneva 27, Switzerland.
t Registre Vaudois des Tumeurs, CHUV — Falaises 1,1011 Lausanne, Switzerland.
changes were, therefore, mainly on a period of death basis, since these therapies favourably affected ulcer mortality during the same calendar period for various age groups.13"13
To understand further the underlying determinants of peptic ulcer mortality trends, this article will sum-marize changes in mortality in various European coun-tries between the late 1950s and the mid 1970s (i.e. before the introduction of effective therapies), and thereafter, i.e. up to the late 1980s. The related impact in terms of public health and estimated numbers of avoided deaths will also be evaluated and discussed. MATERIALS AND METHODS
Death certification numbers from peptic ulcer, stratified for sex and 5-year age groups for 24 Euro-pean countries (excluding a few small countries like Iceland, Luxembourg, Malta, Liechtenstein etc.), were derived from copies of the original computer tapes of the World Health Organization (WHO) database. During the calendar period considered (1955-1989), four different revisions of the International Classifica-96
PEPTIC ULCER MORTALITY DECLINE 97
tion of Diseases (ICD)16"19 were used. Classification of peptic ulcer deaths was recoded according to the Ninth Revision of the ICD. Gastric ulcer (ICD 540 in the Sixth and Seventh Revisions; ICD 531 in the Eighth and Ninth) duodenal ulcer (ICD 541 in the Sixth and Seventh Revisions; ICD 532 in the Eighth and Ninth), gastrojejunal ulcer (ICD 542 in the Sixth and Seventh Revisions; ICD 534 in the Eighth and Ninth), and gastroduodenal ulcer (ICD 533 in the Eighth and Ninth Revisions) were grouped together on account of dif-ficulties in the interpretation of potential changes in classification and death certification reliability.
Estimates of the resident population, generally based on official censuses, were obtained from the same WHO databank. From the matrices of certified deaths and resident populations, age-standardized rates (on the World standard population) were com-puted. Besides overall age-adjusted rates, truncated ones at age 35-64 were chosen for presentation. Trun-cated rates are of interest for at least two reasons; since: i) they provide information specifically on trends in middle age, and ii) death certification in the elderly is generally less reliable, and may therefore in-troduce spurious trends in rates.
In a few countries, data were missing for part of one or more calendar periods. When a single year was missing within a quinquennium, numerators and denominators were interpolated linearly for the previous and subsequent calendar years. No extrapola-tion was made for missing data at the beginning or the end of the calendar period considered, or when data on one or more quinquennia were not available.
Further, an age, period and cohort model with arbitrary constraints on the parameters was applied to the matrices of age-specific rates between 25 and 79 years.
For the purpose of model fitting deaths among those aged over 79 were not considered, since death certifica-tion is known to be less accurate in older age groups. We chose 25 as the lower age limit, to reduce the problem of random variation due to small numbers. Cohorts were defined according to the central year of birth. For instance, the earliest possible cohort con-sidered (the 1880 cohort) relates to people aged 75-79 who died in the quinquennium 19554959 : they could have been born in any of 10 years from 1875 to 1885 inclusive.
The method was derived from that proposed by Osmond and Gardner,20 and has been previously described.21 Briefly, from the matrices of age-specific death rates for each 5-year calendar period and age group, the effect of age, birth cohort and period of death was evaluated through a log-linear Poisson
model, fitted using the Generalized Linear Interactive Modelling (GLIM) procedure22 with appropriate user-supplied macros.21 In simplified terms, the estimates presented are derived from the model including the three factors (age/cohort/period) which minimizes the sum of the Euclidean distances from the three possible two-factor models (age/period; age/cohort; period/ cohort). Cohort and period of death values were averaged to unity; the age values are interpretable in terms of mean age-specific death rates in the period considered. Cohort values related to earlier and more recent periods are based on fewer age-specific rates (e.g. only one for the 1885 cohort, two for 1890, etc.) and hence are less stable and reliable than central ones. RESULTS
Table 1 gives the overall death certification rates from peptic ulcer in males for three selected calendar quin-quennia, 1955-1959, 1970-1974 and 1985-1989 in 16 Western European and eight Eastern European coun-tries. In all Western countries there were substantial declines in mortality. In the late 1950s, the range of variation of overall standardized rates was between 4.0/100 000 in France and 17.8/100 000 in Portugal. In the early 1970s, the lowest rate was in Norway (3.8/100 000) and the highest again in Portugal (10.6/100 000). In the late 1980s, only Ireland had a rate over 5.0/100 000, and values for most Western European countries were 2-4/100 000. The average fall in rates over the last three decades was 56%. Of this, the largest part (45%) was registered between 1975 and 1988.
In Eastern Europe, peptic ulcer mortality in 1955-1959 ranged between 6.5/1OOOO0 in Czechoslovakia and 9.9/100 000 in Romania. No systematic change was observed until the early 1970s, but over the last 15 years rates declined by an average of 20%. For 1985-1989 the lowest rate (for Bulgaria) was 4.5/100 000, and for all other countries male peptic ulcer mortality was 5-7.2/100 000.
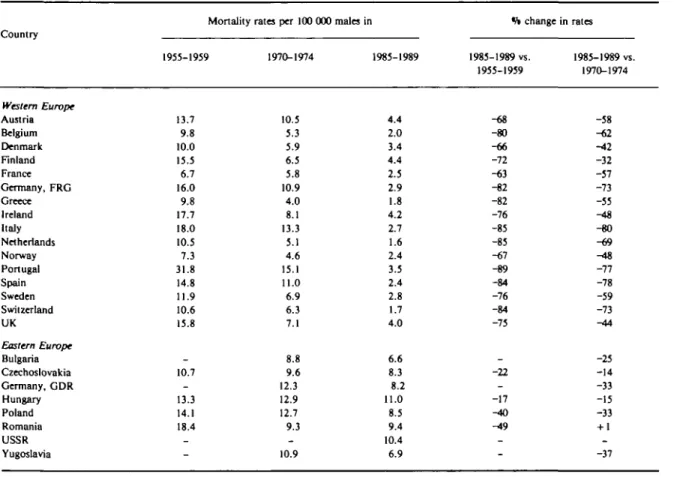
The pattern was similar, but the proportional falls were larger, when only truncated rates for 35-64 year olds were considered (Table 2). In Western Europe appreciable declines were already observed in the earlier calendar period, but these became more pro-nounced over recent years. The overall average fall between 1955 and 1989 was 74%, and most of this fall (64%) was registered after 1975. In Eastern Europe there was no appreciable trend in earlier calendar periods, but peptic ulcer mortality declined by approximately 25% from 1975 onwards.
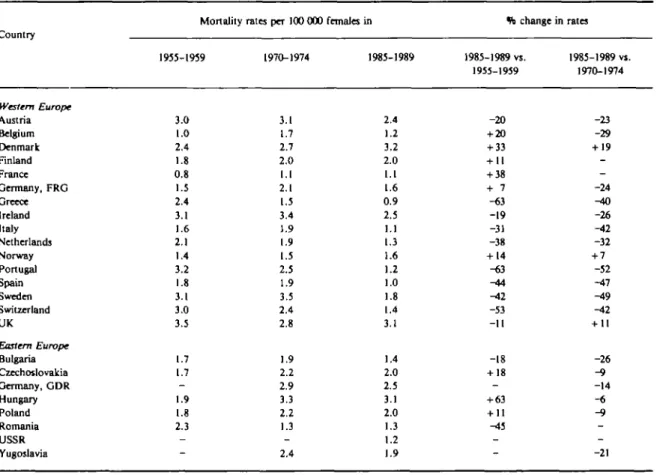
Peptic ulcer mortality was substantially lower in females (Table 3). In 1955-1959 the range of variation
TABLE I Overall death certification rates per 100 000 males from peptic ulcer in selected European countries, 1955-19S9 Country Western Europe Austria Belgium Denmark Finland France Germany, FRG Greece Ireland Italy Netherlands Norway Portugal Spain Sweden Switzerland UK Eastern Europe Bulgaria Czechoslovakia Germany, GDR Hungary Poland Romania USSR Yugoslavia Mortality 1955-1959 8.7 5.7 6.6 8.9 4.0 8.1 7.5 10.0 8.9 7.0 4.4 17.8 8.6 8.1 7.8 12.4 6.5 -7.8 7.7 9.9 -_
rates per 100 000 males
1970-1974 8.4 4.7 5.8 4.8 4.3 7.3 4.2 7.8 9.3 4.6 3.8 10.6 8.2 7.8 5.6 7.1 6.4 6.9 9.2 9.3 8.5 5.0 -7.0 in 1985-1989 4.4 2.4 4.6 4.2 2.8 3.1 2.1 5.4 3.2 2.3 3.3 3.4 2.8 3.4 2.4 4.9 4.5 5.6 6.3 7.2 6.0 5.2 5.7 6.5 1% change 1985-1989 vs. 1955-1959 -49 -58 -30 -53 -30 H52 -72 -46 -64 -67 -25 -81 -67 -58 -69 -60 . -14 --8 -22 -47 -_ in rates 1985-1989 vs. 1970-1974 -48 -49 -21 -13 -35 -58 -50 -31 -66 -50 -13 -68 -66 -56 -57 -31 -30 -19 -32 -23 -29 + 4 --7 > 5 > o o •n m ~o a m 2 5 r
TABLE 2 Truncated 35-64 year death certification rates per 100 000 mala from peptic ulcer in selected European countries, 1955-1959 to 1985-1989 Country Western Europe Austria Belgium Denmark Finland France Germany, FRG Greece Ireland Italy Netherlands Norway Portugal Spain Sweden Switzerland UK Eastern Europe Bulgaria Czechoslovakia Germany, GDR Hungary Poland Romania USSR Yugoslavia
Mortality rates per 100 000 males in
1955-1959 13.7 9.8 10.0 15.5 6.7 16.0 9.8 17.7 18.0 10.5 7.3 31.8 14.8 11.9 10.6 15.8 10.7 -13.3 14.1 18.4 _ _ 1970-1974 10.5 5.3 5.9 6.5 5.8 10.9 4.0 8.1 13.3 5.1 4.6 15.1 11.0 6.9 6.3 7.1 8.8 9.6 12.3 12.9 12.7 9.3 _ 10.9 1985-1989 4.4 2.0 3.4 4.4 2.5 2.9 1.8 4.2 2.7 1.6 2.4 3.5 2.4 2.8 1.7 4.0 6.6 8.3 8.2 11.0 8.5 9.4 10.4 6.9 ft change 1985-1989 vs. 1955-1959 -68 -80 -66 -72 -63 -82 -82 -76 -85 -85 -67 -89 -84 -76 -84 -75 -22 --17 -40 -49 _ _ in rates 1985-1989 vs. 1970-1974 -58 -62 -42 -32 -57 -73 -55 -48 -80 -69 ^t8 -77 -78 -59 -73 -44 -25 -14 -33 -15 -33 + 1 _ -37 "0 m n c Q O JO
TABLE 3 Overall death certification rates per 100 OOO females from peptic ulcer in selected European countries, 1955-1959 to 1985-1989 Country Western Europe Austria Belgium Denmark Finland France Germany, FRG Greece Ireland Italy Netherlands Norway Portugal Spain Sweden Switzerland UK Eastern Europe Bulgaria Czechoslovakia Germany, GDR Hungary Poland Romania USSR Yugoslavia
Mortality rates per 100 000
1935-1959 3.0 1.0 2.4 1.8 0.8 1.5 2.4 3.1 1.6 2.1 1.4 3.2 1.8 3.1 3.0 3.5 1.7 1.7 -1.9 1.8 2.3 -_ 1970-1974 3.1 1.7 2.7 2.0 1.1 2.1 1.5 3.4 1.9 1.9 1.5 2.5 1.9 3.5 2.4 2.8 1.9 2.2 2.9 3.3 2.2 1.3 -2.4 females in 1985-1989 2.4 1.2 3.2 2.0 1.1 1.6 0.9 2.5 1.1 1.3 1.6 1.2 1.0 1.8 1.4 3.1 1.4 2.0 2.5 3.1 2.0 1.3 1.2 1.9 *h change in 1985-1989 vs. 1955-1959 -20 + 20 + 33 + 11 + 38 + 7 -«3 -19 -31 -38 + 14 -63 -44 -42 -53 -11 -18 + 18 -+ 63 + 11 ^15 -_ rates 1985-1989 vi. 1970-1974 -23 -29 + 19 --24 ^to -26 -42 -32 + 7 -52 -47 -49 -42 + 11 -26 -9 -14 -« - 9 --21 o o > r-O ti m •v
1
oPEPTIC ULCER MORTALITY DECLINE 101
was between 0.8/100 000 in France and 3.5/100 000 in the UK. No appreciable modification was observed until the early 1970s, but from 1975 to 1989 overall peptic ulcer rates declined by approximately 25%. In Eastern Europe the rates in the 1950s were comparable (i.e. between 1.7/100 000 in Bulgaria and Czechoslo-vakia and 2.3/100 000 in Romania). Most countries showed upward trends between 1955 and 1974, followed by subsequent declines. Thus, rates in the late 1980s were about 15% lower than those registered three decades earlier.
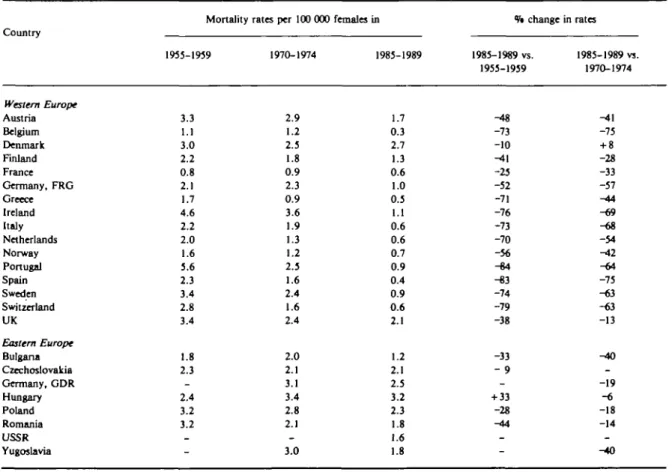
Systematic differences between Western and Eastern Europe were also evident for females on inspection of truncated rates (35-64 years, Table 4). Peptic ulcer mortality rates in middle aged women started from comparable values in the late 1950s for the two areas of the continent (i.e. a round 2-3/100 000 in most countries), but the decline was much greater in Western Europe, averaging 63% between 1955 and 1989, and 50% over the last 15 years alone. In Eastern Europe, the decline was only about 20%.
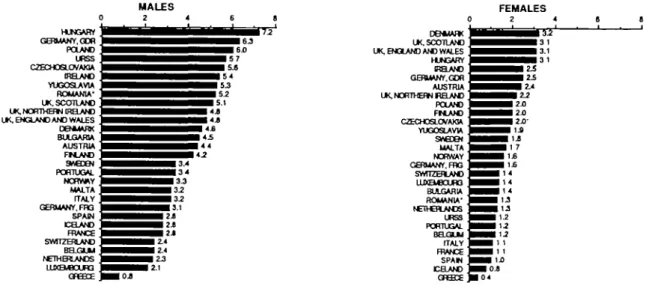
Figure 1 summarizes the range of variation in peptic ulcer mortality in various European countries over the last calendar period (1985-1989). Figure 2 gives trends in age-standardized (all age and truncated) rates in the four largest Western and the four largest Eastern European countries.
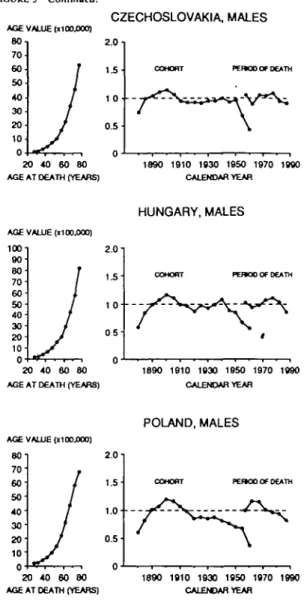
Figure 3 gives the estimates from the age, period and cohort model for the same countries, excluding Yugoslavia (where data for 1955-1959 were not available).
In the four Western countries the peak in the cohort effect for males was registered between 1890 in the UK and 1900-1910 in France, Germany and Italy, and the decline in rates for the most recent cohorts (born in 1960) was substantial, with a value of 0.20-0.03 (i.e. with a reduction from 80% to over 95%) as compared to the weighted average of all cohort values. The fall in cohort values started later in Eastern European coun-tries, particularly in Hungary, and the value for the youngest generation ranged between 0.4 (in Czecho-slovakia and Poland) and 0.55 in Hungary, i.e. the
TABLE 4 Truncated 35-64 years death certification rates per 100 000 females from ptptk ulcer in selected European countries, 1955-1959 to 1985-1989 Country Western Europe Austria Belgium Denmark Finland France Germany, FRG Greece Ireland Italy Netherlands Norway Portugal Spain Sweden Switzerland UK Eastern Europe Bulgaria Czechoslovakia Germany, GDR Hungary Poland Romania USSR Yugoslavia Mortality 1955-1959 3.3 1.1 3.0 2.2 0.8 2.1 1.7 4.6 2.2 2.0 1.6 5.6 2.3 3.4 2.8 3.4 1.8 2.3 -2.4 3.2 3.2 -rates per 100 000 1970-1974 2.9 1.2 2.5 1.8 0.9 2.3 0.9 3.6 1.9 1.3 1.2 2.5 1.6 2.4 1.6 2.4 2.0 2.1 3.1 3.4 2.8 2.1 -3.0 females in 1985-1989 1.7 0.3 2.7 1.3 0.6 1.0 0.5 1.1 0.6 0.6 0.7 0.9 0.4 0.9 0.6 2.1 1.2 2.1 2.5 3.2 2.3 1.8 1.6 1.8 % change in rates 1985-1989 vs. 1955-1959 -48 -73 -10 ^11 -25 -52 -71 -76 -73 -70 -56 -84 -83 -74 -79 -38 -33 - 9 -+ 33 -28 -44 -1985-1989 vs. 1970-1974 -41 -75 + 8 -28 -33 -57 -44 -69 -68 -54 -42 -64 -75 -63 -63 -13 ^»0 --19 -6 -18 -14 --40
0 HUNGARY GERMANY. GOR POLAND URSS CZECHOSLOVAKIA IRELAND YUGOSLAVIA ROMANIA' ' UK, NORTHERN IRELAND UK, ENGLAND AND WALES '
DENMARK ' BULGARIA ' AUSTRIA ' FM.AND ' SAEDEN ' PORTUGAL ' NORV*Y MALTA ' ITALY; GERMANY, FTC SPAIN ' ICELAND ' FRANCE ' SWITZERLAND " BELGUM NETHERLANDS " LUXEMBOURG ' 2 4 G 8 ^M^^^^^^MM^H 5 2 ^ ^ ^ • ^ • i M M M 4.1 ^^••^^^^^••••4.8 ^ ^ • M ^ ^ ^ ^ H M 4 4 •^^^•§^^•3.4 ^ • ^ ^ ^ • • • 3 4 ^^^^^^^HHH 3 J ^ ^ H M ^ ^ B 3 - 2 ^ ^ ^ ^ ^ ^ • 2 J ^^••§^•2.4 I^^HiHI 2.1 DEHUARK UK. SCOTLAND UK, ENGLAND AND WALES HUN3ARY IRELAND GERUANY.GDR AUSTRIA UK, NORTHERN BELAND POLAND FtLAND CZECHOSLOVAKIA YUGOSLAVW SveDEN MALTA NORWAY GERMANY. FOG SWITZERLAND LUXEU3CUB3 BULGARIA ROMANIA' NETHERLANDS URSS PORTUGAL BELGLU ITALY FRANCE SPAM CELAND
FIGURE 1 Age-standardized (world standard) peptic ulcer mortality rates In various European countries, 1985-1989
estimated decline was 45-60%. In the UK, the period effect showed a steady decline, but in all other coun-tries appreciable falls only became evident from the mid-1970s. The declines in period values were earlier and steeper in Western than in Eastern Europe.
Among females, the peak values for cohort effects were observed between 1910 and 1930 in the four Western European countries considered, and the declines were appreciable (from 50% in France to over 80% in other countries). Of the three Eastern Euro-pean countries, only Poland showed some fall in the cohort effect, starting from 1940 onwards. No con-siderable change was observed in Czechoslovakia, (ex-cept in the last cohort) and cohort values increased in Hungary. As in males, the estimated relative decline in period of death values over the last one or two decades was greater in Western than in Eastern Europe. DISCUSSION
This overview of trends in peptic ulcer mortality in various European countries documents and quantifies the major declines observed in peptic ulcer mortality during the last four decades.
A possible explanation for these declines in mor-tality rates could be an artefact resulting from changes in coding and diagnostic accuracy. These analyses and inferences are, in fact, based on official death certifica-tions which, to a variable extent, are subject to problems of reliability and validity. To reduce these problems, we pooled all deaths attributed to peptic ulcer (gastric, duodenal, and unspecified). However, changes in accuracy of diagnosis and certification in various countries are unlikely to explain, largely or wholly, such a consistent and substantial fall in mortality rates.
Substantial differences were evident in the two sexes and between Western and Eastern Europe, since for males in most Western European countries peptic ulcer mortality was already declining between the 1950s and the 1970s, and this decline was greater in the last decade. Rates were stable—or moving upwards—for males in Eastern Europe up to the late 1970s and some decline was only evident during the last decade. For females, ulcer mortality between the 1950s and the mid-1970s did not show appreciable and systematic changes in any area of the continent, but recent declines were greater in Western than in Eastern Europe.
Earlier declines for males in Western countries were chiefly related to a cohort effect, since rates had started to decline from younger generations.6"9'15 This probably reflects more favourable patterns of ex-posure to risk factors for ulcer (such as diet,
Helicobacter pylori or other infectious agents, and
smoking) in each subsequent generation.2-9 These downward trends were not observed in Eastern European countries, whose fall in cohort values were later and more moderate, and whose rates did not appreciably change until the mid-1970s for males, and, if anything, increased for females, indicating, that, in these countries, there was no earlier favourable modification in risk factor exposure. The recent falls, in contrast, were mainly on a period of death basis. This indicates that the main underlying determinant is related to therapeutic advancements, which affected in a similar calendar period and to a comparable extent subjects of different ages. The introduction of H2-receptor-antagonists in the late 1970s is probably the main determinant of the recent substantial declines
PEPTIC ULCER MORTALITY DECLINE 103
FRANCE
-MALES ALL AOES - MALES 35 S4 -FEMALE8AU.AOES - FEMALES 3 S M 55 60 65 70 75 80 85 Calendar years 2 0 . te. . 16 . 14. 12. 10
GERMANY, FEDERAL REPUBLIC
MALES ALL AOES MALES X I 4 FEMALES ALL AOE8 FEMALES 35-64 5 5 6 0 6 5 7 0 7 5 8 0 8 5 9 0 Calendar years 20.. is. 16. 14. 12. 10.
ITALY UNITED KINGDOM
MALES ALL AQE8 MALES 35 64 FEMALES ALL AGES
5 5 6 0 8 5 7 0 7 5 8 0 8 5 9 0 Calendar years
MAIE3ALLAOES MALESW-S4 FEMALES ALL AGES FEMALES 36 -84
60 65 70 75 80 85 90 Calendar years
CZECHOSLOVAKIA
-m- MALES ALL AOES
- o - M A L E S 36.64 - * - F E M A L E S ALL AGES -A-FEMALES M M 5 5 6 0 8 5 7 0 7 3 8 0 B 5 9 0 Calendar years HUNGARY
- MALES ALL AOES - MALES 35 M - FEMALES ALL AOES - FEMALES » . M
55 60 85 70 75 80 85 90 Calendar years
POLAND
MALES ALL AOES M A L E S U S 4 FEMALES ALL AOES FEMALES 3 * . M 55 FlOURE 2 countries. 60 65 70 75 80 85 90 Calendar years YUGOSLAVIA
- • - MALES ALL AOES - o - M A L E S W M - * - FEMALES ALL AOES -6-FEMALES 3 1 - M
65 70 75 SO 85 90 Calendar years
2 0 4 0 6 0 8 0 AGE AT DEATH (YEARS)
1890 1910 1930 1950 1970 1990 CALENDAR YEAR
20 4 0 6 0 8 0 AGE AT DEATH (YEARS)
1890 1910 1830 1950 1970 1990 CALENDAR YEAR
GERMANY FEDERAL REPUBLIC, MALES GERMANY FEDERAL REPUBLIC, FEMALES
AGE VALUE («100.000) 8 0 - 706 0 - so4 0 3 0 2 0 - 10-0 ' / / /
J
y
20 40 60 80 AGE AT DEATH (YEARS)2.0- 1.0- 0.5-COHORT PB900 OF DEATH
s
\ \
0 —'—i—•—i—•—i—•—i—•—i—•—i 1890 1910 1S30 1950 1970 1990 CALENDAR YEAR AGE VALUE ( n 00.000) 8 0 - 706 0 - so4 0 3 0 2 0 -10-J
20 40 60 80 AGE AT DEATH (YEARS)
2.0-
1.5-
1.0-
0.5-COHORT PEBOO OF DEATH
1890 1910 1930 1950 1970 1990 CALENDAR YEAR AGE VALUE (x 100.000) 80-1 7 0 6 0 5 0 4 0 3 0 2 0 - 10-1 I
1
1
I
J
20 40 60 8 0 AGE AT DEATH (YEARS)ITALY, MALES
2.0-1 ^
1.0-
o^-COHORT PERK3O OF DEATH
/ \ \
1890 1910 1930 1950 1970 1S90 CALENDAR YEAR
ITALY, FEMALES AGE VALUE (X100.OOO)
8 0 -70" 60 50 40 3 0 -20 10 2.0 n 1.5-1 . 0 - • 0.5 PCRKO OC DCATH 20 4 0 6 0 8 0 AGE AT DEATH (YEARS)
1890 1910 1930 1950 1970 1990 CALENDAR YEAR
UNITED KINGDOM, MALES UNITED KINGDOM, FEMALES
2.0i 1.5-1.0- • 0.5-reraoo OF OEATH 2.0 1.51.0 -0.5 PEKOO Or DEATH 20 40 60 80 AGE AT DEATH (YEARS)
1890 1910 1930 1950 1970 1990 CALENDAR YEAR
1890 1910 1930 1950 1970 1990 CALENDAR YEAR
20 40 60 80 AGE AT DEATH (YEARS)
FIGURE 3 Age, cohort of birth and period of death effects from peptic ulcer mortality in selected European countries, derived from a
PEPTIC ULCER MORTALITY DECLINE 105 FIGURE 3 Continued.
AGE VALUE (xi 00.000)
80 I 70 60 50 40 30 20 10 0 •
1
I
J
/
)
J
20 40 60 80AGE AT DEATH (YEARS)
AGE VALUE (H0O.OOO) 100-1 9 0 ' 60- 70- 60-50 40-30 20-
10-1
J
f
I
J
y
20 40 60 80AGE AT DEATH (YEARS)
AGE VALUE (1100,000) 8 0 ' 70' 60 5 0 ' 4 0 ' 3 0 ' 20'
10-i
/
//
J
0 -t—^-i—•—i-^ • 20 40 60 80AGE AT DEATH (YEARS)
CZECHOSLOVAKIA, MALES
2.0- 1.5-1 Oi
0.5
COHORT PEHOOOF DEATH
\ 1890 1910 1930 1950 1970 1990 CALENDAR YEAR HUNGARY, MALES 2.0- 1.5-1 0' 0 5
-COHORT PE»O0 OF DEATH ^ ^ 1 0 —•—i—•—i—•—i—•—•—•—i—•—i 1890 1910 1930 1650 1970 1990 CALENDAR YEAR POLAND, MALES 2.0- 1.5-1.0 • 0.5-n •
COHORT PEnCOOF DEATH
1890 1910 1930 1950 1970 1990
CALENDAR YEAR
AOE VALUE (HOO.000)
8 0 - 70- 60- 50- 40- 30- 20- 10-0-
J
20 40 60 80AGE AT DEATH (YEARS)
AGE VALUE (1100,000) 100-1 eo 80 70-60 50 40 30 20 10-
T
20 40 60 80AGE AT DEATH (YEARS)
AGE VALUE (HOO.OOO)
80 70 60 50 4 0 • 30 20' 10' 0 •
J
20 40 60 80AGE AT DEATH (YEARS)
CZECHOSLOVAKIA, FEMALES 1 5- 1.0- 0.5- n-COHORT — f ^ V W PSUOO OF DEATH \ 2.0-1 1.51 0 - 0.5-2.0 1.5-1890 1910 1930 1950 1S70 1990 CALENDAR YEAR HUNGARY, FEMALES PEJBOO OF DEATH 1890 1910 1930 1950 1970 1990 CALENDAR YEAR POLAND, FEMALES PERJOO OF DEATH 1.0 / - ^ ^ 0.5 1890 1910 1930 1950 1970 1990 CALENDAR YEAR
in ulcer mortality, producing a reduction in the complications of the disease (perforated ulcer and haemorrhage), as well as of the consequent surgical procedures and related mortality.n.'3-".24 Other fac-tors, however, may have had a favourable impact, including better surgical techniques, broad spectrum antibiotics, and therapeutic endoscopy.2-23-26
The impact of newer therapies on ulcer mortality was, however, heterogenous in various European countries. In Western Europe, the average fall in ulcer mortality over the last decade approached 50% among males of all ages and 65% in middle age, while the cor-responding gains in Eastern Europe were only 20% and 25%, and in females the declines were also appreciably lower in Eastern Europe.
Overall, about 20 000 deaths per year were avoided in the whole of Europe in the late 1980s. This major advance, however, cannot totally eclipse a second major message emerging from this report, i.e. that there is ample scope for further improvement in ulcer treatment in Europe through a more widespread and rational application of available treatments. Assuming that the same rate of decline reported in Western Europe could be extended to Eastern countries, a further 5000 deaths per year could have been avoided. Even in Western Europe some moderate, but con-tinuing decline in ulcer death rates was still apparent in recent years. This would suggest that further improve-ment is still possible following further therapeutic development27 and/or more rational use of drugs
in-tinue in future, it is therefore possible that peptic ulcer will become an avoidable cause of death.
ACKNOWLEDGEMENTS
This study has been made possible by a grant from the Swiss League against Cancer. Support was also re-ceived from the Italian Association for Cancer Research and the Italian League against Cancer. This study was conducted within the framework of the CNR (Italian National Research Council) Applied Projects 'Clinical Application of Oncological Research' and 'Risk factors for Disease'. We thank Mrs H-C Janin for editorial assistance.
REFERENCES
1 Susser M, Stein Z. Civilisation and peptic ulcer. Lancet 1962;
I: 115-19.
2 Langman M J S. What is happening to peptic ulcer? Br Med J
1982; 2«4: 1063-64.
3 Sonnenberg A, Muller H, Pace F. Birth-cohort analysis of peptic
ulcer mortality in Europe. J Chron Dis 1985; 38: 309-17. * Sonnenberg A. Occurrence of a cohort phenomenon in peptic ulcer
mortality from Switzerland. Gastrotnterology 1984; 86: 398-401.
5 Sonnenberg A, Muller H. Cohort and period effects in peptic ulcer
mortality from the U.S.A. Gastroenterology 1984; 86: 1261.
6 Susser M. Period effects, generation effects and age effects in peptic
ulcer mortality. J Chron Dis 1982; 35: 29-40.
7 Wylie C M. The complex wane of peptic ulcer. 1. Recent national
trends in deaths and hospital care in the United States. J Clin Gastroenterol 1981; 3: 327-32.
8 Vogt T M, Johnson R E. Recent changes in the incidence of duodenal and gastric ulcer. Am J Epidemiol 1980; 111: 713-20.
9 Kurata J H, Haile B M. Epidemiology of peptic ulcer disease. Clin Gaslroenlerol 1984; 13: 289-307.
1 0 Coggon D, Lambert P, Langman M J S. Twenty years of hospital
admissions for peptic ulcer in England and Wales. Lancet 1981; I: 1302-04.
related disease from 1972 to 1980. Hospital activity analysis data and general practice cimetidine prescribing levels. Eur J Clin Pharmacol 1983; 24:435-40.
12 Sonnenberg A. Disability pensions due to peptic ulcer in Germany
between 1953 and 1983. Am J Epidemiol 1985; 122: 106-11.
13 Sterup K, Mosbech J. Trends in the mortality from peptic ulcer in Denmark. Scand J Castroenterol 1973; 8: 49-53.
14 Bulthuis R, Laing W A. Cost effectiveness of cimetidine. Lancet
1982; U: 828-29.
" Quartini A, Negri E, La Vecchia C. Trends in peptic ulcer mortality in Italy, 1955-1985. J Epidemiol Comm Health 1992; 46: 494-97.
" World Health Organization. International Classification of Diseases—6th Revision. Geneva: WHO 1950.
17 World Health Organization. International Classification of Diseases—7th Revision. Geneva: WHO, 1957.
18 World Health Organization. International Classification of Diseases—8lh Revision. Geneva: WHO 1967.
" World Health Organization. International Classification of Diseases—9th Revision. Geneva: WHO, 1977.
2 0 Osmond C, Gardner M J. Age, period and cohort models applied to
cancer mortality rates. Slat Med 1982; 1: 245-59.
21 Decarli A, La Vecchia C. Age, period and cohort models : Review of knowledge and implementation in GLIM. Rivista di gtatistica Applicata 1987; 20: 3 9 7 - 4 1 0 .
2 2 Baker R J, Nelder J A . The GLIM System Release 3. Oxford,
Numerical Algorithms G r o u p , 1978.
2 3 Feldman M , Burton M E. Histaminej-receptor antagonists
stan-dard therapy for acid-peptic diseases. Part 2: H2 blockers in peptic ulcer disease. N Engl J Med 1990; 323: 1749-55.
2 4 Langman M J S. Ulcer complications and non-steroidal
anti-inflammatory drugs. Am J Med 1988; 84: 15-19.
2 5 Richardson C T. Gastric ulcer. In : Sleisenger M H, Fordtran J S,
(eds). Gastrointestinal Disease : Pathophysiology, Diagnosis, Management, Vol. I 4th edn. Philadelphia: W. B. Saunders, 1989, pp. 879-909.
Soil A H. Duodenal ulcer and drug therapy. In : Sleisenger M H, Fordtran J S, (eds). Gastrointestinal Disease: Patho-physiology, Diagnosis, Management. Vol. I. (4th edn). Philadelphia: W. B. Saunders, 1989, pp. 814-79.
Langman M J S. Omeprazole for resistant peptic ulcers and severe oesophageal reflux disease. Br Med J 1991; 303: 481-92.
(Revised version received July 1992)