ORIGINAL PAPER
Density and strength distribution in the human subchondral
bone plate of the patella
Sebastian Hoechel&Dieter Wirz& Magdalena Müller-Gerbl
Received: 24 February 2012 / Accepted: 4 April 2012 / Published online: 1 May 2012 # Springer-Verlag 2012
Abstract
Purpose The aim of this study was to map the strength distribution of the human patella and correlate it to the subchondral bone plate density obtained by means of com-puted tomographyosteoabsorptiometry (CT-OAM).
Methods Measurements were performed at 34 standardized points on each patella. The mineralization patterns of the subchondral bone plate of 20 patellae were displayed with the help of CT-OAM. False-coloured distribution patterns for our measurements were generated. The mechanical strength was determined at the same points by indentation testing.
Results We showed that neither the density nor the mechan-ical strength is distributed homogeneously but exhibited regular, reproducible distribution patterns which mirror long-term stress distribution in articular surfaces. A direct correlation was found between both parameters in the sub-chondral bone plate.
Conclusion The correlation of density and mechanical strength makes CT-OAM a valuable tool to assess and monitor changes in the strength of the subchondral bone plate in vivo.
Introduction
The patellofemoral joint (PFJ) consists of the articulation surfaces of the patella and the distal, anterior femur, as well as the surrounding soft tissue structures. Complaints in this anterior compartment of the knee are reported to have a one-year prevalence of 20–25 % with an increased proportion among athletes [1, 2]. Reasons for this so-called patellofemoral pain syndrome (PFPS) are abnormal tracking of the patella or increased pressure on the patel-lofemoral joint surfaces, generated by a malalignment of the lower extremity, patellar malalignment, or muscle imbalance [3,4].
Patients usually describe the pain as highly disabling with a huge impact on work and daily life routine. With the increase in sports activities in today's lifestyle, it is likely the number of incidents will rise.
PFPS treatment covers a wide variety of surgical proce-dures like tibial tuberosity transfer, lateral retinacular release, trocheoplasty or sagittal osteotomy of the patella after Morscher. The biomechanical changes in alignment of the quadriceps muscle, the patella and the patellar tendon improves the use of cartilage by enlarging the area of sur-face contact taking pressure, the nutrition of the cartilage due to a greater contact area of patella and femur and
S. Hoechel
:
M. Müller-Gerbl (*) Institute of Anatomy, University of Basel, Basel, Switzerlande-mail: [email protected]
D. Wirz
Laboratory of Biomechanics & Biocalorimetry, University of Basel,
reduces the intramedullary pressure to lower or eliminate pain [5–8].
To understand the changes occurring within the bony structures of the joint, which is initiated by realignment procedures, one has to understand the biomechanics of the knee joint and the functional architecture of the patella. Due to the external rotation of the tibial tuberosity in maximal extension of the knee, the Q-angle is maximized and the lateral facet of the patella has the most contact area with the femur condyle. The medial facet comes into contact with the femur from 20° flexion. Throughout the flexion towards 90° the contact area is shaped like a narrow band, crossing the articulation surface horizontally. Flexion towards 135° shows a change in contact pressure. Here, the medial facet lies free and only the proximal part of the lateral facet as well as the odd facet engage the femur [7,9]. During knee flexion, the lateral surface has greater contact area than the medial one, suggesting a higher load bearing capacity for the lateral surface [10].
Since it is well established that the mechanical stimuli received over a long period of time adapt the passive loco-motor system and remodel it for optimal distribution of the forces transmitted through it, the anatomy of the articulation surface of the two patella would be expected to be highly variable [11,12]. Previous data showed differences in carti-lage thickness, thickness of the subchondral bone plate, and in density distribution of the subchondral bone plate throughout the joint surface [13,14].
The uncalcified cartilage covering the patellar articulation surface has a maximum thickness of up to 5 mm in the middle of the lateral facet. The cartilage shows a wider distribution of this thickness in the medial to lateral direction than proximal to distal. From this centre it decreases concentrically to the periphery. The thickness of the underlying subchondral bone plate also follows a regular distribution pattern, having its maximum thickness on the lateral facet, with a general range from 100 μm to 1000 μm, sometimes even exceeding 2000μm, and falling off towards the periphery [14].
Concerning the distribution of the density within the subchondral bone plate of an articular surface, the non-invasive technique of computed tomography osteoabsorpti-ometry (CT-OAM) provides information on differences in relative distribution [15]. Unlike usual methods of CT den-sitometry, which allow measurements of absolute values for bone density in large areas, here the relative distribution is demonstrated over the whole joint surface in a false-colour diagram [16]. Using this method, Eckstein et al. [13] described the maximum density of the subchondral bone plate of the human patella to be constantly localized on the lateral surface, which also supports the previous results on patellar architecture.
All these findings describe regular and reproducible dis-tribution patterns of structural properties in the human
patella, which can be seen as an adaption of the locomotor system to long-term stress of the articulation surface [11–13,
15]. In order to provide information about the mechanical properties of the subchondral bone plate in relation to its density, we topographically map the mechanical strength of the subchondral bone plate of the patella and correlate our findings with the density distribution. Knowing the maximal contact area, thickness of the subchondral bone plate and density to be mainly on the lateral facet, we expect the maximal mechanical strength to be on the lateral facet as well. We hypothesize that it will highly correlate with its density distribution. If so, CT-OAM will not only show the distribution of density values, but also will give information about the actual strength of the subchondral bone plate. In clinical routine, this information could be used to identify joint parts with a pathological increase of long-term stress intake and to monitor changes in the joint structures after surgical procedures.
Material and methods Preparations
This study included ten pairs of frozen human patellae, which were obtained from the Department of Pathology (University of Basel, Switzerland), obtained from ten body donors (five male, five female; aged 61–92, average 81 years).
CT-scans (Siemens Somatom Sensation 64 CT Scanner, 1 mm slice-thickness) of each sample were performed in cooperation with the Department of Radiology (Kantonsspital Bruderholz, Basel, Switzerland).
Photographic documentation of the samples was done separately for the lateral and medial facet. Due to the tilt of these two surfaces, we documented both sides in hori-zontal view and fused the images into one whole picture. With respect to the average size of the patella, the oval shape and the minimum distance of the indentation measuring points needed to ensure the subchondral bone plate did not break. Therefore, we developed a 34-point coordinate system for CT-OAM and indentation testing. The measuring grid was size-independent and projected digitally on the fused image of every sample (Fig.1).
Density distribution patterns generated by CT-OAM For the following CT-OAM analysis, we loaded the CT datasets into ANALYSE 8.1 (Biomedical Imaging Re-source, Mayo Foundation, Rochester, USA) for visualiza-tion and measurement [17]. Using this program, we produced a 3D reconstruction of each patella in two differ-ent views. In the first reconstruction, we horizontally showed the lateral facet and in a second one the medial
facet. In the end, we fused both datasets into a combined volume. In a second step, we isolated the subchondral bone plate of the patellae manually in every CT-image for a “maximum intensity projection”. This way, for every single image point, the maximum density value of the underlying bone plate is projected onto the top surface. By classifying the Houndsfield units (HU) into steps of 100 HU and assigning them to false colours, we displayed the density distribution of the subchondral bone plate of the human patella in a diagram. To determine exact localization of the density values to be measured, we superimposed the coor-dinate system onto the density pattern of the 3D recon-structed patella (Fig.2).
Indentation testing
Ligamental and soft tissue structures attached to the patellae were removed. The cartilage, covering the subchondral bone plate, was also manually removed. For attachment to the in-dentation machine we cemented the patellae in poly(methyl-metacrylate) (PMMA). It was possible to rotate them using a ball-bearing to position the test point perpendicular to the indentation needle. Afterwards, we identified the measuring points regarding the digital coordinate system on the 3D recon-structions of the patellae. To determine the mechanical strength by indentation, an indentation test machine (Synergie 100, MTS Systems, 2 kN loadcell) was used. A steel needle
Fig. 1 Right human patella. a Medial facet in plain view. b Lateral facet in plain view. c Fused image overlaid by coordinate system with 34 measuring points for
(ø01.3 mm) created a standardized hole of 7 mm (1 mm/sec) at every measuring point. The penetration forces of all 34 identi-fied points for each patella was plotted against time by the computer and tabulated. The maximum strength needed during indention testing for every measuring point of the patella was identified and recorded. Visualization of the force distribution was done in a standardized grid system.
Density-strength correlation
To compare the density values and the mechanical strength values, we measured the density (HU) for every corresponding indentation measuring point on the CTOAM distribution chart. We scaled the dataset to 8-bit and determined the value accord-ing to the 34 measuraccord-ing points of our coordinate system with the help of ANALYSE 8.1. The recorded data was visualized in standardized grid system according to indentation data.
The recorded data of mechanical strength and subchon-dral density was examined by linear regression (Fig.3).
The Pearson product–moment correlation was determined for all measured samples. Using a two-tailed t-test, we statis-tically analysed the significance of the correlation (P<0.01).
Results
Density of the subchondral bone plate
Our results revealed that the density of the subchondral bone plate of the human patella is not distributed homogeneously. The maximum values of 19 samples were consistently found on the lateral facet with only one sample where the highest density values were situated on the medial facet. Originating at the localization of the highest density, values showed to
a
b
c
< 200
200-300
301-400
401-500
501-600
601-700
801-900
701-800
901-1000
1001-1100
1101-1200
> 1200
CT-OAM density
distribution (HU)
Fig. 2 CT-OAM density distribution image of the right human patella. a Density distribution pattern of the medial facet. b Density distribution pattern of the lateral facet. c Fused image with measuring points for density values (sample S-4)
fall off towards the periphery (Fig. 4a, b, e, and f). The density maxima showed an interindividual range between 163 HU and 199 HU.
Mechanical strength of the subchondral bone plate
The mechanical strength distribution of the subchondral bone plate tested by indentation revealed similar distribution patterns as CT-OAM did. Again, strength maxima were located in 19 samples on the lateral facet, once on the medial facet, falling off to the periphery.
Interindividual differences in mechanical strength have been seen; the minimum force needed to penetrate the sub-chondral bone plate was shown to be below 30 N in the periphery, reaching 1034 N in areas with highest density (Fig.4candg).
Mineralization-strength correlation
Visual comparison of the density distribution patterns and the distribution of penetration force values already showed strong similarities. In every sample, the patterns of density distribution and the mechanical strength distribution showed that the point of maximum is on the same facet and locali-zation. A direct correlation between the determined density values and the penetration force values of all measuring points was found for every sample (Fig. 4d and h). The coefficient of correlation (r2) ranged from 0.89 to 0.97
(mean 0.92) and was statistically significant (p < 0.01) (Table1).
Discussion
The generated density distribution charts localized the max-imum in density of the subchondral bone plate of the human patella mainly on the lateral facet, decreasing concentrically. This result was expected and matches previous studies that show similar distribution patterns with the lateral facet bear-ing the region of maximum bone density [13,18]. The one exception in our analysis, showing the maximum density to be on the medial facet, is mainly due to a malalignment and unusual pressure distribution as can be seen by the severe cartilage damage on the joint surface.
Compared with former reports of pressure transmission through the PFJ, the localization of the density maxima appears to be where the maximum area of contact and generated pressure is situated. The reason for that is the tension of the quadriceps muscle, which increases consider-ably in knee flexion [19,20]. Considering the subchondral bone to be a dynamic component that transmits forces through a joint and adapts to its mechanical need, the known theories of stress distribution through the PFJ are in strong agreement with the density distribution patterns. Areas of long-term high load transmission increase the density of the subchondral bone plate by osteoblastic 100 120 140 160 180 200 220 0 200 400 600 800 1000 Density (HU) Penetration force (N) Fig. 3 Distribution of
correlation of density values and penetration force values of sample S-4 (r200.97)
a
< 200 200-300 301-400 401-500 501-600 601-700 801-900 701-800 901-1000 1001-1100 1101-1200 > 1200 CT-OAM Density distribution (HU) < 200 200-300 301-400 401-500 501-600 601-700 801-900 901-800 901-1000 1001-1100 1101-1200 > 1200 <131 131-140 141-150 151-160 161-170 181-190 171-180 > 190 8-bit scaledCT-OAMdensity values (HU)
<109 109-121 122-134 135-147 148-160 174-186 161-173 > 186
b
f
e
c
g
<210 210-325 326-440 441-555 556-670 786-900 671-785 > 900 Penetration force (N) <130 130-180 181-230 231-280 281-330 381-430 330-380 > 430 Distribution of correlation 50 100 150 200 0 200 400 600Scaled density (HU)
Penetration force (N)
100 120 140 160 180 200 0 500 1000Scaled density (HU)
Penetration force (N)
calcium deposition and the density distribution finds its maximum here [21, 22].
For mechanical properties such as the strength of the sub-chondral bone plate in correlation to the density distribution, recent studies provide data about the inferior tibial facies and the glenoid cavity. Here, a direct correlation between these two parameters can be seen [13,23,24]. These authors imply clinical use of density distribution patterns generated with CT-OAM to determine subchondral bone quality for optimal screwing positions in orthopaedic endoprotheses. Our results on the subchondral bone plate of the human patella also state a high correlation between the density and the mechanical strength. The correlation clearly states that the density distri-bution patterns of human patellae generated by the means of CT-OAM also describe its mechanical strength. Apparently, we can see the density distribution throughout the subchondral bone plate of a joint as a parameter of long-term load intake which results in osteoblastic calcium deposition and leads to a correlating increase in strength.
Changes in the loading history of a joint could therefore be visualized and monitored in vivo with CT-OAM. If, in surgical procedures, the loading of the PFJ is changed in order to treat PFPS, the effect of the procedure on the PFJ and the changes occurring in the subchondral bone plate could be analysed in vivo to monitor the outcome and to follow-up the result.
Conclusion
Since the subchondral bone plate in a diarthrodial joint is a dynamic component, it adapts to its mechanical needs gen-erated by work, sports or daily routine. Areas exposed to long-term high load transmission increase in density.
The density distribution in the subchondral bone plate of the human patella gives not only information about the mineralization by osteoblastic calcium deposition, but also correlates to its mechanical strength and therefore is a parameter for the long-term load distribution through the articular surfaces of the PFJ.
The correlation of density distribution and mechanical strength makes CT-OAM a useful tool to determine the strength distribution of the subchondral bone plate in vivo as well as analyse and monitor changes over time.
Disorders in shape, size, and the resulting differences in contact area and pressure distributions could be diagnosed
Fig. 4 Correlation of density and penetration force of two representa-tive samples [S-13 (a–d) and S-3 (e–f)]. a, e Density distribution pattern generated by CT-OAM, overlaid by the coordinate system for the location of the 34 defined points for the simultaneous measure-ments of density and force values. b, f Visual representation of density values at measurement points, HU scaled to 8-bit. c, g Visual repre-sentation of penetration force values at measuring points. d, h Distri-bution of correlation for density values (HU, 8-bit scaled) and penetration force (N)
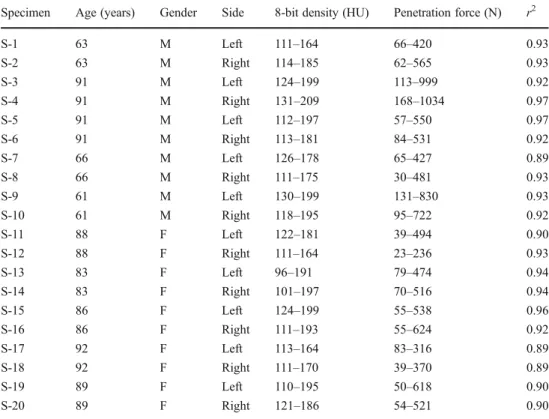
Table 1 Clinical and statistical data of the specimens
M male, F female
Specimen Age (years) Gender Side 8-bit density (HU) Penetration force (N) r2
S-1 63 M Left 111–164 66–420 0.93 S-2 63 M Right 114–185 62–565 0.93 S-3 91 M Left 124–199 113–999 0.92 S-4 91 M Right 131–209 168–1034 0.97 S-5 91 M Left 112–197 57–550 0.97 S-6 91 M Right 113–181 84–531 0.92 S-7 66 M Left 126–178 65–427 0.89 S-8 66 M Right 111–175 30–481 0.93 S-9 61 M Left 130–199 131–830 0.93 S-10 61 M Right 118–195 95–722 0.92 S-11 88 F Left 122–181 39–494 0.90 S-12 88 F Right 111–164 23–236 0.93 S-13 83 F Left 96–191 79–474 0.94 S-14 83 F Right 101–197 70–516 0.94 S-15 86 F Left 124–199 55–538 0.96 S-16 86 F Right 111–193 55–624 0.92 S-17 92 F Left 113–164 83–316 0.89 S-18 92 F Right 111–170 39–370 0.89 S-19 89 F Left 110–195 50–618 0.90 S-20 89 F Right 121–186 54–521 0.90
R
as well as monitored after surgical procedures. The effect of realignment procedures on the PFJ can be assessed in follow-up studies to visualize the changes in load transmission.
References
1. Outerbridge RE (1961) The etiology of chondromalacia patellae. J Bone Joint Surg Br 43-B:752–757
2. van Middelkoop M, van Linschoten R, Berger MY, Koes BW, Bierma-Zeinstra SM (2008) Knee complaints seen in general prac-tice: active sport participants versus non-sport participants. BMC Musculoskelet Disord 9:36. doi:10.1186/1471-2474-9-36
3. Malek MM, Mangine RE (1981) Patellofemoral pain syndromes: a comprehensive and conservative approach. J Orthop Sports Phys Ther 2(3):108–116
4. Puddu G, Giombini A, Selvanetti A (2001) Rehabilitation of sports injuries: current concepts. Springer, Berlin, New York
5. Christoforakis J, Bull AM, Strachan RK, Shymkiw R, Senavongse W, Amis AA (2006) Effects of lateral retinacular release on the lateral stability of the patella. Knee Surg Sports Traumatol Arthrosc 14(3):273–277. doi:10.1007/s00167-005-0699-5
6. Feller JA, Amis AA, Andrish JT, Arendt EA, Erasmus PJ, Powers CM (2007) Surgical biomechanics of the patellofemoral joint. Arthroscopy 23(5):542–553. doi:10.1016/j.arthro.2007.03.006
7. Fulkerson JP, Hungerford DS, Ficat RP (1990) Disorders of the patellofemoral joint, 2nd edn. Williams & Wilkins, Baltimore 8. Pecina M, Ivkovic A, Hudetz D, Smoljanovic T, Jankovic S (2010)
Sagittal osteotomy of the patella after Morscher. Int Orthop 34 (2):297–303. doi:10.1007/s00264-009-0923-x
9. Ahmed AM, Burke DL, Yu A (1983) In-vitro measurement of static pressure distribution in synovial joints. Part II: retropatellar surface. J Biomech Eng 105(3):226–236
10. Salsich GB, Ward SR, Terk MR, Powers CM (2003) In vivo assessment of patellofemoral joint contact area in individuals who are pain free. Clin Orthop Relat Res 417:277–284. doi:10.1097/01.blo.0000093024.56370.79
11. Pauwels F (1965) Gesammelte Abhandlungen zur funktionellen Anatomie des Bewegungsapparates. Springer-Verlag, Berlin, New York
12. Wolff J (1986) The law of bone remodelling. Springer-Verlag, Berlin, New York
13. Eckstein F, Muller-Gerbl M, Putz R (1992) Distribution of sub-chondral bone density and cartilage thickness in the human patella. J Anat 180(Pt 3):425–433
14. Milz S, Eckstein F, Putz R (1995) The thickness of the subchondral plate and its correlation with the thickness of the uncalcified articular cartilage in the human patella. Anat Embryol (Berl) 192 (5):437–444
15. Müller-Gerbl M (1998) The subchondral bone plate. Advances in anatomy, embryology, and cell biology, vol 141. Springer, Berlin, New York
16. Muller-Gerbl M, Weisser S, Linsenmeier U (2008) The distribution of mineral density in the cervical vertebral endplates. Eur Spine J 17(3):432–438. doi:10.1007/s00586-008-0601-5
17. Muller-Gerbl M, Putz R, Hodapp N, Schulte E, Wimmer B (1990) Demonstration of subchondral density pattern using CT-osteoabsorptiometry (CT-OAM) for the assessment of individual joint stress in live patients. Z Orthop Ihre Grenzgeb 128(2):128– 133. doi:10.1055/s-2008-1039487
18. Tillmann B, Brade H (1980) Die Beanspruchung des Femoropa-tellargelenks. Anat Anz 147:477–478
19. Maquet P (1976) Biomechanics of the knee. Springer, Berlin, Heidelberg, New York
20. Scuderi GR (1995) The patella. Springer, New York
21. Ficat RP, Hungerford DS (1977) Disorders of the patello-femoral joint. Williams & Wilkins, Baltimore
22. Minns RJ, Birnie AJ, Abernethy PJ (1979) A stress analysis of the patella, and how it relates to patellar articular cartilage lesions. J Biomech 12(9):699–711
23. Gordon KD, Duck TR, King GJ, Johnson JA (2003) Mechanical properties of subchondral cancellous bone of the radial head. J Orthop Trauma 17(4):285–289
24. Kraljevic M, Zumstein V, Wirz D, Hugli R, Muller-Gerbl M (2011) Mineralisation and mechanical strength of the glenoid cavity sub-chondral bone plate. Int Orthop 35(12):1813–1819. doi:10.1007/ s00264-011-1308-5