ISSN 1063-7834, Physics of the Solid State, 2009, Vol. 51, No. 2, pp. 322–326. © Pleiades Publishing, Ltd., 2009.
Original Russian Text © V.A. Ivanshin, I.N. Kurkin, E.V. Pomjakushina, 2009, published in Fizika Tverdogo Tela, 2009, Vol. 51, No. 2, pp. 305–309.
1. INTRODUCTION
Among the large family of copper-containing high-temperature oxide superconductors, the YBa2Cu3Ox (Y–Ba–Cu–O) compound with structural and physical properties dependent on the oxygen index 6 ≤x≤ 7 has been investigated especially extensively, including electron paramagnetic resonance (EPR) studies. In par-ticular, this is favored by the fact that the replacement of yttrium (which is located between two supercon-ducting planes CuO2) by other rare-earth ions (except for praseodymium, cerium, and terbium) at any concen-trations almost does not affect the superconducting properties of the material [1]. The majority of EPR investigations have been performed with the use of samples doped with trivalent gadolinium (Gd3+) ions.
This has made it possible to obtain important informa-tion on the types and magnitudes of interacinforma-tions directly in the bulk of the material. However, the bibli-ography of EPR experiments with impurities of other rare-earth ions is rather limited (see, for example, [2– 9]). It is interesting that EPR signals have been reliably observed only from ions of the right half of the rare-earth series (erbium, ytterbium, dysprosium, terbium), whereas a few attempts to detect the EPR absorption for some ions of the left half of this series (neodymium, praseodymium, samarium) seem to be inconclusive. For example, information on the observation of the Pr4+
EPR signal in the Y–Ba–Cu–O compound [10] is most likely erroneous because this signal should be charac-terized by a strong anisotropy of the g factor with val-ues substantially different from g ≈ 2, should have a
larger hyperfine interaction constant, and cannot be detected at room temperature.
Moreover, it should be noted that the results of EPR experiments for the Y–Ba–Cu–O compound sometimes do not correlate with each other, which is associated with the problems of the preparation of perfect crystals, the control for the doping level, the homogeneity of samples, their ageing, etc. In this respect, it is important to compare the experimental results obtained for sam-ples prepared using different techniques and to analyze variations with time.
The aforesaid is especially true in regard to the inter-pretation of the EPR spectra of intrinsic magnetic cen-ters in the Y–Ba–Cu–O compound, which frequently leads to very contradictory results. Immediately after the discovery of superconductivity in the Y–Ba–Cu–O compound, numerous experiments (see the review [11] and the corresponding references therein) revealed the EPR signal typical of Cu2+ ions with the axial
symme-try (g||≈ 2.20, g⊥≈ 2.05) characterized by an insignifi-cant orthorhombic distortion. In the majority of earlier works, the observed signals were associated with the presence of impurity phases CuO, BaCuO2, Y2Cu2O5
(blue phase), and Y2BaCuO5 (green phase). Therefore, the EPR signal at g≈ 2 was treated as an indication of the degree of purity of the sample and attributed to Cu2+
ions located at the Cu(1) position [12]. With an improvement of the technique used for preparing sam-ples, it has become clear that no EPR signals are observed in the “pure” YBa2Cu3O7 compound. In order to explain this fact, several assumptions have been made [11, 12]. For example, the antiferromagnetic
MAGNETISM
AND FERROELECTRICITY
Electron Paramagnetic Resonance
of Ce
3+and Nd
3+Impurity Ions in YBa
2
Cu
3O
6.13V. A. Ivanshin
a, b,*, I. N. Kurkin
a, and E. V. Pomjakushina
c a Kazan State University, Kremlevskaya ul. 18, Kazan, 420008 Tatarstan, Russia*e-mail: [email protected]
b Physik-Institut der Universität Zürich, Zürich, Switzerland
c Laboratory for Developments and Methods, PSI, Villigen, Switzerland and Laboratory for Neutron Scattering, ETHZ and PSI, Villigen, Switzerland
Received May 8, 2008
Abstract—The electron paramagnetic resonance (EPR) spectra of Ce3+ and Nd3+ impurity ions in unoriented powders of the YBa2Cu3O6.13 compound are observed and interpreted for the first time. It is demonstrated that,
upon long-term storage of the samples at room temperature, the EPR signals of these ions are masked by the spectral line (with the g factor of approximately 2) associated with the intrinsic magnetic centers due to the sig-nificant increase in its intensity.
PACS numbers: 74.70.-b, 76.30.-v
ELECTRON PARAMAGNETIC RESONANCE 323 interaction leads to the formation of Cu2+ pairs for
which the nonmagnetic singlet (S = 0) is the ground state and the triplet (S = 1) is the excited state. The wide energy spacing between the ground and excited states does not enable one to observe the EPR signal for the triplet components. At present, reasoning from the results of experiments with La2CuO4 + x compounds, it
has been universally accepted that the impossibility of observing the Cu2+ EPR signal in
quasi-two-dimen-sional cuprate high-temperature superconductors is explained by the large line width due to the static and dynamic components of the antisymmetric part of the Dzyaloshinskii–Moriya exchange interaction [11].
The purpose of the present work was to investigate the possibility of using localized magnetic moments of cerium and neodymium rare-earth elements as an impurity paramagnetic probe for the study of normal and superconducting properties of the Y–Ba–Cu–O compound with the use of EPR spectroscopy.
2. SAMPLE PREPARATION AND EXPERIMENTAL TECHNIQUE Oxygen-deficient samples Y0.99Ce0.01Ba2Cu3Ox and
Y0.99Nd0.01Ba2Cu3Ox were prepared using conventional
solid-phase synthesis from the initial components Y2O3, CeO2 (or, correspondingly, Nd2O3), BaCO3, and
CuO (Alfa, 99.99%). The corresponding amounts of the initial reactants were mixed in an agate mortar, and the prepared mixture was used for synthesizing the samples in air at temperatures of 800–920°C for at least 150 h with several intermediate grindings. Then, the samples were enriched in oxygen at a temperature of 500°C for several hours (at an oxygen pressure of 1 atm), followed by slow cooling. After this procedure, the oxygen content was equal to 6.98. The samples with the required oxygen content were produced by their heating with the appropriate amount of metallic copper in evacuated sealed silica tubes (850°C; 10 h; cooling rate, 10°C/h). The oxygen content in the reduced sam-ples was controlled by comparing the calculated and measured changes in the weights of oxidized copper and the reduced sample and amounted to ~6.13 for all samples. It is this oxygen concentration that corre-sponds to the lowest intensity of the EPR signal at g≈ 2, which can substantially complicate the possible record-ing of the EPR spectra of rare-earth ions. The phase purity of the initial and reduced samples was confirmed by X-ray diffraction analysis on a Siemens D500 dif-fractometer. The EPR spectra were measured on a Bruker ESP-300 spectrometer at a frequency of ~9.4 GHz in the temperature range 5–35 K.
In order to reveal the Ce3+ and Nd3+ EPR signals, we
investigated the Y0.99Ce0.01Ba2Cu3O6.13 and
Y0.99Nd0.01Ba2Cu3O6.13 compounds in the form of pow-ders mixed with a paraffin. The investigations were per-formed three times with an interval of three months. For convenience of comparison of the EPR line intensities,
we used the reference sample of the composition CaF2 + 0.8% Er3+ with cubic centers characterized by
the EPR line at g = 6.785 with the width comparable in the order of magnitude to the line width of the com-pounds under investigation.
3. RESULTS AND DISCUSSION
3.1. EPR Spectra of the Y0.99Ce0.01Ba2Cu3O6.13 Compound
The first attempt to detect the EPR spectrum of the Y0.99Ce0.01Ba2Cu3O6.13 compound was made within
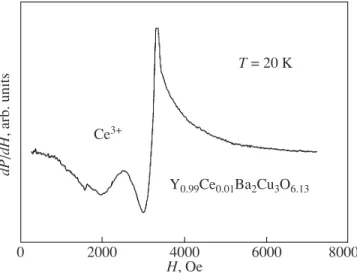
three weeks after the preparation of the sample. It was revealed that the EPR spectrum is observed at tempera-tures below 25 K and consists of two signals (Fig. 1). The more intense EPR signal at g≈ 2 (i.e., with the res-onance field Hres ≈ 3212 Oe) is characteristic of
oxy-gen-deficient undoped samples Y–Ba–Cu–O [11, 12]. The other EPR signal at g ≈ 3.01 (Hres≈ 2255 Oe) is
well resolved in the temperature range 10 K < T < 20 K and is saturated at lower temperatures. It is reasonable to assign this signal to the Ce3+ ions. Actually, this
behavior is typical of the Ce3+ EPR spectrum, which, as
a rule, is not observed at temperatures above 30 K due to the fast spin–lattice relaxation [13]. Only at temper-atures T ≤ 20 K, the spin–lattice relaxation times of Ce3+ ions are long enough for the EPR spectrum to be
recorded. The factor g = 3.01 determined from these experiments is in reasonable agreement with the theo-retical estimates made in [14] for the g factors of the Ce3+ ion in the Y–Ba–Cu–O compound: g
x ≈ 0.496,
gy≈ 0.431, and gz ≈ 3.971 (in the case where the
observed EPR spectrum is associated with the gz
com-ponent). Our corresponding calculations of the g fac-tors with the use of the crystal field parameters for the
2000 0 4000 6000 8000 H, Oe Ce3+ T = 20 K Y0.99Ce0.01Ba2Cu3O6.13 dP /dH , arb. units
Fig. 1. EPR spectrum of the Y0.99Ce0.01Ba2Cu3O6.13 com-pound at T = 20 K (within three weeks after the preparation of the sample).
324 IVANSHIN et al.
Nd3+ ion in the NdBa
2Cu3O6.0 compound led to close
values [15]: gx = –1.246, gy = –1.246, and gz = 3.462.
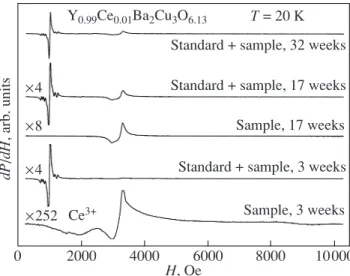
Long-term storage of the sample at room tempera-ture results in substantial changes in the EPR spectrum. Beginning with the second series of the EPR experi-ments performed within three months after the first experiments, we observed a sharp increase in the inten-sity of the signal at g ≈ 2 and a distortion of the EPR line shape, which was accompanied by masking (suppress-ing) the signal from the Ce3+ ions (Fig. 2). It should be
noted that, in the study of the Y–Ba–Cu–O compound with a low oxygen content and the Gd3+ impurity,
Rockenbauer et al. [16] observed a similar time evolu-tion of the porevolu-tion of the EPR spectrum at g ≈ 2, which was attributed to the copper ions.
In order to determine the concentration of magnetic centers associated with the Ce3+ ions and the signal at g ≈ 2 in the sample, we evaluated the ratios of the areas of these signals with respect to the reference sample (the concentration of magnetic centers in the reference
sample is equal to 1.2 × 10¹⁸ spins). The results
obtained were used to estimate the concentration of Ce3+ centers per cubic centimeter and to determine the
percentage ratios of the signal at g ≈ 2 with respect to the number of Cu(1) atoms and the signal from the rare-earth ions with respect to Y3+ ions. The results of
calcu-lations are listed in the table. A considerable deviation (by a factor of almost five) of the measured concentra-tion of Nd3+ impurity ions (from a concentration of 1%
specified in the synthesis of the sample) is primarily explained by the impossibility of determining all com-ponents of the g tensor from our EPR experiments, in which we studied unoriented polycrystals rather than single crystals. That is why the observed EPR spectrum cannot be interpreted with due regard for all paramag-netic impurity centers contained in the sample.
3.2. EPR Spectra of the Y0.99Nd0.01Ba2Cu3O6.13
Compound
Compounds Y–Ba–Cu–O containing small addi-tives of neodymium have never been investigated by the EPR method. There are only several works devoted to the study of Y–Ba–Cu–O compounds by EPR spectros-copy in which the Y3+ ions were either completely or
50% replaced by the Nd3+ ions [17–19]. Guskos et al.
[17] investigated the Nd–Ba–Cu–O compound with a low oxygen content (not a superconductor) at T ≈ 77 K and observed two lines: a narrow line (with the width ∆Hpp≈ 150 Oe at g = 3.6) and a broad line (with the
width ∆Hpp≈ 1000 Oe at g ≈ 2.13). In the authors’
opin-ion, these lines are associated with the Nd3+ ions.
How-ever, it is known that Nd3+ EPR signals have never been
observed at the liquid-nitrogen temperature due to the fast spin–lattice relaxation [13]. At least the narrow sig-nal at g = 3.6 can in no way be attributed to the Nd3+
ions. According to Likodimos et al. [18], who studied the Y0.5Nd0.5Ba2Cu3Ox compound by the EPR method
at lower temperatures (3–70 K), Nd3+ EPR signals are
not observed as a result of fast spin–lattice relaxation. This also seems to be highly improbable because it is well known that, at T < 20 K, the relaxation times of the Nd3+ ions are sufficiently long and EPR signals can be
2000 0 4000 6000 8000 10000 H, Oe dP /dH , arb. units ×4 ×8 ×4 ×252 Ce3+ Y0.99Ce0.01Ba2Cu3O6.13 T = 20 K Standard + sample, 32 weeks Standard + sample, 17 weeks Sample, 17 weeks Standard + sample, 3 weeks
Sample, 3 weeks
Fig. 2. EPR spectra of the Y0.99Ce0.01Ba2Cu3O6.13 com-pound with an impurity of 1% Ce3+ at T = 20 K for different instants of time (within 3, 17, and 32 weeks after the prep-aration of the sample).
Main characteristics of the signals in the EPR spectra of the Y0.99Ce0.01Ba2Cu3O6.13 and Y0.99Nd0.01Ba2Cu3O6.13 compounds
and their variation with time
Time of the expe-riment (number of weeks after the preparation of the sample) Concentration of magnetic centers of the signal at g ≈ 2 in Y0.99Ce0.01Ba2Cu3O6.13 (spins/cm3) Ratio of magnetic centers of the signal at
g ≈ 2 to Cu(1) ions in Y0.99Ce0.01Ba2Cu3O6.13 (%) Concentration of magnetic centers of the signal at g ≈ 2 in Y0.99Nd0.01Ba2Cu3O6.13 (spins/cm3) Ratio of magnetic centers of the signal a
g ≈ 2 to Cu(1) ions in Y0.99Nd0.01Ba2Cu3O6.13
(%)
Ratio of mag-netic centers of the signal from Ce3+ and Nd3+ ions to Y3+ ions (%) 3 3.74 × 10¹⁹ 0.65 3.60 × 10¹⁹ 0.63 0.23(Ce3+) 0.13(Nd3+) 17 5.24 × 10²⁰ 9 7.05 × 10²⁰ 12.2 – 32 7.50 × 10²⁰ 13 5.03 × 10²⁰ 8.7 –
detected easily. Baranov et al. [19] investigated Nd– Ba–Cu–O ceramic materials and single crystals in the temperature range 4–300 K at frequencies of 9.3 and 35 GHz. The authors observed the intense broad EPR lines at T < 40 K (g|| ≈ 2.15, g⊥ ≈ 2.2 at 10 K) and assigned them to the Cu2+ ions rather than to Nd3+ ions.
Therefore, the analysis of the results obtained in the above works demonstrates that no Nd3+ EPR signals
were detected in the Y–Ba–Cu–O compound.
With the aim of revealing the Nd3+ EPR signals, we
studied the Y0.99Nd0.01Ba2Cu3O6.13 compound. The EPR
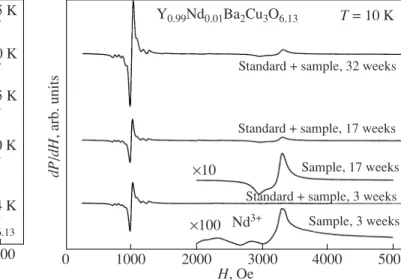
spectrum assigned to the Nd3+ ions (Fig. 3) is reliably
observed in the resonance field Hres≈ 2760 Oe at
tem-peratures in the range 10 K < T < 20 K. The probable saturation of this signal complicates its detection with a further decrease in the temperature. In turn, at T > 20 K, the EPR spectrum is not observed as a result of relax-ation broadening. Long-term storage of the sample at room temperature results in substantial changes in the EPR spectrum. As for the Y0.99Ce0.01Ba2Cu3O6.13
com-pound, beginning with the second series of the EPR experiments (i.e., within 17 weeks after the preparation of the sample), we observed a considerable increase in the intensity of the signal at g ≈ 2, which leads to the suppression of the signal from the Nd3+ ions (Fig. 4).
The estimates of the concentration of magnetic cen-ters associated with the Nd3+ ions per cubic centimeter
and the percentage ratios of the signal at g ≈ 2 with respect to the number of Cu(1) atoms and the signal from these rare-earth ions with respect to Y3+ ions are
presented in the table. The experimental g factor for the Nd3+ ion is estimated to be g ≈ 2.45, which is in
reason-able agreement with our calculations for the Y–Ba–Cu– O compound containing the Nd3+ impurity with the use
of the crystal field parameters for the Nd3+ ion in the
NdBa2Cu3O6.0 compound [15]: gx = 2.56, gy = 2.56, and
gz = 2.33.
Therefore, the closeness of the calculated g factors for the Nd3+ ions to the factor g ≈ 2.0–2.2 that
corre-sponds to the observed intense EPR signal attributed to the intrinsic magnetic centers in the Y–Ba–Cu–O com-pound allows us to make the assumption that, in the Y– Ba–Cu–O compound, the Nd3+ EPR signals, like the
Ce3+ EPR signals, are masked by the intense signal
from the Cu(1)2+ copper ions.
4. CONCLUSIONS
Thus, the impurity paramagnetic centers (Ce3+ and
Nd3+ rare-earth ions specially introduced) in the
YBa2Cu3O6.13 polycrystalline compound were
investi-gated by the EPR method. The EPR spectra of Ce3+ and
Nd3+ impurity ions in unoriented powders of the this
compound were observed and interpreted for the first time. Since the components of the g factor of the Ce3+
and Nd3+ ions are close to 2, the Ce3+ and Nd3+ EPR
sig-nals cannot be separated in these compounds beginning with some instant of time when the intensity of the sig-nal at g ≈ 2 increases drastically.
ACKNOWLEDGMENTS
We would like to thank G.V. Mamin and A.A. Rodi-onov for their assistance in performing the EPR mea-surements and M.P. Rodionova for calculating the g factors of the Ce3+ and Nd3+ ions in the Y–Ba–Cu–O
compound with the use of the crystal field parameters available in the literature.
2000 3000 4000 5000 H, Oe dP /dH , arb. units T = 35 K T = 20 K T = 15 K T = 10 K T = 4 K Y0.99Nd0.01Ba2Cu3O6.13 Nd3+
Fig. 3. Temperature dependence of the EPR spectrum of the
Y0.99Nd0.01Ba2Cu3O6.13 compound within three weeks after the preparation of the sample.
1000 0 2000 3000 4000 5000 H, Oe dP /dH , arb. units Nd3+ Y0.99Nd0.01Ba2Cu3O6.13 T = 10 K
Standard + sample, 32 weeks
Standard + sample, 17 weeks Sample, 17 weeks Standard + sample, 3 weeks
Sample, 3 weeks ×10
×100
Fig. 4. EPR spectra of the Y0.99Nd0.01Ba2Cu3O6.13 com-pound with an impurity of 1% Nd3+ at T = 10 K for different instants of time (within 3, 17, and 32 weeks after the prep-aration of the sample).
326 IVANSHIN et al.
This study was supported by the Federal Center for Collective Use of Physicochemical Investigations at the Kazan State University, the Swiss National Science Foundation (project no. IB7420-11078), and the National Centre of Competence in Research “Materials with Novel Electronic Properties” (NCCR MaNEP).
REFERENCES
1. M. B. Maple, J. Magn. Magn. Mater. 177–181, 18 (1998).
2. R. Yu. Abdulsabirov, R. Sh. Zhdanov, Ya. S. Izygzon, S. L. Korableva, I. N. Kurkin, L. L. Sedov, I. V. Yasonov, and B. Lippol’d, Sverkhprovodimost: Fiz., Khim., Tekh.
2, 52 (1989).
3. I. N. Kurkin, I. Kh. Salikhov, L. L. Sedov, M. A. Teplov, and R. Sh. Zhdanov, Zh. Éksp. Teor. Fiz. 103 (4), 1342 (1993) [JETP 76 (4), 657 (1993)].
4. H. Shimizu, K. Fujiwara, and K. Hatada, Physica C (Amsterdam) 282–287, 1349 (1997).
5. H. Shimizu, K. Fujiwara, and K. Hatada, Physica C (Amsterdam) 299, 169 (1998).
6. V. Likodimos, N. Guskos, M. Wabia, and J. Typek, Phys. Rev. B: Condens. Matter 58, 8244 (1998).
7. V. A. Ivanshin, M. R. Gafurov, I. N. Kurkin, S. P. Kurzin, A. Shengelaya, H. Keller, and M. Gutmann, Physica C (Amsterdam) 307, 61 (1998).
8. L. K. Aminov, V. A. Ivanshin, I. N. Kurkin, M. R. Gafu-rov, I. Kh. Salikhov, H. Keller, and M. Gutmann, Physica C (Amsterdam) 349, 30 (2001).
9. M. R. Gafurov, V. A. Ivanshin, I. N. Kurkin, M. P. Ridi-onova, H. Keller, M. Gutmann, and U. Staub, J. Magn. Reson. 161, 210 (2003).
10. N. Udomkan, P. Winotai, R. Suryanarayanan, and N. Charoenthai, Supercond. Sci. Technol. 18, 1294 (2005).
11. B. I. Kochelaev and G. B. Teitelbaum, in Superconduc-tivity in Complex Systems, Ed. by K. A. Müller and A. Bussmann-Holder (Springer, Berlin, 2005), Vol. 114, p. 205.
12. A. A. Romanyukha, Yu. N. Shvachko, and V. V. Ustinov, Usp. Fiz. Nauk 161 (10), 37 (1991) [Sov. Phys.—Usp.
34 (10), 862 (1991)].
13. S. A. Altshuler and B. M. Kozyrev, Electron Paramag-netic Resonance in Compounds of Transition Elements (Nauka, Moscow, 1972; Wiley, New York, 1974). 14. H. N. Dong, H. P. Du, C. K. Duan, and X. B. Luo, Int.
J. Mod. Phys. 19, 143 (2005).
15. A. A. Martin, T. Ruf, M. Cardona, S. Jandl, D. Barba, V. Nekvasil, M. Divic, and T. Wolf, Phys. Rev. B: Con-dens. Matter 59, 6528 (1999).
16. A. Rockenbauer, A. Jánossy, L. Korecz, and S. Pekker, J. Magn. Reson. 97, 540 (1994).
17. N. Guskos, M. Calamiotou, S. M. Paraskevas, A. Kou-foudakis, C. Mitros, H. Gamari-Seale, J. Kuriata, L. Sad-lowski, and M. Wabia, Phys. Status Solidi B 162, K101 (1990).
18. V. Likodimos, N. Guskos, H. Gamari-Seale, A. Kon-foudakis, M. Wabia, J. Typer, and H. Fuks, Phys. Rev. B: Condens. Matter 54, 12342 (1996).
19. P. G. Baranov, A. G. Badalyan, and I. V. Il’in, Fiz. Tverd. Tela (St. Petersburg) 37 (11), 3296 (1995) [Phys. Solid State 37 (11), 1811 (1995)].