HAL Id: hal-01806143
https://hal.archives-ouvertes.fr/hal-01806143
Submitted on 5 May 2021
HAL is a multi-disciplinary open access
archive for the deposit and dissemination of
sci-entific research documents, whether they are
pub-lished or not. The documents may come from
teaching and research institutions in France or
abroad, or from public or private research centers.
L’archive ouverte pluridisciplinaire HAL, est
destinée au dépôt et à la diffusion de documents
scientifiques de niveau recherche, publiés ou non,
émanant des établissements d’enseignement et de
recherche français ou étrangers, des laboratoires
publics ou privés.
satellite measurements
J. Sutanto, G. Hoffmann, J. Worden, R. Scheepmaker, I. Aben, T. Röckmann
To cite this version:
J. Sutanto, G. Hoffmann, J. Worden, R. Scheepmaker, I. Aben, et al.. Atmospheric processes governing
the changes in water isotopologues during ENSO events from model and satellite measurements.
Journal of Geophysical Research: Atmospheres, American Geophysical Union, 2015, 120 (13), pp.6712
- 6729. �10.1002/2015JD023228�. �hal-01806143�
Atmospheric processes governing the changes in water
isotopologues during ENSO events from model
and satellite measurements
S. J. Sutanto1,2, G. Hoffmann1,3, J. Worden4, R. A. Scheepmaker5, I. Aben5, and T. Röckmann1
1Institute for Marine and Atmosphere Research Utrecht, University of Utrecht, Utrecht, Netherlands,2Research Center for
Water Resources, Bandung, Indonesia,3Laboratoire des Sciences du Climat et de L’Environnement, LCSE-Orme,
Gif-sur-Yvette, France,4Jet Propulsion Laboratory, California Institute of Technology, Pasadena, California, USA,5SRON
Netherlands Institute for Space Research, Utrecht, Netherlands
Abstract
ENSO (El Niño–Southern Oscillation) has profound effects on the global water cycle, which can be examined at the process level by investigating the associated water isotopologues. Many isotope-based studies are aimed at understanding ENSO variability in the tropics, however, focusing principally on near-surface processes and isotopologue signals. The goal of the present study is to investigate the atmospheric processes governing the changes in the isotopic composition of water vapor both near the surface and at midtroposphere in the Pacific region during ENSO events, using a combination of remote sensing data and model simulations. For the lower atmosphere (i.e., 1000 hPa), our results show that rainout processes, less rain reevaporation of falling droplets, and increase of convective updrafts and diffusive exchange within the convective systems contribute to “the isotope amount effect” and isotopically deplete the water vapor during wet conditions, in agreement with previous studies. However, we find that the ENSO-associated isotopic signal in the midtroposphere (i.e., 500 hPa) diverges from the near-surface response. Analysis suggests that transport of enriched water vapor from lower atmospheric layers through convective updrafts controls the enrichment of midtropospheric water vapor over the Pacific Ocean. In the observations, a strong positive correlation between the increase of convective precipitation and the isotopic composition of water vapor clearly points to such a mechanism (R of 0.7–0.8 in the Central Pacific and 0.5–0.6 in the West Pacific). Model results confirm this mechanisms though producing slightly lower correlation values, with R values of 0.6 in the Central Pacific and 0.5 in the West Pacific. However, the distinction between convective and stratiform precipitation remains a result of model-dependent parameterization. Our analysis suggests that two issues should be investigated in more detail in further studies: (1) the equilibrium and disequilibrium between rain droplets and surrounding vapor for convective and stratiform precipitation and (2) different convection schemes in the different isotopic general circulation models (GCMs) describing the triggering of convection and uplift of lower layer air to higher layers. Ideally, such a comparison of different isotopic GCMs can provide us with an interesting benchmark test for the performance of the different convection schemes during ENSO and can help to disentangle the importance of the different processes contributing to the amount effect.1. Introduction
ENSO (El Niño–Southern Oscillation) is globally the largest source of interannual climate variability. It is a quasiperiodic climate oscillation between two states of the tropical Pacific characterized as La Niña (cold phase) and El Niño (warm phase). ENSO triggers a number of atmospheric teleconnection patterns [Gershunov
and Barnett, 1998; Power et al., 1999; Trenberth and Caron, 2000], which have a major impact on associated
precipitation patterns. In general, El Niño is associated with dryer than normal conditions over many tropical continental areas such as the Brazilian Nordeste or Indonesia and wetter than normal condition in the north-ern extratropics and over the Central Pacific. La Niña conditions are in particular marked by stronger than normal rainfall over the area of the West Pacific warm pool. The interactions between sea surface tempera-tures, evaporation and wind anomalies, changes in humidity gradients, and convective activity contribute to the complexity of the system [Latif et al., 1998; Trenberth et al., 1998].
RESEARCH ARTICLE
10.1002/2015JD023228
Key Points:
• The response of the water isotopologues to ENSO • The isotope amount effect
controls the water vapor at the lower atmosphere
• Convective updrafts control the enrichment of midtropospheric water vapor Correspondence to: S. J. Sutanto, S.J.Sutanto@uu.nl Citation:
Sutanto, S. J., G. Hoffmann, J. Worden, R. A. Scheepmaker, I. Aben, and T. Röckmann (2015), Atmospheric processes governing the changes in water isotopologues during ENSO events from model and satellite measurements, J. Geophys.
Res. Atmos., 120, 6712–6729,
doi:10.1002/2015JD023228.
Received 10 FEB 2015 Accepted 11 JUN 2015
Accepted article online 18 JUN 2015 Published online 14 JUL 2015
©2015. American Geophysical Union. All Rights Reserved.
In many studies, water isotope signals have been used to better understand the relation between ENSO and rainfall anomalies, since various fractionation processes such as condensation and evaporation leave a char-acteristic imprint on the isotopic composition of rainwater and the corresponding water vapor [Ichiyanagi
and Yamanaka, 2005; Vuille and Werner, 2005; Moerman et al., 2013]. Condensation and evaporation lead to an
isotopic enrichment of the liquid (solid) phase relative to the vapor phase. Thus, the isotopic composition of both water vapor and precipitation gives valuable information on the condensation history of a water vapor mass in the atmosphere. This provides us with useful information to disentangle the individual processes controlling the regional and global water cycle [Lee et al., 2012].
The isotopic composition of water is commonly expressed as the relative difference of the D/H ratio in a water sample (vapor, liquid, or solid) and the international standard material Vienna standard mean ocean water (VSMOW) using the𝛿 notation. For natural D/H abundance, this ratio is very similar to the HDO/H2O ratio and we use the following definition for the𝛿 value:
𝛿 = ( R sample Rstandard(VSMOW) − 1 ) (1) where R = HDO/H2O = 311.52 × 10⁻⁶for the VSMOW standard [Craig, 1961].
Most water isotopologue studies in the tropics, analyzing seasonal or spatial water isotopologue signals, demonstrate a negative correlation between the𝛿 value of precipitation and local rainfall, which is called the amount effect [Dansgaard, 1964]. The uses of this modern analogue is to reconstruct local and regional rainfall in the past on timescales from decades to thousands of years based on water isotopologue records, preserved in different geological archives such as ice core, tree ring cellulose, or calcium carbonate of speleothems [Becker et al., 1991; Jouzel et al., 1997; Vimeux et al., 2005; Jo et al., 2014; Lee et al., 2012]. Recently, some stud-ies have been carried out to understand in more detail the individual processes contributing to the amount effect. Most of these studies either use atmospheric general circulation models (AGCMs) equipped with water isotope modules [Lee and Fung, 2007; Risi et al., 2008] and cloud-resolving models [Moore et al., 2014], or in a combination with more classical records measuring the water isotopologues in the meteoric water (for exam-ple, the Global Network of Isotopes in Precipitation (GNIP) [Conroy et al., 2013; Moerman et al., 2013; Lekshmy
et al., 2014]). Only few studies use water isotopologue signals from satellite measurements to analyze
atmo-spheric processes affecting the isotope amount effect [Worden et al., 2007; Brown et al., 2008; Risi et al., 2010]. In the tropics, such studies principally focused on the analysis of the various monsoon systems or short-term variability as the Madden-Julian Oscillation [Hoffmann and Heimann, 1997; Vuille and Werner, 2005; Landais
et al., 2010; Risi et al., 2010; Kurita et al., 2011; Lee et al., 2012].
This study is the first study that investigates ENSO variability in the lower and middle troposphere using water isotopologue measurements from the satellites. We use data sets from two different satellite instru-ments, the Tropospheric Emission Spectrometer (TES) and Scanning Imaging Absorption Spectrometer for Atmospheric Chartography (SCIAMACHY), and data of isotopes in precipitation from the Global Network of Isotopes in Precipitation, the International Atomic Energy Agency (GNIP-IAEA). We compare these observa-tions with simulaobserva-tions of the European Centre/Hamburg (ECHAM4) AGCM fitted with a water isotope module (ECHAM4-ISO). We concentrate on the core region of ENSO variability, the tropical Pacific, analyzing changes of the isotopic composition of water vapor in the lower and middle troposphere and relate these changes to atmospheric ENSO dynamics and cloud physics. In section 2 we give some technical information on the various remote sensing data sets. Furthermore, we introduce the ECHAM4 model and explain how the water isotopes are embedded into the physics of the model. In section 3 we compare the strength of ENSO with the water isotopologue signals and report a characteristic near-surface contrast between the West and Central Pacific and an inverse pattern at higher altitudes. We summarize and discuss the possible mechanisms lead-ing to this pattern in detail in section 4. Section 5 concludes all the findlead-ings and shares some perspectives for further study.
2. Data and Instruments
The atmospheric data sets used here stem from two satellite-based remote sensing systems, TES [Worden
et al., 2006, 2012] and SCIAMACHY [Frankenberg et al., 2009; Scheepmaker et al., 2013]. They provide us with
both atmospheric water vapor mixing ratios and the corresponding Deuterium content (i.e., the𝛿D value). The𝛿D values in precipitation are taken from the IAEA/GNIP global network, which has sampled rainwater and
measured its isotopic composition on a monthly basis for more that 50 years [Aggarwal et al., 2007; Rozanski
et al., 1993; Schotterer et al., 1996]. Furthermore, we use two different precipitation data sets, the ERA-Interim
reanalysis from the European Centre for Medium-Range Weather Forecasts (ECMWF) [Betts and Jakob, 2002;
Bechtold et al., 2004; Dee et al., 2011] and the satellite product Tropical Rainfall Measuring Mission (TRMM) [see Schumacher and Houze, 2003; Schumacher et al., 2004; Huffman et al., 2007]. The former is a blended product of
observations assimilated into model simulations to obtain a physically consistent data set. These observations are compared with simulations of the ECHAM4 global circulation model. In order to mimic as closely as pos-sible the climatological situation (Niño/Niña, Arctic Oscillation, etc.) and typical associated weather patterns, the model was nudged with the observed wind fields.
In the following we describe the different data sets and model simulations and used analytical techniques in more detail.
2.1. HDO/H2O Satellite Measurements
Two different instruments, TES and SCIAMACHY, both installed on satellites and active over slightly different periods starting in the 2000s, measured𝛿D data used in this study. TES aboard the Aura satellite is an infrared Fourier transform spectrometer that measures the spectral infrared (IR) radiances between 650 cm−1and 3050 cm−1in both a limb-viewing and a nadir mode. HDO and H
2O profiles are obtained from TES thermal radi-ances between 1200 cm−1and 1350 cm−1(7400 to 8300 nm in wavelength). The corresponding resolution of the captured IR radiance is 5.3 km by 8.4 km in the nadir-viewing mode. This study uses the recent TES version 5 data set, which has comparably high sensitivity in a wide altitude range 925 hPa to 350 hPa [Worden et al., 2012]. The data set is available with a vertical resolution of 17 layers. The following filtering procedures have been applied to the TES data: degree of freedom signal> 0.5 and species retrieval quality = 1. We also applied a cloud filter for cloud optical depth< 0.4 to the data and found similar results to the unfiltered database. A bias correction in the TES HDO vapor data due to the uncertainties in the spectroscopic line strengths is already applied to TES version 5 data sets according to Worden et al. [2012]. We did not apply any additional bias correction following Herman et al. [2014]. All analyses are based on monthly TES data from 2004 to 2011. SCIAMACHY is a passive remote sensing spectrometer aboard the European Space Agency environmental research satellite, Envisat. In contrast to TES, it measures total column atmospheric HDO/H2O, with high sen-sitivity from the ground up to 10 km. SCIAMACHY has a relatively high (0.2 nm to 0.5 nm) spectral resolution and covers a wide spectral range from the UV to in the near infrared (240 nm to 1700 nm and in selected areas between 2000 nm and 2400 nm). HDO data were retrieved using the wavelength window ranging from 2355 to 2375 nm. The footprint resolution is 120 km by 30 km. HDO data used in this study cover the temporal period from 2003 to 2007. More detailed information about the retrieval and the quality control procedures can be found in Frankenberg et al. [2009] and Scheepmaker et al. [2015].
2.2. The ECHAM4 Model
The ECHAM4 AGCM was developed at the Max-Planck Institute for Meteorology in Hamburg. It is an atmo-spheric general circulation model [Roeckner et al., 1996], which was used within the Coupled Model Inter-comparison Project 4 [Covey et al., 2003] model interInter-comparison study. Similar to the ECMWF forecast model, from which the ECHAM model was developed, it uses the spectral transform method for the “dry dynam-ics” (i.e., wind and temperature) but uses a semi-Lagrangian transport scheme for humidity and tracers such as the water isotopes [Williamson and Rasch, 1994]. The land surface scheme is based on a simple “bucket scheme” balancing the fluxes of heat and moisture over continental surfaces. Vegetation coverage and its influence on evapotranspiration and runoff in dependence of the soil’s water-holding capacity are parameter-ized in a highly idealparameter-ized way. The model’s cloud scheme distinguishes between stratiform clouds typical for the extensive cloud bands of the extratropics and a convective cloud scheme dominating in tropical regions [Tiedtke, 1989]. A water isotope module was added to the AGCM’s model physics and tracks the different water isotopologues (H18
2 O, HDO, etc.) in each part of the AGCMs hydrology [Hoffmann et al., 1998]. Each phase change is associated with temperature- and humidity-dependent isotopic fractionation processes, which are well known from laboratory experiments. The water isotope module allows therefore comput-ing the full four-dimensional distribution of the water isotopologues in all simulated water reservoirs of the ECHAM model.
The version of ECHAM4 used here was run in T42 spectral resolution and has 19 vertical hybrid layers extend-ing from the surface to 10 hPa. The spatial resolution of the physical processes corresponds to a horizontal resolution of 2.8∘ by 2.8∘. This study aims at analyzing the hydrological cycle and the corresponding water
isotopologues signals over specific climatological intervals such as El Niño/La Niña episodes. Therefore, the ECHAM4 model was “nudged” by a spectral nudging technique [von Storch et al., 2000] specifically developed for the “spectral” ECHAM model. This procedure guarantees a good representation of past atmospheric condi-tions since the simulated wind fields are forced to be close to the ERA40 reanalysis data. It has been shown that this approach considerably improves both monthly precipitation and its isotopic composition, compared to monthly climatological means. The ECHAM4 model was nudged over the period 1971–2001. Detailed infor-mation about ECHAM4 can be found in Hoffmann et al. [1998] and in Sutanto et al. [2015] for model and satellite comparison. In this study, we use the model outputs without applying collocation and convolution methods with the TES data sets and interpolate the ECHAM model vertical resolution into TES vertical resolution. We also note that the different climatological periods are used in the analyses; e.g., we use TES data from 2004 to 2011, SCIAMACHY data from 2003 to 2007, and ECHAM data from 1971 to 2001 (see Sutanto et al. [2015] for further discussion).
2.3. Precipitation Data
Two independent data sets of precipitation, The ERA-Interim reanalysis data of the ECMWF and the TRMM radar data set, are used. The ERA-Interim reanalysis model is designed to assimilate a huge amount of obser-vational data (nearly 107data per day both from surface observations and satellite measurements [Dee et al., 2011]) into the atmospheric model. Nevertheless, rainfall in the tropics is a known weakness of all reanaly-sis products [Uppala et al., 2005; Dee et al., 2011] because of the difficulties in the assimilation of humidity information and poor representation of the global transport of moisture in the atmosphere.
Furthermore, observed precipitation data are obtained from the TRMM (Tropical Rainfall Measuring Mission) satellite measurements. The TRMM satellite operates at an altitude of 350 km with a swath width of 215 km and a horizontal footprint of 4.3 km at nadir-viewing mode. The orbital domain of the TRMM satellite extends from 35∘N to 35∘S. The TRMM precipitation radar operates in the Kuband (2.17 cm wavelength) with a sensitivity of 17 dBZ, corresponding to a precipitation rate of approximately 0.4 mm h−1and vertical resolution of 250 m [Schumacher and Houze, 2003; Schumacher et al., 2004]. The precipitation radar also classifies the precipitation into convective and stratiform precipitation elements in the TRMM product. Detailed information about the TRMM satellite can be found in Kummerow et al. [1998]. Convective precipitation data from both ERA-Interim and TRMM in the years 2004–2011 are used in our study in order to compare it with TES measurements. The isotopic composition of precipitation is obtained from IAEA. In cooperation with the World Meteorolog-ical Organization, IAEA has run the Global Network of Isotopes in Precipitation (GNIP) since 1961. Monthly precipitation samples have been collected from over 1000 meteorological stations in more than 125 countries for𝛿D and 𝛿18O analysis (selected stations also sample for Tritium). For this study, we selected the stations in the Central Pacific and West Pacific, which at least have one complete year of isotope observation during an ENSO event. Those stations are Canton Island, Manila, Diliman Quezon, Bonga, and Inang Maharang. 2.4. The Niño-3 Index
The Niño-3 index is an average of the sea surface temperature (SST) anomalies in the region of 90∘W–150∘W and 5∘N–5∘S. When the index is positive (El Niño conditions), water is warmer than normal, and when the index is negative, water is cooler than normal (La Niña conditions). In 1996, the Climate Prediction Center of NOAA introduced an alternative Niño-3.4 index, with focus area over the center of the Pacific Ocean (120∘W–170∘W, 5∘N–5∘S). The Niño-3.4 region has higher mean temperature than Niño-3 and is closer to the Western Pacific warm pool (WPWP) region, the center of convection [Trenberth, 1997]. The general results shown below are not sensitive to the choice of ENSO index, and the differences between Niño-3 and Niño-3.4 are small.
3. Results
3.1. Correlation of the Niño-3 Index With Global𝜹Dv
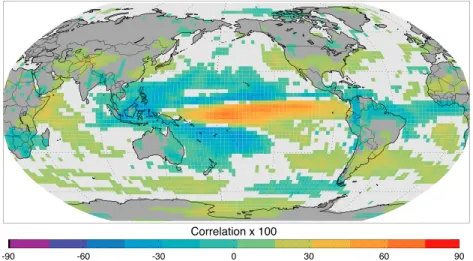
In a first step, we tested whether the ECHAM model shows a realistic response of its global water cycle to ENSO variability. We computed the pointwise correlation between ENSO (the Niño-3 index) and precipita-tion (Figure 1). The correlaprecipita-tion was calculated with a low significance level of 10% using Student’s t test. The blank spots in Figure 1 are the correlations that did not pass the Student’s t test analysis. The model repro-duces features such as the drier conditions over Indonesia, Northern Australia, and the Brazilian Noreste. Wetter than normal conditions are simulated in particular over the Central Pacific and on the Californian coast, in good agreement with known ENSO-associated precipitation anomalies [Ropelewski and Halpert, 1987].
Figure 1. Correlation of the Niño-3 index and precipitation amount at each grid point from ECHAM.
Without going into details of the quality of the simulated relation between the water cycle and ENSO, we conclude that the model’s large-scale response to ENSO is sufficiently realistic to warrant an investigation of the water isotopologue signals. In particular, the weakening of the West Pacific branch of the Hadley-Walker circulation and the strengthening of convective activity over the Central Pacific during El Niño events are robust features, which are found also in observations [Curtis and Adler, 2000; Dai and Wigley, 2000].
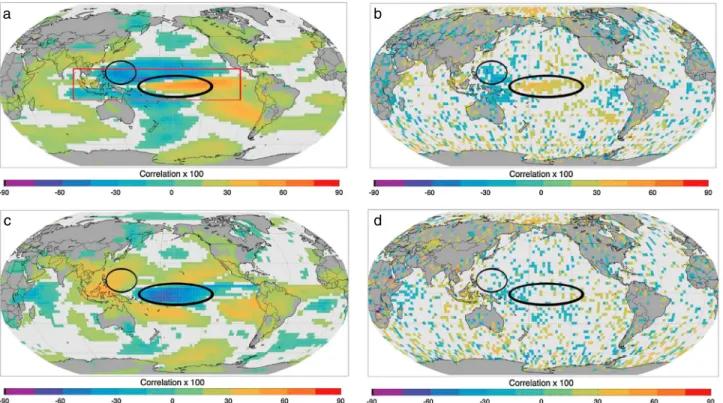
To detect a possible correlation between ENSO and the isotopic composition of water vapor, either in the satellite data or in the ECHAM4 simulations, we computed for each grid point a temporal correlation of the Niño-3 index (corresponding to the temperature anomaly over a large area in the tropical Central Pacific) and𝛿D of the local water vapor. The geographical distribution of the correlations is shown in Figure 2. In the ECHAM4 simulations, there is a clear correlation/anticorrelation pattern spread over the entire Central Pacific both in near-surface layers and in the middle troposphere. At 500 hPa, this pattern is confirmed by the TES satellite data, although the signal is noisier. At 1000 hPa, TES cannot produce the correlation pattern due to its low sensitivity close to the surface. We also performed the correlation analysis using TES data at 850 hPa and found similar results. Most interestingly, the model shows that the correlation pattern at the surface is inverted compared to the 500 hPa levels. Regions, which show a positive (negative) correlation at the surface between Niño-3 and𝛿D, appear to be anticorrelated (correlated) at higher altitudes.
The near-surface pattern is in line with what we may expect from the amount effect in the tropics, which shows an anticorrelation between the precipitation amount and the isotopic composition of the rainfall. This anticor-relation was empirically demonstrated in several studies both on the spatial scale and on a seasonal timescale, analyzing GNIP/IAEA data [Dansgaard, 1964; Rozanski et al., 1993; Araguás-Araguás et al., 1998]. During an El Niño event, convection and rainfall intensity are weaker over the Western Pacific warm pool (WPWP) and stronger over large parts of the warmer than normal surfaces of the central tropical ocean [Ropelewski and
Halpert, 1987; Curtis and Adler, 2000; Dai and Wigley, 2000]. This leading impact of ENSO variability on
precipi-tation amount is also reproduced by the ECHAM4 model (see Figure 1). Therefore, the near-surface correlation pattern (Figure 2c) is what we would expect from the amount effect: over the western Pacific warm pool pre-cipitation is reduced during an El Niño event, and water vapor at near-surface layers is therefore more enriched than normal. Conversely, over the Central Pacific, the increase in precipitation leads to lower𝛿D values there. In the midtroposphere (500 hPa), however, an opposite correlation pattern is found in the ECHAM4 model. This pattern is convincingly supported by the TES observations, which are more sensitive to free troposphere water vapor than to water vapor close to the surface. At this level, water vapor is isotopically more depleted than normal over the WPWP area during an El Niño event (negative correlation) and more enriched than normal over the Central Pacific (positive correlation).
Figure 3 shows a longitudinal cross section of the correlation/anticorrelation pattern over the region of inter-est (90∘E–90∘W and 15∘N–15∘S; see red box in Figure 2a), allowing a more quantitative comparison between model results and observations. Though such a comparison is difficult at lower atmospheric layers since the sensitivity of the TES data is strongly reduced, there is a good correspondence between model and
Figure 2. Correlation of the Niño-3 index and𝛿Dvat each grid point from (a) ECHAM at 500 hPa, (b) TES at 500 hPa, (c) ECHAM at 1000 hPa, and (d) TES at 1000 hPa. Red box is the averaging location for the zonal plot in Figure 3.
observations both close to the surface and at the 500 hPa level. Averaged over a tropical band from 15∘S to 15∘N, we find positive correlations between ENSO and the water isotopologues from 90∘E until 150∘E in near-surface layers. From 150∘E to about 120∘W there are negative correlations. At 500 hPa, negative cor-relation dominates in the Western Pacific (100∘E to about 180∘E) and the corcor-relation changes sign near the dateline to positive correlations (180∘W to 90∘W) in the Eastern Pacific, in the model results and in the obser-vations. It should be noted that this pattern does not show up in the earlier TES version 4 data, confirming former results that indicate a clear improvement of the water isotope product of the TES version 5 data set [Sutanto et al., 2015].
3.2. Correlation of the Niño-3 Index and𝜹Dvin Central Pacific and West Pacific
For a more detailed analysis of the identified ENSO-related isotope anomalies and the mechanisms control-ling them, we focus in the following on two locations that are strongly affected by ENSO, the West Pacific warm pool (130∘E–145∘E and 7.5∘N–7.5∘S) and the Central Pacific (180∘W–165∘W, and 1∘N–5∘S). These two
Figure 3. Zonal plot of correlation between the Niño-3 index and𝛿Dvfrom 90∘E to 90∘W from ECHAM and TES at (a) 1000 hPa and at (b) 500 hPa. The values are averaged from 15∘N to 15∘S. Red and grey shade areas are uncertainty ranges calculated as 1 sigma standard deviations of the averaged points.
Figure 4. Correlation of the Niño-3 index and𝛿Dvat 500 hPa (a) in the Central Pacific and (b) in the West Pacific and at 1000 hPa (c) in the Central Pacific and (d) in the West Pacific as simulated by the ECHAM model. Blue lines correspond to La Niña, red lines correspond to El Niño, yellow lines correspond to normal conditions, and black lines correspond to the complete data set. The correlation coefficients in the figure are for the overall correlation (black lines).
regions are situated in the centers of the above described correlation/anticorrelation patterns and correspond also to the two different climatic regimes during an El Niño event, i.e., a dryer than normal Western Pacific and a wetter than normal Central Pacific.
Figure 4 shows 30 years (1971 to 2001) of modeled monthly anomalies of the Niño-3 index versus𝛿Dv(both at the surface and at 500 hPa) averaged over the two regions described above. We separated the anomalies in three climatic regimes, i.e., normal conditions, El Niño conditions, and La Niña conditions. “Normal” here is defined as a range of the Niño-3 index values between −0.5 and +0.5 (orange); El Niño events correspond to the Niño-3 index values above 0.5 (red) and La Niña events to the Niño-3 index values below −0.5 (blue). Close to the surface, there is no clear distinction in𝛿Dvbetween the “La Niña” and the normal regime (blue and orange points), both in the Western and the Central Pacific. Also, the spread of the corresponding𝛿Dv values is about the same. The correlation/anticorrelation pattern at the surface is mostly driven by the El Niño events. In the Central Pacific, the𝛿Dvvalues also show a much larger variability during the El Niño period. As expected from Figures 2 and 3 there is a negative (anticorrelation) correlation in the Central Pacific (R = −0.58) and a positive correlation in the Western Pacific (R = 0.36) (Figures 4c and 4d).
At high altitudes (500 hPa, see Figures 4a and 4b), the correlation is noisier than the respective relation close to the surface and it is not driven principally by the El Niño events in the simulated 30 year record, as it was the case for lower layers. In the Central Pacific at 500 hPa, for instance, the relation between the water isotopo-logues and the Niño-3 index during El Niño events is completely flat (red curve in Figure 4a). Therefore, not only one has to explain inverse relationships between the water isotopologues and the ENSO affected inten-sity of convection, circulation, and rainfall at lower and higher levels but also a certain asymmetry between La Niña/El Niño events and their respective impact on the water isotopologues.
3.3. Evaporation and Condensation
The anomalously warm and cold SST during El Nino and La Nina for long periods in the tropical pacific affect the isotopic composition of water vapor. The phase changes during evaporation and condensation are linked
Figure 5.𝛿Dvas a function of specific humidity (q) from the ECHAM model in the (a) Central Pacific and in the (b) West Pacific;𝛿Dvas a function of specific humidity (q) from observations in the (c) Central Pacific and in the (d) West Pacific. The black lines correspond to a Rayleigh fractionation model, and the orange lines correspond to a mixing
evaporation model.
to isotope fractionation processes, and the resulting isotopic composition of water in an air mass therefore contains information about its “fractionation history,” marked by one or several cycles of evaporation, trans-port, condensation, reevaporation, etc. A Rayleigh distillation diagram (such as in Figure 5) can be used to characterize an air mass by its specific humidity, q, and its water isotopic composition. Following Worden et al. [2007] and Noone [2012], we specify here two extreme cases of air mass histories. The black solid line describes the𝛿Dv-q composition of an air mass that undergoes a Rayleigh distillation. Starting from isotopic equilibrium with the ocean water (𝛿D = −79‰), an air mass is cooled down and all forming condensate is immediately removed. This rainout leads to a strong isotopic depletion of the remaining air mass (black curve in Figure 5). A mixing evaporation line (orange curve) is defined by mixing the evaporative flux and its comparably enriched water isotopic composition with a dry depleted air mass originating at higher altitudes [Worden et al., 2007;
Brown et al., 2008; Lee et al., 2011].
When plotting the near-surface and high-altitude measurements and model results in such a diagram (𝛿Dv versus q), a number of interesting features with regard to ENSO variability can be identified.
1. Under normal (orange symbols) and La Niña conditions (dry, blue symbols), surface evaporation predom-inates at the Central Pacific and, consequently, the model results (Figure 5a, at 1000 hPa) indicate that the water vapor is close to isotopic equilibrium with the ocean water, which means that the surface water reser-voir originates nearly entirely from ocean evaporation. During El Niño events, the isotopic composition of water vapor at the Central Pacific is lower than normal since it is under a stronger influence of moisture convergence [Lee et al., 2007; Moore et al., 2014] and convective rain (red dots in Figure 5a) [Risi et al., 2008;
Kurita, 2013; Lekshmy et al., 2014]. The convergence vapor imported from the subtropics, with lower𝛿D
values, lowers the isotopic composition of water vapor in the tropics. This pathway becomes more impor-tant as convection strengthens [Kurita, 2013; Moore et al., 2014]. In addition, the vapor affected by isotopic fractionation processes associated with convection and accompanying condensation processes may affect the boundary layer vapor via the falling raindrops. Reevaporation of falling raindrops and isotopic equi-libration of the droplets below the cloud base with the surrounding water vapor leads to a clear shift of
the isotopic composition of the near-surface vapor toward the condensation line. Thus, the vapor close to the surface is influenced by the water convergence and by the condensation process from higher alti-tudes through equilibration of rain droplets with surrounding vapor in a wetter condition and not by the local condensation.
2. The West Pacific warm pool is marked by less variability (small range of humidity variations), which is proba-bly due to the smaller SST variations (Figure 5b). The region is also wetter than the Central Pacific both close to the surface and in the middle troposphere. In the West Pacific region, El Niño states are representative of dryer than normal/La Niña conditions. Consequently, the vapor is closer to isotopic equilibrium with the ocean during El Niño conditions and more influenced by condensation via the isotopic exchange of falling rain droplets with surrounding vapor during the wetter La Niña conditions.
3. At 500 hPa, the model results indicate, in general, wetter air and isotopically more enriched water vapor in the West Pacific than in the Central Pacific (Figures 5a and 5b). This is also clearly confirmed by the TES observations indicating specific humidity between 3 and 5 g/kg in the West Pacific and between 1 and 3 g/kg in the Central Pacific (Figures 5c and 5d). Also, the vapor is about 50‰ more enriched in the West Pacific. Both features corroborate the idea that the midtroposphere over the WPWP is closely connected to surface humidity both in terms of the actual specific humidity values and the stronger enrichment of the vapor. This property is probably due to a more intense and regular convective activity over the WPWP region.
4. Central Pacific TES data are constrained by the pure Rayleigh distillation. On the contrary, high-altitude data over the WPWP are generally more moist and enriched than the Central Pacific data. The intense con-vection over the WPWP is probably responsible for this feature. There are a number of possible processes suggested to explain “non- Rayleigh distillation”𝛿Dv-q values at high altitudes. Most of them are associated with convective activity such as intense condensation during the ascent of the air parcels which lower𝛿D [Risi et al., 2008], uplift and evaporation of ice crystals, and/or detrainment/entrainment of air within con-vective towers, which moisten and enrich𝛿D [Smith et al., 2006; Moyer et al., 1996]. The ECHAM model does not reproduce this non-Rayleigh distillation influence as it is seen in the TES data where the isotopic com-position of water vapor is relatively more depleted than the Rayleigh distillation curve. The simulated vapor data from the model are largely situated in between the mixing evaporation/condensation lines for both the Central Pacific and over the WPWP. The deviations from the Rayleigh-like behavior can arise from mix-ing between different air masses, detrainment of condensate, or from rainfall evaporation [Risi et al., 2012]. These processes may not be simulated well in the ECHAM model and lead to the𝛿D bias at high altitudes. The possible role of convection will be discussed in more detail in section 3.5.
Though simulated WPWP high-altitude data from ECHAM are not in good agreement with TES data when comparing absolute values of q and𝛿Dv, the simulated isotopic response to ENSO variability in both regions, WPWP and Central Pacific, corresponds quite well to the TES observations. Water vapor over the Central Pacific is shifted from dryer and more depleted values during La Niña to wetter and more enriched values during El Niño with neutral ENSO conditions being situated in between (Figure 5c). Over the WPWP, Figure 5d shows nearly the contrary. El Niño events appear more depleted, though only slightly wetter. Model results and TES observations agree in this isotopic reaction to ENSO. For humidity, however, the model results and TES dis-agree, with more humid condition from the model and drier condition from the observation during La Niña. Interestingly, over the Central Pacific, ENSO provokes a clear response of the specific humidity q and𝛿Dv, whereas over the WPWP, we mainly identify a reaction of the isotopic composition of𝛿Dvand virtually only small changes in q. The reason is that the WPWP is a well-known area with persistent convection and the ENSO only increases/reduces the convective activities during La Niña/El Niño. In general, there is a specific ENSO pattern at high altitudes which is not trivial to explain in terms of known isotope effects (e.g., amount effect as described by an inverse relation with the amount of precipitation) and whose signature might serve in the future to evaluate simulated ENSO responses of the water cycle.
Figures 5c and 5d show also SCIAMACHY total column data. Unfortunately, the SCIAMACHY data do not appear to be very realistic. For total column data the𝛿Dvand q are much too depleted and much too dry, respectively. This is caused by the fact that SCIAMACHY only measures HDO and H2O above low-level clouds over the ocean (since the ocean surface itself is too dark in the short-wave infrared). Also, during SCIAMACHY measurements from years 2003 to 2007 there was no strong ENSO event, neither El Niño nor La Niña. This probably also contributes to the difficulty to distinguish any clear ENSO-associated pattern in the SCIAMACHY data. Note, we could not produce the ENSO signature similar to the Figure 2.
Figure 6. Monthly plot of𝛿Dpfrom ECHAM and𝛿Dpequilibrium differences in (a) Central Pacific and (b) West Pacific at 1000 hPa. We added 50‰ to𝛿Dvto improve readability.
3.4. Isotope Amount Effect
Above, we formulated the hypothesis that near-surface layers are “isotopically” under the influence of reevap-oration and of reequilibration with falling raindrops. The first flux is a net flux from the raindrops into the surrounding atmosphere. The second process is the result of gross fluxes after rain evaporation, which could affect the planetary boundary layer (PBL) isotopically. Both processes possibly contribute to the amount effect-like response of the water isotopologues in near-surface vapor to ENSO variability. Wetter (dryer) conditions lead to more (less) depleted water vapor. We note that these processes (reevaporation and reequi-libration) were already mentioned in the first publication on interpreting water isotopic signals as possible processes contributing to the amount effect in rainwater [Dansgaard, 1964]. More (less) rainfall, so goes the argument, humidifies the boundary layer and leads to less (more) reevaporation and therefore less fraction-ation, which would then deplete (enrich) the corresponding rainfall. The rain reevaporation and diffusive exchange between rain and vapor explain why the boundary layer water vapor reacts in the same way as pre-cipitation [Lee and Fung, 2007; Risi et al., 2008; Tremoy et al., 2014]. Formulated this way, the mechanism served to explain the amount effect in tropical/subtropical precipitation and water vapor.
To check the relevance of the proposed isotopic exchange processes between rainfall and boundary layer water vapor, we studied the time evolution (1971–2001) of both the water isotopic composition of vapor and corresponding precipitation for our two target regions in the model (Figure 6). Unfortunately, only model results are available to do such an analysis. A sufficiently dense network of rain sampling stations combined with isotopic analysis (such as GNIP) [Aggarwal et al., 2007] does not exist in the tropical Pacific.
We compare the Niño-3 index with the isotopic composition of near-surface water vapor and the corre-sponding disequilibrium between precipitation and the respective vapor in the model. In perfect equilibrium between rain and vapor the following relation holds [Gat, 1996]:
Rp=𝛼 ⋅ Rv (2)
with Rpand Rvbeing the isotopologue ratio HDO/H2O for rain and vapor, respectively, and𝛼 is the equilibrium fractionation factor, which is only controlled by temperature [Majoube, 1971]. Consequently, we define the isotopic disequilibrium as follows:
𝛿Ddis=𝛿Dp− ( 𝛼 ⋅ 𝛿Dv+𝜀 ) (3) with𝜀 = (𝛼 − 1) ⋅ 1000.
In perfect equilibrium the difference Rp−𝛼⋅Rvis zero, thus indicating that the liquid and the vapor had enough time to reach an isotopic equilibrium that is only controlled by the surrounding air temperature. Temperature is supposed to be constant during the time of the isotopic exchange processes. Obviously, this will hardly be the case for falling raindrops. Equilibrium then depends on, among other factors, the respective droplet size, fall velocity and the surrounding relative humidity [Stewart, 1975].
Figure 6a (Central Pacific) shows strong negative excursions of𝛿Dvthat systematically coincide with El Niño events. However, most of the smaller-scale variability of𝛿Dvdoes not seem to be influenced by ENSO. Many processes may influence𝛿Dvduring normal condition such as mixing, moisture convergence, rain evapora-tion, and surface evaporation. The control of ENSO on𝛿Dv is mainly taking place during the three to five major Niño events (1972, 1982, 1987,1992, and 1997). The water isotopologues respond to rising tropical SSTs (Niño-3 index). However, a different intensity of the Niño event (at least based on the Niño-3 index used here) does not provoke similarly different excursions of the water isotopologue. The response of𝛿Dvis not linear, and this holds both for the variations between El Niño and La Niña events and even between the different El Niño events.
In both regions, the mean value of the isotopic disequilibrium is negative, implying incomplete equilibration with the surrounding boundary layer water vapor. This is to be expected, since the model’s parameteriza-tion only allows partial equilibraparameteriza-tion of falling raindrops (nearly complete equilibraparameteriza-tion for small droplets, i.e., formed in stratiform precipitation and only ∼50% equilibration for big droplets, i.e., formed in convective sys-tems). We note that this model result is in agreement with other model-based studies [Lee and Fung, 2007;
Risi et al., 2008].
In the Central Pacific, major El Niño events are associated with strong negative excursions of the isotopic disequilibrium (blue line, Figure 6a). Together with the negative excursions of the PBL water vapor (green line, Figure 6a), this leads us to the following scenario:
1. When raindrops fall into a wet boundary layer, there is less isotopic exchange between the raindrops and the surrounding vapor, keeping the raindrops out of equilibrium with the vapor. The raindrops pass the PBL without being effectively enriched by fractionating reevaporation since relative humidity increases consid-erably under El Niño conditions. In addition, the falling rain droplets transfer depleted cloud conditions to the PBL.
2. Furthermore, as we will show in more detail in section 3.5, there is a shift of precipitation from stratiform cloud systems to convectively formed precipitation when changing from neutral or La Niña conditions to El Niño conditions. This is shown in Figure 5a where the humidity increases during El Niño events both near-surface and at higher altitudes. Convectively formed precipitation is typically composed of larger and therefore faster falling raindrops. In the ECHAM model it is parameterized as only partly (i.e., 50%) reaching full isotopic equilibrium. Thus, the predominance of convective precipitation leads to less equilibration with the surrounding layer.
In summary, both mechanisms, i.e., a more humid atmosphere suppressing fractionating reevaporation and a shift to more dominating convective precipitation, lead to less isotopic equilibration of the simulated rainfall. In contrast to the Central Pacific, the West Pacific warm pool region shows a slightly different pattern. The
𝛿Dp−eq values are always negative, meaning that there the precipitation is never in isotopic equilibrium with the surrounding vapor. This is in agreement with our reasoning above. Over the WPWP, precipitation is clearly dominated by convective processes and thus out of equilibrium with the vapor, which leads to more depleted rain relative to the PBL vapor. During El Niño events this disequilibrium is slightly reduced (blue curve, Figure 6b). The arguments presented above regarding the relation between wetter than normal con-ditions and more convectively formed precipitation in the Central Pacific apply to the WPWP, but with an opposite sign. One reason for the relatively weak signal in the disequilibrium time series during El Niño events might be that the shift toward less convectively formed precipitation (leading to potentially more isotopic equilibration) is less clear in this region.
One should keep in mind that the respective isotope exchange and raindrop evaporation processes discussed above are the result of a model simulation. The respective processes are highly parameterized and idealized and the choice of the involved parameters is hardly constrained by direct observations.
3.5. Convective Updrafts
In section 3.4 we have argued that changes from stratiform to convective precipitation could contribute to the simulated variability of the isotopic disequilibrium between rainfall and water vapor. Already in several former studies [Gedzelman and Arnold, 1994; Kurita et al., 2011] it was shown that convective precipitation produces higher𝛿Dpthan stratiform precipitation. In addition, Kurita et al. [2011] showed that convection would increase𝛿D of water vapor at altitudes above 600 hPa. Following the hypothesis from the former stud-ies that the convection will produce higher𝛿D in precipitation and vapor at higher altitudes, we analyzed and
Figure 7. Relationship of𝛿Dvat 500 hPa and the amount of convective precipitation from ECHAM in the Central Pacific ((a) averaged from 165∘W to 150∘W and 5∘N to 5∘S) and in the West Pacific ((b) averaged from 110∘E to 135∘E and 10∘N to 10∘S); TES𝛿Dvat 500 hPa and the amount of convective precipitation from ECMWF and TRMM in the (c) Central Pacific and in the (d) West Pacific.
compared the simulated shifts of convective precipitation with𝛿D at 500 hPa. Again we should keep in mind that such a clear distinction between stratiform and convective precipitation is a result of climate model design, which does not exist in nature.
Figures 7a and 7b demonstrate the influence of convection on𝛿Dvat 500 hPa in the two regions from the model. Over the Central Pacific the correlation of convection intensity and the water isotopologues is high (R = 0.64, Figure 7a), whereas over the WPWP it is weaker (R = 0.47, Figure 7b). More (less) convection is associated with less (more) depleted water vapor. Though the time series of both precipitation and the water isotopologues are dominated by the seasonal passage of the Intertropical Convergence Zone over the regions of study, many intraseasonal variations are also in apparent synchronization.
A possible explanation for this simulated feature involves the uplift of marine boundary layer vapor. In the tropics, convection picks up vapor at lower altitudes, even from the marine boundary layer and lifts it up to typically heights of 10–12 km. In the subsaturated regions outside the updrafts, the convective tower release vapor with𝛿D characteristics similar to near-surface layers, leading to an efficient enrichment process of the midtroposphere [Smith et al., 2006].
Since the distinction between stratiform and convective precipitation partly depends on model design and parameterization, the corresponding comparison between convective precipitation and the water iso-topologues using observations is difficult. In Figures 7c and 7d two different observational data sets of precipitation are shown together with the TES𝛿Dv data centered at 500 hPa. Obviously, there is a good correspondence between convective precipitation and𝛿Dvabove the Central Pacific, and the correlation is weaker over the WPWP. Not only the seasonal cycle but also second-order variations of convective precip-itation and𝛿Dv covary, leading to a correlation of R = 0.83 and 0.72 in the Central Pacific and R = 0.58 and 0.47 over the WPWP using ECMWF and TRMM, respectively. Note that TES cannot retrieve𝛿Dv in the presence of deep convection (e.g., no measurements during high precipitation year 2010). Also, tropical pre-cipitation is a persistent problem for models. The ERA-Interim reanalysis data are obtained by assimilating
observational data (not only surface observations but also radiosonde and satellite data) into the weather forecast models of the ECMWF. The distinction between convective and stratiform precipitation remains a result of model-dependent parameterization also in the case of the reanalysis data.
We also calculated the correlation between stratiform precipitation and𝛿Dvabove the Central Pacific and the West Pacific (figure not shown). Although, there is also a correlation between stratiform precipitation and𝛿Dv, the correlation values (R) from all data sets, in general, are weaker than for convective precipitation. More-over, convective precipitation has a higher contribution to the total precipitation amount than stratiform precipitation, and this is also applicable for ENSO case.
4. Summary and Discussion
We have investigated the impact of ENSO on the tropical water cycle and the corresponding water iso-topologue signatures. To that end, satellite data and model results have been used providing simultaneous information on both the atmospheric vapor and its isotopic composition. Within the tropics, two key regions were identified where𝛿Dvreacts particularly sensitive to ENSO and systematically with opposite signs: the Central Pacific and the region of the West Pacific Warm Pool. Figure 8 summarizes these findings compar-ing the water isotopologue signals near the surface and in the middle atmosphere durcompar-ing ENSO neutral, El Niño, and La Niña conditions. Figures 8a and 8b show two different sets of observational data (remote sens-ing data and GNIP surface observations), and model results over our two study regions. The regional mean
𝛿Dvis shown at 500 hPa (both for ECHAM model results and TES data) and at near-surface layers (only ECHAM results due to the poor quality of TES data near the surface). This allows us to visualize the isotopic gradients between the lower and the middle atmosphere and their changes under varying ENSO conditions. Further-more, the isotopic composition of precipitation (ECHAM and GNIP data) is added. The difference between the isotopic signals of precipitation and of near-surface water vapor is indicated by the length of the colored bars, which are each associated to a different ENSO state (always with the above introduced distinction of La Niña, neutral, and El Niño states).
Over the Central Pacific, El Niño conditions correspond to an anomalously warm and wet atmosphere with more intense convection and correspondingly more precipitation (see Figure 1). The combination of these changes results in a reduced vertical isotopic gradient during El Niño events. Both atmospheric lev-els, near-surface layers and the middle troposphere (500 hPa), contribute to this reduced gradient. The near-surface layers become more depleted and the middle troposphere becomes more enriched than dur-ing ENSO neutral conditions. Durdur-ing La Niña the atmosphere reacts oppositely with more depleted𝛿Dvin the middle troposphere. Near-surface levels remain nearly unchanged compared to ENSO neutral condi-tions. Nevertheless, the consequence of La Niña conditions is an increased isotopic gradient. Over the WPWP (Figure 8b) one recognizes an inverse response, i.e., the vertical gradients of the water isotopologues are react-ing in an opposite sense compared to the Central Pacific. Though the shift to a steeper isotopic gradient under El Niño conditions and to a less steep gradient during La Niña is not so clear as at the Central Pacific (Figure 8b), it is evident that the WPWP region reacts inversely to the Central Pacific.
The variable dynamics of𝛿Dvin the atmospheric column is accompanied by associated changes in the iso-topic equilibrium between precipitation and near-surface water vapor. In Figure 8, the length of the three colored bars gives a qualitative measure of the isotopic difference between the falling raindrops and sur-rounding vapor during the three ENSO phases. The bars connect the ECHAM modeled isotopic values of the near-surface vapor (𝛿Dvap-surface) and precipitation (𝛿Dp). Over the Central Pacific the distance between both values is shortest during El Niño and largest during La Niña. As was explained in detail in section 3.4 these changes correspond to negative excursions from the isotopic equilibrium during El Niño and to near-equilibrium situations during La Niña. Again, we find the inverse situation over the WPWP area. There, the distance between𝛿Dpand𝛿Dvap-surfaceis largest during El Niño (approaching equilibrium) and smallest during La Niña. It is not possible to fully confirm these model results by observations since we do not have access to reliable information on the isotopic composition of near-surface water vapor over the respective areas. However, at least all available GNIP𝛿Dpdata correspond to the variations of the modeled precipita-tion𝛿D values in our study areas, i.e., a response corresponding to the isotopic amount effect. El Niño, La Niña, and neutral conditions are associated to wet, dry, and intermediate situations over the Central Pacific, and the associated precipitation is isotopically most depleted, less depleted, and intermediate in the GNIP
Figure 8. Average𝛿Dpand𝛿Dvduring La Niña, normal, and El Niño condition from ECHAM, TES, and GNIP database at (a) Central Pacific and (b) West Pacific. Lines show the differences between normal condition (black), El Niño (red), and La Niña (blue) from ECHAM as a benchmark.
observations similar to the ECHAM model results. The contrary holds for the WPWP area where again the GNIP data confirm the ECHAM model results.
Although there are many processes that may influence the isotopic composition of water vapor during ENSO events such as moisture convergence, large-scale advection, and subsidence, the response of the water isotopologues to ENSO conditions in different parts of the Pacific/Indian Ocean is plausibly caused by the associated changes in convective activity and convectively formed precipitation. Convection picks up water vapor in near-surface layers, which is isotopically enriched relative to water in the middle troposphere. Within the convective updrafts this comparably enriched vapor is lifted up to higher levels undergoing continuous condensation and isotopic depletion of the corresponding vapor. A further process often linked to convec-tive activity is the possible uplift of condensate (possibly in form of ice crystals) and the reevaporation of this comparably enriched condensate. The latter process was often discussed as one of the leading mechanism humidifying the upper troposphere [Moyer et al., 1996; Smith et al., 2006; Lee et al., 2011] and might also con-tribute to the anticorrelation between ENSO and𝛿Dvat midaltitudes. In summary, more intense convection means less depleted vapor in the middle troposphere since it connects lower atmospheric layers more effec-tively with higher layers. The inverse is true for situations with less intense convection as for the WPWP during El Niño events.
An increase in convective precipitation also affects the isotopic composition of near-surface vapor and the corresponding precipitation. Convective precipitation is typically formed by larger raindrops with greater fall velocities than smaller droplets, the later being more typical for rain formation within stratiform clouds. Both size and fall velocity do not favor isotopic equilibrium between raindrops and surrounding vapor [Stewart, 1975]. The shorter the time a raindrop is in contact with the corresponding water vapor, the more incomplete is the isotopic equilibrium between both. Also, a comparably wet atmosphere below the cloud base reduces
the evaporative flux from the raindrops. The combination of these factors typical for El Niño condition in the Central Pacific, i.e., larger rain drops, large fall velocities of the raindrops, and a wetter atmosphere below the cloud base suppress the isotopic exchange between the raindrops and the atmosphere and lead to a larger isotopic disequilibrium. This is exactly what the ECHAM model simulates and what is qualitatively in agreement with the available data (see section 3.4). The latter mechanisms have been mentioned repeatedly as contributing to the classical isotopic amount effect [Dansgaard, 1964; Rozanski et al., 1993; Araguás-Araguás
et al., 1998; Bony et al., 2008; Risi et al., 2008]. Here we have shown that at least in the ECHAM model (and
in qualitative agreement with observations), the amount effect and the rain-vapor equilibrium processes are strongly linked to the intensity of convective precipitation.
5. Conclusions and Perspectives
We demonstrated that the ECHAM model is able to reproduce observed changes of the isotopic composition of water vapor and precipitation associated to ENSO, both in near-surface atmospheric layers and in the mid-dle atmosphere. We identified two locations that are particularly influenced by ENSO and represent different climatic conditions, the Central Pacific and the West Pacific warm pool area. The ECHAM model reproduces the variable relationships between ENSO indices and𝛿Dvat different height levels and variable degrees of isotopic equilibrium between𝛿Dvap-surfaceand𝛿Dpand its relation with ENSO. We also demonstrate that the leading process controlling these variable relationships between the𝛿Dvand different climate quantities in the ECHAM model is the simulated convective activity. The importance of convection is also in qualitative agreement with observations.
However, does the model do the right thing for the right reason? This persistent question of all climate mod-eling is important in particular with regard to the use of the water isotopologues. Equilibrium fractionation processes are established from laboratory experiments. However, most nonequilibrium processes are param-eterized within the hydrological cycle of the GCMs in a simplistic way. Even the exact functioning of ocean surface evaporation and the dependence of the isotopic fractionation during evaporation on wind conditions and ocean surface properties is still unclear [Schmidt et al., 2005; Bony et al., 2008; Risi et al., 2008]. Our analysis suggests that two issues should be investigated in more detail in further studies:
1. The equilibrium between rain droplets and surrounding vapor is introduced into the ECHAM model as into most existing isotopic GCMs in a simplistic way. Raindrops from stratiform clouds are prescribed being in near equilibrium with the vapor (95% equilibrium), whereas convective rain is prescribed being only partly in equilibrium (50%). This parameterization is certainly reasonable based on observations of typically different raindrop sizes. However, nature does not know such a clear distinction between stratiform and convective rain as it is used in most climate models. A mechanistic representation of isotopic equilibrium processes for falling raindrops needs a realistic representation of raindrop size spectra in climate models, something which is not yet available. It would also need additional laboratory experiments since exist-ing parameterizations of below cloud isotopic processes (evaporation of raindrops into a relatively humid atmosphere) is based on few experiments performed in the 1970s [Stewart, 1975] and needs certainly a broader experimental base. Here the found robustness of the varying isotopic disequilibrium between
𝛿Dvap-surfaceand𝛿Dpshould be studied in more detail in future sensitivity experiments such as in Jouzel
et al. [1991]. Furthermore, a broader observational basis is needed in particular for𝛿Dvabove the ocean surface, preferentially by remote sensing techniques to provide a large spatial coverage or by in situ ship measurements.
2. We associated the anticorrelation of𝛿Dvat 500 hPa and ENSO to the uplift of comparably enriched surface vapor within convective systems. This result needs also a more detailed analysis preferentially using multi-model ensemble runs. Different parameterization schemes describing the triggering of convection and the uplift of lower layer air to higher layers might differ with regard to the simulated water isotopologue sig-nal during ENSO. Ideally, such a comparison of different isotopic GCMs could provide us with an interesting benchmark test for the performance of the different convection schemes during ENSO.
The leading mechanisms controlling the anticorrelation between water isotopologues and precipitation in the tropics/subtropics (i.e., the amount effect) are disputed since the first description of the amount effect in the 1960s [Dansgaard, 1964]. Recent studies show that evaporation of falling raindrops into the atmosphere under the cloud base is an important source of humidity for the boundary layer [Sud and Walker, 1993; Worden
important humidity source compared to the evaporation from raindrops formed in convective events. This flux is considerably more enriched. On the other hand, in the tropics more rainfall means more intense uplift within the tall convective towers. Such a vertical rainout effect leads to condensation at colder cloud top tem-peratures and produces more fractionation at the end of the Rayleigh distillation process. Both circumstances lead to more depleted precipitation and, finally, by less reevaporation of raindrops and isotopic exchange to more depleted water vapor in the boundary layers [Lee and Fung, 2007; Risi et al., 2008; Moore et al., 2014]. Despite these important recent contributions, the importance of the different processes contributing to the isotopic amount effect is still under debate. Here we point particularly to the role of evaporation and isotopic reequilibration of falling raindrops below the cloud base. Again a multimodel sensitivity study might be able to disentangle the importance of the different processes. The latter is particularly important in order to obtain a solid basis for the interpretation of the many existing and upcoming paleoisotope records from the tropics of which interpretation is notoriously complicated [LeGrande and Schmidt, 2011].
In this study we did not discuss the influence of moisture convergence to𝛿D in precipitation and vapor during ENSO in detail. Lee et al. [2007] and Moore et al. [2014] discussed the importance of moisture convergence and its contribution to the amount effect in the lower troposphere. An investigation of the relation between the strength of moisture convergence and the isotopic composition of water during ENSO events is suggested for future studies.
Our finding shows that the isotopic composition of water vapor measured by satellites can be used to study the ENSO variability and its impact at low and high altitudes. It is now generally believed that the key pro-cesses controlling the spread in simulated climate sensitivity of the existing climate models are situated in the tropics/subtropics and are linked principally to cloud processes and their coupling to the atmospheric dynam-ics as represented by the different models [Sherwood et al., 2014]. A possible application of studies like the one presented here is to develop a diagnostic tool based on the water isotopologues to evaluate the different cloud processes simulated by GCMs [Stevens and Bony, 2013].
References
Aggarwal, P. K., J. R. Gat, and K. F. O. Froehlich (2007), Isotopes in the Water Cycle: Past, Present and Future of a Developing Science, Springer, Berlin.
Araguás-Araguás, L., K. Rozanski, and K. Froehlich (1998), Stable isotope composition of precipitation over Southeast Asia, J. Geophys. Res.,
103(D22), 28,721–28,742.
Becker, B., B. Kromer, and P. Trimborn (1991), A stable-isotope tree-ring timescale of the late glacial/Holocene boundary, Nature, 353, 647–649.
Bechtold, P., J.-P. Chaboureau, A. Beljaars, A. K. Betts, M. Köhler, M. Miller, and J.-L. Redelsperger (2004), The simulation of the diurnal cycle of convective precipitation over land in a global model, Q. J. R. Meteorol. Soc., 130(1), 3119–3137, doi:10.1256/q.j.03.103.
Betts, A. K., and C. Jakob (2002), Evaluation of the diurnal cycle of precipitation, surface thermodynamics, and surface fluxes in the ECMWF model using LBA data, J. Geophys. Res., 107(D20), 8045, doi:10.1029/2001JD000427.
Bony, S., C. Risi, and F. Vimeux (2008), Influence of convective process on the isotopic composition (𝛿18O and𝛿D) of precipitation and water vapor in the tropics: 1. Radiative-convective equilibrium and Tropical Ocean-Global Atmosphere-Coupled Ocean-Atmosphere Response Experiment (TOGA-COARE) simulations, J. Geophys. Res., 113, D19305, doi:10.1029/2008JD009942.
Brown, D., J. Worden, and D. Noone (2008), Comparison of atmospheric hydrology over convective continental regions using water vapor isotope measurements from space, J. Geophys. Res., 113, D15124, doi:10.1029/2007JD009676.
Conroy, J. L., K. M. Cobb, and D. Noone (2013), Comparison of precipitation isotope variability across the tropical Pacific in observations and SWING2 model simulations, J. Geophys. Res. Atmos., 118, 5867–5892, doi:10.1002/jgrd.50412.
Covey, C., K. M. AchutaRao, U. Cubasch, P. Jones, S. J. Lambert, M. E. Mann, T. J. Philips, and K. E. Taylor (2003), An overview of results from coupled model intercomparison project, Global Planet. Change, 37, 103–133, doi:10.1016/S0921-8181(02)00193-5.
Craig, H. (1961), Standard for reporting concentrations of deuterium and oxygen-18 in natural waters, Science, 133, 1833–1834, doi:10.1126/science.133.3467.1833.
Curtis, S., and R. Adler (2000), ENSO indices based on pattern of satellite-derived precipitation, J. Clim., 13, 2786–2793. Dai, A., and T. M. L. Wigley (2000), Global patterns of ENSO-induced precipitation, Geophys. Res. Lett., 27, 1283–1286. Dansgaard, W. (1964), Stable isotopes in precipitation, Tellus, 16, 436–468.
Dee, D. P., et al. (2011), The ERA-Interim reanalysis: Configuration and performance of the data assimilation system, Q. J. R. Meteorol. Soc.,
137, 553–597, doi:10.1002/qj.828.
Frankenberg, C., et al. (2009), Dynamic processes governing the isotopic composition of water vapor as observed from space and ground,
Science, 325, 1374–1377, doi:10.1126/science.1173791.
Gat, J. R. (1996), Oxygen and hydrogen isotopes in the hydrologic cycle, Annu. Rev. Earth Planet. Sci., 16, 225–262.
Gershunov, A., and T. P. Barnett (1998), Interdecadal modulation of ENSO teleconnections, Bull. Am. Meteorol. Soc., 79, 2715–2725. Gedzelman, S. D., and R. Arnold (1994), Modeling the isotopic composition of precipitation, J. Geophys. Res., 99(D5), 10,455–10,471. Herman, R. L., J. E. Cherry, J. Young, J. M. Welker, D. Noone, S. S. Kulawik, and J. Worden (2014), Aircraft validation of Aura Tropospheric
Emission Spectrometer retrievals of HDO/H2O, Atmos. Meas. Tech., 7, 3127–3138, doi:10.5194/amt-7-3127-2014. Hoffmann, G., and M. Heimann (1997), Water isotope modeling in the Asian monsoon region, Quat. Int., 37, 115–128.
Hoffmann, G., M. Werner, and M. Heimann (1998), Water isotope module of the ECHAM atmospheric general circulation model: A study on timescales from days to several years, J. Geophys. Res., 103(D14), 16,871–16,896.
Acknowledgments
This study was funded by NWO (The Netherlands Organization for Scientific Research) project number ALW-GO-AO/10-11. R.A. Scheepmaker acknowledges funding from the Netherlands Space Office as part of the User Support Program Space Research under project GO-AO/16. The TES and SCIAMACHY satellite data were obtained from the NASA Jet Propulsion Laboratory (JPL) and SRON Netherlands Institute for Space Research, respectively. The ECHAM4 data were downloaded from the SWING2 database, National Aeronautics and Space Administration (NASA) Goddard Institute for Space Studies. The TRMM and ECMWF precipitation data were obtained from the NASA Goddard Earth Sciences Data and Information Service Center and the ECMWF data center, respectively. The GNIP data were downloaded from Water Isotope System for Data Analysis, Visualization, and Electronic Retrieval (WISER), International Atomic Energy Agency (IAEA). All data used in the study can be obtained from the authors (S.J.Sutanto@uu.nl).


![[PDF] Support de formation avancé de Windows Server 2008 | Cours informatique](data:image/gif;base64,R0lGODlhAQABAIAAAP///wAAACH5BAEAAAAALAAAAAABAAEAAAICRAEAOw==)