HAL Id: hal-02613704
https://hal.archives-ouvertes.fr/hal-02613704
Submitted on 20 May 2020
HAL is a multi-disciplinary open access
archive for the deposit and dissemination of
sci-entific research documents, whether they are
pub-lished or not. The documents may come from
teaching and research institutions in France or
abroad, or from public or private research centers.
L’archive ouverte pluridisciplinaire HAL, est
destinée au dépôt et à la diffusion de documents
scientifiques de niveau recherche, publiés ou non,
émanant des établissements d’enseignement et de
recherche français ou étrangers, des laboratoires
publics ou privés.
in synergistic anion-π and H-bond based anion receptor
Romain Plais, Guy Gouarin, Anne Gaucher, Violette Haldys, Arnaud
Brosseau, Gilles Clavier, Jean-Yves Salpin, Damien Prim
To cite this version:
Romain Plais, Guy Gouarin, Anne Gaucher, Violette Haldys, Arnaud Brosseau, et al.. Intertwined
detection and recognition roles of tetrazine in synergistic anion-π and H-bond based anion receptor.
ChemPhysChem, Wiley-VCH Verlag, 2020, 21 (12), pp.1249-1257. �10.1002/cphc.202000289�.
�hal-02613704�
RESEARCH ARTICLE
1
Intertwined detection and recognition roles of tetrazine in
synergistic anion-π and H-bond based anion receptor
Romain Plais,
[a]Guy Gouarin,
[a]Anne Gaucher,
[a]Violette Haldys,
[b], [c]Arnaud Brosseau,
[d]Gilles
Clavier,
[d]Jean-Yves Salpin,
[b], [c]and Damien Prim*
[a]Dedication ((optional))
[a] Mr. R. Plais, Mr. G. Gouarin, Dr. A. Gaucher, Prof. Dr. D. Prim ILV
Université Paris-Saclay, UVSQ, CNRS 78035 Versailles (France)
E-mail: damien.prim@uvsq.fr [b] Mme. V. Haldys, Dr. J.-Y. Salpin
LAMBE
Université Paris-Saclay, CNRS, Univ. Evry 91025 Evry (France)
[c] Mme. V. Haldys, Dr. J.-Y. Salpin LAMBE
Université Paris-Seine, CNRS, U-Cergy 91025 Evry (France)
[d] Mr. A. Brosseau, Dr. G. Clavier PPSM
Université Paris-Saclay, CNRS, ENS Paris-Saclay, 94235 Cachan (France)
Supporting information for this article is given via a link at the end of the document.
Abstract: The intrinsic properties of tetrazine as a -anion receptor
and as an on/off recognition probe merged with H-bond ability of an urea motif into a single architecture designs a new generation of well-defined anion receptors. Complexation properties directly benefit from the dual and synergistic contribution of tetrazine and urea. In this study, we report on the synthesis and assessment of binding properties to anions of diverse geometries. Association constants have been predicted by theoretical calculations and evaluated by multiple and complementary experimental techniques including electrospray-mass tandem spectroscopy, NMR, UV-Visible, steady state fluorescence spectroscopies and time resolved fluorescence. These results provide the basis for a better understanding of both the complexation and the anion-dependent quenching mechanism.
Introduction
Anions play crucial roles in many biological processes,[1,2]
environmental detection[3–5] and catalysis. [6–8].Their wide potential
applications but also the deep understanding of biological events and the exploration of noncovalent interactions motivated an increasing interest of the scientific community which rivalled in creativity for selective anion recognition and/or sensing. Historically and predominantly, the design of anionic receptors has incorporated one or more hydrogen bonding donors (HBs).[9]
More recently, several distinct weak interactions such as anion-[10], electrostatic interactions, hydrophobic effects or halogen
bonds[11] emerged to complement the panel of noncovalent
interactions, thus devising new families of receptors. If such noncovalent interactions have been widely but independently
used in current receptors, the cooperation between distinct noncovalent interactions embedded into a unique receptor frame is an emerging area of research, [12–14] almost restricted to
theoretical [13] or crystallographic [12] studies. The development of
such receptors is in its infancy but is likely to bring new avenues in anion recognition provided that this new generation of receptors (i) exhibits an adaptive behaviour to various anion geometries, (ii) features a user-friendly and straightforward synthesis and (iii) allows accurate detection/characterization of binding properties. Alongside highly pre-organized rigid receptors widely spread in supramolecular chemistry, [15] we focused our attention on single
molecules comprising a hydrogen bonding donor linked to a -deficient heterocycle able to generate anion-interactions. Based on our recent publications [16–21] and publications from Melguizo
and Bianchi, [22,23] we envisioned that the combination of urea and
tetrazine moieties would be beneficial to anion binding and allow cross-characterisation of binding properties. On one hand, the urea motif would enable gaining information from 1H NMR
techniques and on the second we take benefits from the dual role of the tetrazine fragment acting as anion-acceptor and as fluorescent probe (Scheme 1).
RESEARCH ARTICLE
2
Herein, we report the synthesis and exploration of anion binding properties of an unprecedented urea-tetrazine receptor. Intertwined characterization of the receptor-anion architectures and determination of association constants as well as synergistic contribution of distinct non-covalent interactions, rely on theoretical methods and a broad scope of experimental methods such as electrospray-tandem mass spectrometry, NMR, UV-Visible and steady state fluorescence spectroscopies as well as time resolved fluorescence.
Results and Discussion
Theoretical calculations and structural parameters
To evaluate the potential of this new ligand in anion binding, we have performed DFT calculations using Gaussian 09 software [24]
of 1 in combination with a selection of five anions.
Table 1. Optimized geometries, ESP and NCIplot of receptor 1 and complexes with anions at APFD/6-31+G(d,p) level
[a] Interaction energy in kJ/mol, with Polarizable Continuum Model for Acetonitrile, calculated from Gibbs Free Energies
Entry Optimized Geometry ESP NCIplot ΔGint,ACN [a]
1 1 - 2 1-Cl -29.7 3 1-Br -29.9 4 1-I -17.0 5 1-SCN -11.5 6 1-PF6 +6.7
RESEARCH ARTICLE
3
Optimization and frequency calculations were performed using the APFD/6-31G+(d,p) level without any solvent correction. APFD functional was chosen due to its accuracy in computing long-range interactions and modelling of hydrogen bond complexes.
[25] The effect of solvent was evaluated by optimizing the
geometries using an IEFPCM model for acetonitrile (ESI §2.1). No significant changes in geometries were observed on applying solvent correction. For complexes including bromide and iodide ions, two basis set were used: APFD/LANL2DZ for bromide and iodide, respectively and APFD/6-31G+(d,p) and others atoms. Optimized geometries are detailed in Supporting Information (p.7-20). Electrostatic Potentials Surfaces (ESP) were calculated using Gaussview software from optimized structures using a fine grid for Total Density and a medium grid of ESP. To visualize non-covalent interactions in real space, we have used a tool called Non-Covalent Interactions plot (NCIplot). These 3D plots were calculated using the script developed by Rzepa available on the website application of the Imperial College London. [26,27]
Interaction energies with and without solvent effect were calculated by generating frequencies calculations from optimized geometries using triple zeta basis set APFD/aug-ccpvtz level of calculation. [28] All the results of these calculations are showed in
Table 1 and in Supporting Information (ESI §2.2).
As shown in Table 1, the receptor 1 adopts a conformation in which the tetrazine core is almost perpendicular to the hydrogen bond donor, thus minimizing repulsive interactions between the tetrazine and the urea fragments (table 1, entry 1, NCIplot). As evidenced by the NCIplot, this conformation and the overall 3D shape of receptor 1 are set by several weak interactions involving (i) ortho protons of the aromatic fragment and the urea carbonyl motif, (ii) a combination of two hydrogen bonds between protons of the aliphatic spacer and the urea carbonyl on one hand and the tetrazine nitrogen atoms on the other hand. Interactions between receptor 1 and anions of different geometries were then characterized. Optimized geometries show that the presence of an anion close to the receptor deeply impact the overall geometry enabling the folding around the anion thus maximizing attractive interactions between X- and both the urea and the tetrazine motifs.
Noteworthy, the folding depends on the size and the geometry of the guest anion. All NCIplots evidence defined dish-shaped surfaces allowing visualization of anion- interactions. Large NCIplot surfaces can be observed for 1-Cl and 1-Br complexes suggesting strong interactions, whereas 1-I, 1-SCN and 1-PF6
display less pronounced surfaces and interactions. As anticipated by NCIplot surface intensities, calculated interaction energies in acetonitrile follow similar trend: high interaction energies of a close order of magnitude for 1-Cl (-29.7 kJ/mol) and 1-Br complexes (-29.9 kJ/mol) and decreasing interaction energies obtained for 1-I (-17.0 kJ/mol) and 1-SCN (-11.5 kJ/mol). A positive value was obtained for 1-PF6, indicative of a
non-spontaneous complexation in acetonitrile. As illustrated in Table 1, both the anion size and geometry impact the topology of complexes 1-X. Even in a same anion geometry series, variations of the relative orientation of the urea, the anion and the tetrazine fragments clearly modify the overall topology of the corresponding complexes. For all spherical anions, the general trend of the 3D topology (Figure 1) is set by two main elements: (i) the strong interaction between urea protons Ha and Hb and the anion
contributes to the formation of straight plane composed by C, N and H atoms of the urea motif and the anion. (ii) due to the anion- interaction, the latter plane almost parallels the planar tetrazine
ring. The strength of both H-bonds and anion- interactions is clearly depending on the size and properties of the anion which might thus impact the relative spatial orientation of the triptych urea/anion/tetrazine within the complex series. Key parameters allowing complete characterization of their structures are compiled in Table 2 and compared within the spherical anion series. Indeed, N-Ha/Hb bond lengths and through space Ha/Hb-X
-distances are privileged features of the complexation to the urea motif. In addition, distances between X and the centroïd of the tetrazine but also to all tetrazine nitrogen atoms Na/Nb/Nc/Nd are
indicative of the precise location of the anion and the directionality of the anion- interaction (Table 2).
a)
CF3 F3C Na Nb O Ha Hb O NcN e Nf Nd Clb)
c)
d)
e)
Figure 1. a) Labelling system and selected views of 1-Cl (CF3 groups are
omitted for clarity). b) and c) front and side views of cofacial arrangement between the urea/Cl and the tetrazine planes. d) position of Cl- with respect to
median axis of the urea. e) distance between Cl- and the tetrazine centroïd.
If receptor 1 displays identical Na-Ha and Nb-Hb bond distances,
the latter increased consistently in 1-Cl, 1-Br and 1-I with the formation of H-bond interaction. Interestingly, the H-bond interaction allowed discriminating Na-Ha and Nb-Hb bond distances.
Indeed, in all cases the electron withdrawing effect of the aromatic fragment proximal to Ha strengthen the H-bond inducing the
increase of the Na-Ha bond distances in a larger extent by
comparison with the corresponding Nb-Hb. In addition, depending
on the nature of the anion the through space distance between the anion and Ha and Hb are also impacted. Strong interaction led
to shortest distances as evidenced by the Ha- or Hb-X which
increase from Cl- to I- (compare entries 3 and 4 for each anion).
Again Ha-X or Hb-X distances are different, Ha-X being the
shortest reflecting a strongest interaction. The anion- interaction with the tetrazine fragment also induces modifications on the overall shape depending on the anion. As expected, the X-
-RESEARCH ARTICLE
4
centroid distances are close for Cl- (3.12Å) and Br- (3.15Å) but
markedly increased for I- (3.49Å). The fact that N
a-Ha and Nb-Hb
but also Ha-X or Hb-X distances are discriminated in complexes
1-Cl, 1-Br and 1-I also impacted the relative orientation of the tetrazine planar ring. Indeed, in 1-Cl, Nc-X and Nd-X on one hand
and Ne-X and Nf-X on the other hand display very close through
space distances indicating an almost cofacial arrangement between the tetrazine and the urea/Cl plane. In contrast, in both
1-Br and 1-I, Nc-X and Nd-X as well as Ne-X and Nf-X differ
markedly from each other, inducing a twist of the tetrazine ring with respect to the 1-Cl case. This deformation might originate from the joint increase of anion size and concomitant decrease of H-bonding order and increase of anion- interaction.
Table 2. Key structural parameters of 1-X topologies calculated on the
APFD/6-31+G(d,p) level
Entry Bond[a] 1 1-Cl 1-Br 1-I
1 Na-Ha 1.011 1.037 1.034 1.029 2 Nb-Hb 1.011 1.030 1.027 1.023 3 Na-X -- 2.099 2.217 2.545 4 Nb-X -- 2.207 2.399 2.751 5 X-centroïd -- 3.12 3.15 3.49 6 Nc-X -- 3.491 3.515 3.774 7 Nd-X -- 3.500 3.579 3.722 8 Ne-X -- 3.411 3.393 3.874 9 Nf-X -- 3.403 3.436 3.822 [a] distance in Å
The linear thioisocyanate anion adopts a conformation almost orthogonal to the urea moiety. As a result, the overall topology of
1-SCN appears more flared shaped than the corresponding
spherical anion geometry. The polarisable sulphur atom generates a strong interaction with the urea as shown in Table 1. Interestingly, carbon and nitrogen atoms are interacting with the tetrazine as evidenced by the dish-shaped surface characteristic of an anion- interaction. The large hexahedral PF6- behaves
similarly to other anions interacting with the urea fragment. As expected, distances between PF6- and both urea and tetrazine
motifs increases leading to a loose anion- interaction by comparison with previous geometries.
Synthesis
Synthesis of receptor 1 was achieved using a two steps short sequence (Scheme 2) involving the condensation of ethanolamine on the commercially available 3,5-bis(trifluoromethyl)phenyl isocyanate to form the urea moiety S1 in the first step in 89% yield. [29] In a second step, a nucleophilic
aromatic substitution of dichlorotetrazine enables the formation of receptor 1 in 58% yields. [30] In order to evaluate the impact of the
presence of the tetrazine unit in the receptor on the complexing properties, receptor 2 was synthesized by a reaction sequence similar to S1 using 2-methoxyethylamine in 66% yield.
All the compounds were fully characterized by spectroscopic methods (Supporting Information p. 22-31).
Scheme 2. Synthesis of receptors 1 and 2
Tandem mass spectrometry
In order to get some insights about the nature of the complex(es) generated by the association of the receptor 1 with the different anions, we first performed a series of tandem mass spectrometry experiments, by using a 3D ion trap instrument (Bruker Amazon Speed ETD). This allows to access to the intrinsic reactivity of 1 towards the series of anions. Complexes were generated in the gas phase by electrospraying equimolar mixtures of 1/TBAX. Starting from 10-1 M stock solutions of 1 and TBAX prepared in
acetonitrile (ACN) and purified water, respectively, 10-4 M
mixtures of 1/TBAX (90/10 ACN/H2O) were introduced in the
electrospray source by a syringe pump (3 µL/min). Detailed experimental conditions can be found in the Supporting Information. For the sake of simplicity, the m/z values given in this section correspond to the monoisotopic peak. A Typical ESI spectrum for such mixtures is given in Figure 2a for the 1/TBACl system.
Whatever the anion studied, electrospray spectra of these mixtures result in the formation of two very intense complexes of general formula [(1)n-X]- (n=1,2). Depending on the experimental
conditions, [(1)3-X]- can be observed but generally in very weak
abundance (presently m/z 1325.0). We do not observe complexes with remaining solvent molecules. The chemical composition of the complexes can be confirmed by examining the experimental isotopic distributions (see insert of Figure 2a for the [(1)-Cl]
-complex). Consequently, formation of these singly charged ions turned to be a very facile process. On the other hand, we did not detect any doubly charged anion that would correspond to the interaction of 1 with two X- anions.
We then tried to obtain structural information about these complexes by recording their MS/MS spectra. Whatever the anion considered, MS/MS spectra of the dimeric species [(1)2-X]
-systematically correspond to the elimination of an intact molecule of receptor 1, leading to [(1)-X]-. On the other hand, different
behaviors are observed upon collision for the 1:1 complex. Elimination of 1 and formation of X- from [1-X]- is not the only
process, except for PF6- (see Figure S19), which indicates that for
this anion the interaction is particularly weak in the gas phase. This finding is in agreement with the very small computed interaction energy (Table 1 and ESI §2.2). This is also consistent with data obtained in solution by NMR, UV of fluorescence experiments, which indicate that PF6- does not interact with the
RESEARCH ARTICLE
5
Figure 2. a) Electrospray mass spectrum of an equimolar (10-4 M) mixture of1/TBACl (90/10 acetonitrile/water) - b) MS/MS spectrum of the [1-Cl]- ion (m/z
465) – c) MS/MS spectrum of the [(1)2-Cl]- ion (m/z 895)
For the other [(1)-X]- anions, dissociation channels involving the
cleavage of covalent bonds are observed, therefore suggesting a strong interaction of the anion with the receptor. Note that in some cases (SCN, Cl), the formation of the X- ions corresponds to m/z
values which were well below the low-mass cutoff of our ion trap. We tried to lower as much as possible the low mass cut-off, in order to try to detect X-, but it can result in the complete loss of
the signal. This was the case for X=Cl or SCN, and therefore we could not be able to detect SCN- or Cl-, although their formation
cannot be rigorously discarded. Br- could be detected in weak
amounts. Note however that formation of X- should be associated
to a small interaction energy, and therefore the abundance of X
-should decrease as the interaction energy increases. Consistently, I- and PF
6- are observed in significant abundances (Figures S17
and S19).
Our series of MS/MS experiments allowed to demonstrate that the various adducts share several fragmentation processes. This dissociation pattern is summarized in Scheme 3, and the MS/MS spectrum obtained for the [(1)-Cl]- ion is reported in Figure 2b.
Elimination of HX associated to deprotonation of 1 (m/z 429), is observed for three anions, namely Cl-, SCN- and Br-. This process
is not observed with iodide or PF6-. The extent of this
fragmentation is correlated to the gas-phase acidity of HX.[31] The
m/z 429 ion is indeed intense for Cl- and SCN- (H°
acid(HCl)= 1395
kJ/mol) ; H°acid(HSCN)= 1361 kJ/mol), weaker for Br
-(H°acid(HBr)= 1353 kJ/mol) and is absent for I- (H°acid(HI)= 1315
kJ/mol).
Scheme 3. General dissociation scheme for the [(1)-X]- complex under CID
conditions
Formation of m/z 429 probably implies removal of one of the urea proton (See section 4.5 of the Supporting Information). Reasonably, removal of Ha should be more favorable since the
resulting anion would be stabilized by a mesomeric effect involving the benzenic ring. This process therefore suggests interaction of the anion with the urea moiety, in agreement with the calculations.
Another characteristic fragment ion is the [C2N4OCl]- ion (m/z 131).
This fragmentation, together with the elimination of the 132 u [C2HN4OCl] neutral undoubtedly involves the tetrazine moiety.
These processes may correspond in a first step a SN2-like
mechanism leading to the cleavage of the C(H2)-O bond and
formation of an intermediate ion/neutral complex, evolving subsequently either directly towards the m/z 131 ion, or leading, after internal proton transfer, to the elimination of 132 u. The initial interaction of X- with the urea moiety through hydrogen bonding
may result to the favorable positioning of X- for the S
N2 process.
The last characteristic fragment observed for all anions but PF6
-(Figure 2 and Figures S16-S19) is the formation of a [C2HN4OClX]- anion. This fragment ion can be formed through the
direct attack of the tetrazine moiety by X- MS/MS spectra (see
section 4.5 of the SI). To summarize, the various fragmentation processes seem to suggest that the anion interacts with both the urea and the tetrazine moieties, as already underlined by the calculations.
NMR Titrations: fundamental state binding studies
The affinity of 1 towards Cl-, Br-, I-, SCN- and PF
6- anions was
assessed by 1H NMR titrations in CD
3CN (ESI Figures S20 to
S29). The case of spherical Cl-, Br-, I- anions has been considered
first. Linear and hexahedral SCN- and PF
6- will be discussed
afterwards.
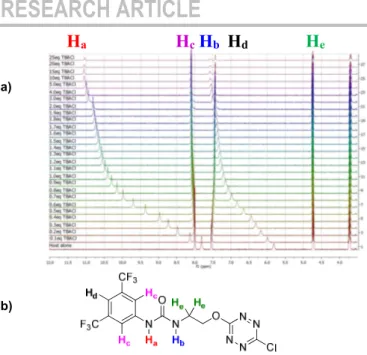
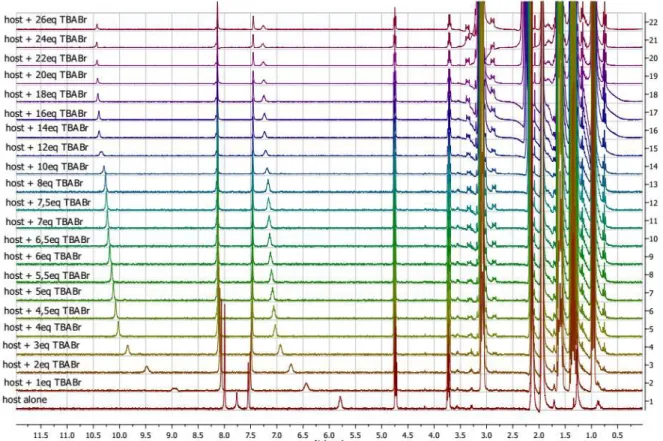
1H NMR titration spectra of 1 with TBACl is reported in Figure 3.
In CD3CN, the iterative addition of Cl- anion to the receptor
resulted in significant modifications in the 1H NMR spectrum.
Noteworthy large downfield shifts of urea protons are observed. If both protons are downshifted, they behave somewhat differently. Ha undergoes a shift from 7.81 to 11.04 ppm (ClHa = 3.23 ppm)
RESEARCH ARTICLE
6
a)b)
Figure 3. a) NMR titration of anion receptor 1 by chloride anion (0 to 25
equivalents) – b) Proton attribution
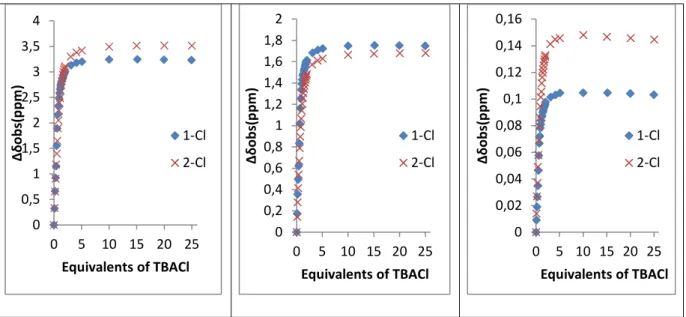
This difference plausibly arises from the electron withdrawing effect of the aromatic fragment proximal to Ha. The large Cl
observed strongly suggest tight interactions between Cl- and the
receptor. As evidenced by the spectrum aromatic protons Hd and
aliphatic proton He were only poorly affected by progressive
addition of TBACl. Evolution of chemical environment of aromatic proton Hc through complexation allow identifying modification of
the chemical shifts albeit with a lesser extent. Indeed, XHc
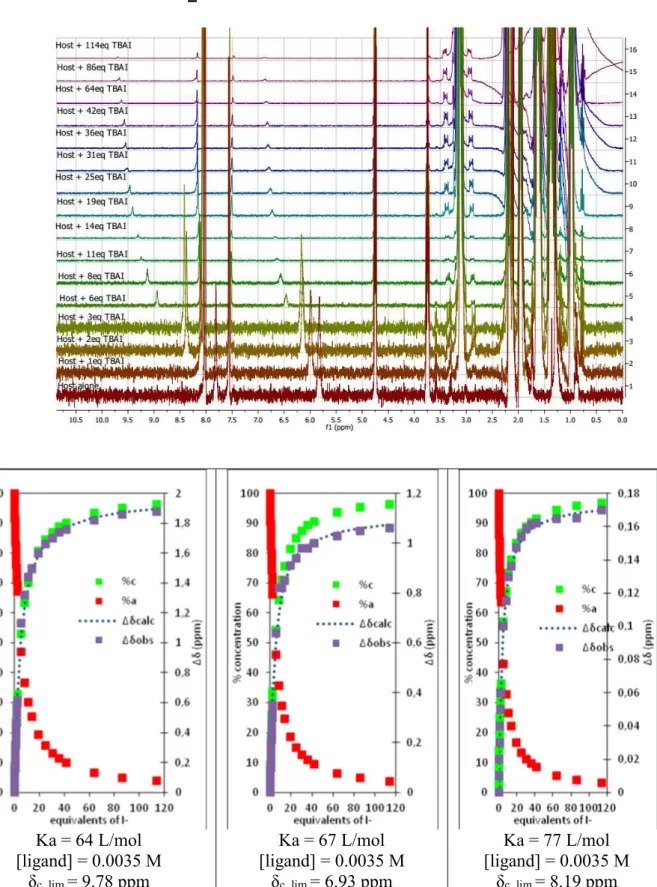
ranges from 0.05 to 0.16 ppm for all anion studied. Titration of receptor 1 with TBABr and TBAI were next realized. The corresponding 1H NMR spectra display similar general shape (SI,
Figures S24 and S26). Again BrHa (2.69 ppm) and IHa (1.64
ppm) were increased by comparison with the corresponding Hb
shifts. Comparison of Ha in titrations with spherical anions
plotted in Figure 4 and the number of equivalents of anion required to reach the endpoint, suggests a stronger interaction between Cl- and 1 than between Br- or I- and 1 in decreasing order.
Figure 4. ΔδHa calculated as a function of the number of equivalents of TBAX
(X = Cl, Br and I) added for proton Ha
Titration was next extended to linear anion SCN-. The same
approach led to 1H NMR spectrum which showed similar features
(ESI, Figure S28). Signals of Ha and Hb are downfield shifted
upon progressive addition of SCN-. Complexation to receptor 1
was characterized by SCNHa = 1.69 ppm for Ha and SCNHb =
0.76 ppm for Hb suggesting a moderate interaction between 1 and
SCN-. Finally, in the case of PF
6-, no significant shift was observed
after addition of 20 equivalents of the anion. Although less pronounced complexation process cannot be fully ruled out, interaction between 1 and PF6- could not be evidenced.
1H NMR spectra obtained after titration with various anions exhibit
similar shapes. However, the marked decrease of XHa and XHb
moving from Cl- to SCN- is indicative of the general affinity trend
between receptor 1 and the anions. To clarify and confirm this tendency, binding constants of the corresponding complexes were determined using two different methods : a single proton method developed by Gonzàlez-Gaitano et al. [32] and a global
analysis of the three protons using SPECFIT software. The first method is based on the differences in chemical shifts observed (Δδ) plotted as a function of number of equivalents of TBAX added (Table 3, Figure 4 and S31).
Table 3. Binding constants calculated from mathematical equations and with
SPECFIT® software
Entry KA, Ha[a] KA, Hb[a] KA, Hc[a] KA, SPECFIT[a]
1 1-Cl 5893 5700 5000 4892 ± 1 (0.6%) 2 2-Cl 1804 1811 1764 1757 ± 1 (0.1%) 2 1-Br 375 371 452 375 ± 1 (0.1%) 3 1-I 64 67 77 70 ± 1 (0.2%) 4 1-SCN 37 37 59 37 ± 1 (0.4%) 5 1-PF6 --[b] --[b] --[b] --[b]
[a] Binding constants in L/mol [b] No binding was observed
As anticipated after analysis of 1H NMR spectra, 1-Cl exhibit the
strongest binding constant of the series of anions (4892 L/mol). As expected, in a similar system bearing only a urea (2-Cl), a significant drop in association constant is observed (1757 L/mol), evidencing the clear cooperative and beneficial effect of the presence of both fragments (Figure S30). Moreover, a strong decrease is observed from 1-Br (375 L/mol) to 1-I (70 L/mol) and
1-SCN (37 L/mol) and no binding constant could be calculated for 1-PF6.
Photophysical analysis: excited state binding studies
Taking advantage of the photophysical properties of the ligand, the affinity of 1 towards Cl-, Br-, I-, and SCN- (as Bu
4N+ salts) was
also assessed by UV-Visible and steady state fluorescence spectroscopies as well as time-resolved fluorescence decay in acetonitrile.
Absorption spectrum of 1 was first recorded in acetonitrile and displays 4 absorption maxima at 511, 324, 295 and 246 nm (Figure S37). A TDDFT calculation (PBE0/6-311+g(d,p) level) has been done to attribute those bands. The calculated and experimental spectra match quite well (mean deviation between calculated and experimental maxima is 7%, Figure S34). The 511,
RESEARCH ARTICLE
7
324 nm bands could then be attributed to the n-π* and π-π* transitions of the tetrazine and the 295 and 246 nm bands to two π-π* transitions centered on the phenyl urea moiety (Figures S23 and S24). Fluorescence spectra of compound 1 was also recorded in the same solvent and display the typical emission band of a tetrazine [18] with a maximum at 561nm (Figure S38).
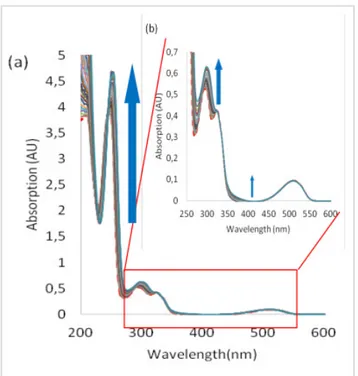
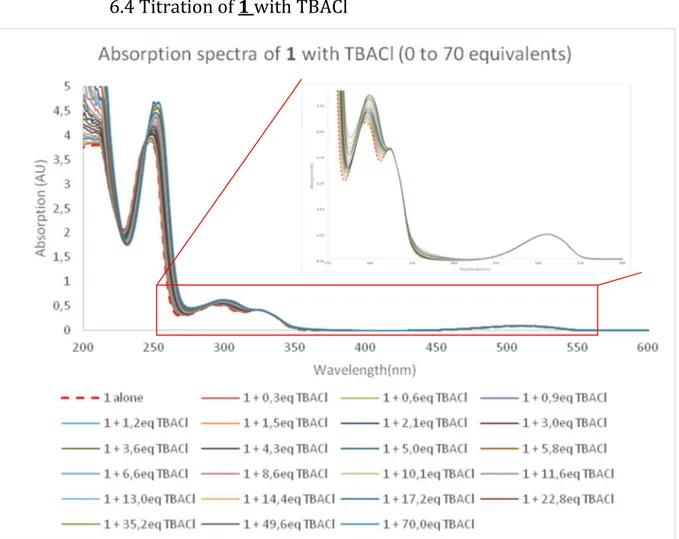
Figure 5. Absorption spectra measured during the titration of 1 with
tetrabutylammonium chloride (from 0 to 70 equivalents of TBACl): a) total spectrum b) zoom
Figure 6. Absorption spectra measured during the titration of 1 with
tetrabutylammonium iodide (from 0 to 200 equivalents of TBAI): a) total spectrum b) zoom
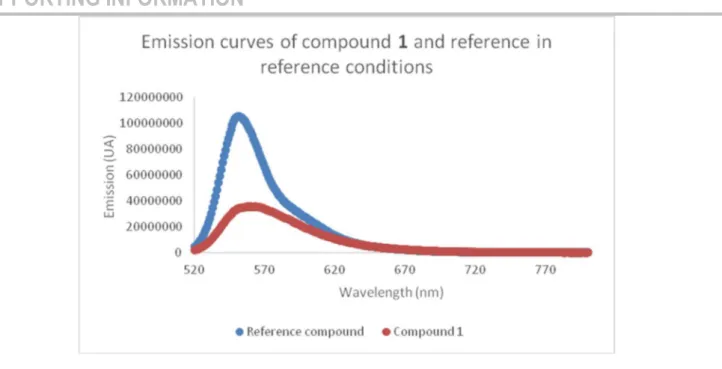
The fluorescence quantum yield was determined to 39% using Rhodamine-6G as reference.[33] This value is quite high and in
agreement with literature reported values.[18] This will facilitate the
characterization of the formation of complex since it has previously been demonstrated that interaction of the tetrazine with electron rich species leads to quenching of fluorescence.[30]
UV-Visible spectra measured during the titration of 1 with chloride anion are reported in Figure 5. We can observe both hyperchromic and bathochromic shifts of the absorption bands associated with the phenylurea moiety. A smaller variation is also observed for the tetrazine π-π* bands but its n-π* one is almost not affected by the addition of chloride anion. Similar observations can be made from the other anions UV-vis. titrations (Figures S47 [Br-], 6 [I-], and S63 [SCN-]). From these results, we can conclude
that the major interaction involved in the complexation of anions by 1 in the ground state is hydrogen bonding with urea.
Association constants for 1 to 1 complex were determined using the SPECFIT software (Table 4). Values obtained for all halides are of the same order of magnitude and lower for the thioisocyanate ion. Nevertheless, due to the relatively small variations of the spectra during the titration, the values are obtained with a large margin of error and we cannot safely interpret them.
Iodide and thiocyanate anions seem to have a particular behavior towards complexation with 1. As can be seen in the absorption spectra, a new band appears as a shoulder at approximately 360 nm. The origin of this new band is not clear.
The tetrazine is a strong electron acceptor that becomes a very strong oxidizer in its first excited state.[34] Two consequences can
be expected from this property: the interaction between the tetrazine and anions should be stronger in the excited state and fluorescence quenching. We took advantage of this property to evidence the complexation of anions by 1 by fluorescence titrations.
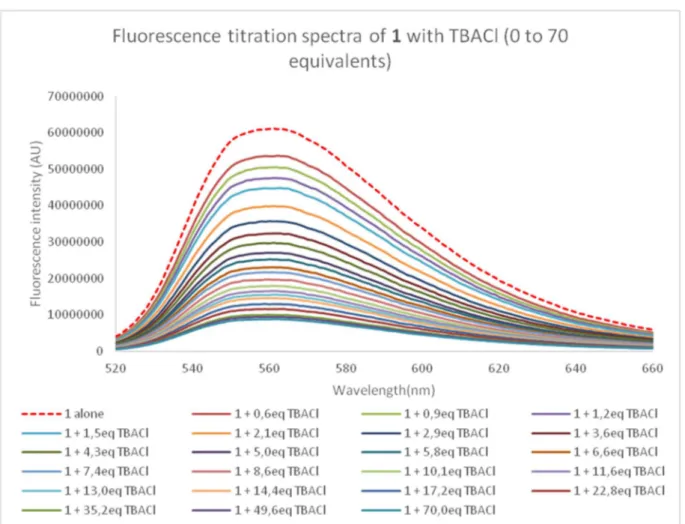
Emission quenching is very clear from the fluorescence spectra recorded during the titration of 1 with tetrabutylammonium chloride (Figure 7). Nevertheless, it can be observed that despite the large excess of salts added, complete quenching is not reached. This behavior indicates that the complex formed by 1 and chloride anion exhibits a residual fluorescence. Fluorescence decays will help further analysis of this residual fluorescence.
Figure 7. Fluorescence spectra measured during the titration of 1 with
RESEARCH ARTICLE
8
Similar quenching was observed with bromide, iodide and thioisocyanate anions (Figures S49 [Br], S57 [I] and S65 [SCN]). From these data, new values of association constants have been extracted (Table 4) by two methods: a global spectral analysis with the SPECFIT software (KA, fluo SPECFIT) and a single
wavelength nonlinear least squares fitting for a 1 to 1 model[35]
(KA,fluo, see Supporting Information for details and Table 4 and
Figures S40, S43, S48, S51, S56, S59, S64, S67). Both approaches give similar values and trend between the different anions. A slightly higher value is observed for chloride anion.
Table 4. Binding constants determined from photophysical essays from
mathematical equations and using SPECFIT® software
Entry KA, abs, SPECFIT[a] KA, fluo[a] KA, fluo SPECFIT [a] KA, decay, 65ns[a] 1 1-Cl 108 ± 1 (10%) 1763 1875 ± 1 (1%) 1461 2 1-Br 810 ± 1 (11%) 1176 1217 ± 1 (3%) 478 3 1-I 980 ± 1 (14%) 1479 1390 ± 1 (1%) 532 4 1-SCN 26 ± 1 (1%) 1386 1341 ± 1 (1%) 163 5 1-PF6 --[b] --[b] --[b] --[b]
[a] Binding constants in L/mol [b] No binding was observed
Further insight in the excited state behaviour was gained when recording fluorescence decays during the titrations of the various anions. Time resolved fluorescence gives information on the quenching mechanism: if the quenching is purely dynamic, then the fluorescence lifetime decreases while the initial fluorescence intensity of the decay remains unchanged. Inversely, if the quenching is static, the fluorescence lifetime remains constant while the initial fluorescence intensity of the decay decreases. Intermediate cases are also possible where both phenomena are observed.
Figure 8. Fluorescence decay titration of 1 with TBACl (0 to 70 equivalents),
logarithmic scale.
Fluorescence decays of 1 recorded for the titration with TBACl are presented in Figure 8 and S46. The decays become clearly shorter upon addition of the anion while the initial intensity undergo a small decrease. Mathematical fitting show 3 regimes: first a single exponential is needed with an initial lifetime of 133 ns corresponding to the unquenched tetrazine. Upon addition of chloride this lifetime decreases gradually. At 4 equivalents a second exponential with a short lifetime (20 ns) is needed to fit the decays. Finally at 50 equivalents the decay are mono-exponential again and the longer lifetime does not contribute anymore. It can thus be concluded that the complex 1-Cl is slightly fluorescent and that the tetrazine–anion interaction is mainly dynamic in this case. A similar situation was found for the complex
1-Br (Figures S52-S54) except that the complex fluorescence is
weaker with a shorter lifetime of approximately 7 ns. In the case of the iodide (Figures S60-S62) and thiocyanate anions (Figure S68-S70) the behaviour is different since there is a much larger drop in initial intensity accompanying the shortening of the decay. The quenching is thus much more pronounced. In all cases it appears that there is both static and dynamic quenching but to a different extent depending on the nature of the anion. For the smaller ones (Cl- and Br-), the dynamic quenching
is more pronounced than the static one and the final complexes are weakly fluorescent. However, for the larger ones (I- and SCN-)
the static quenching plays an important role. This could indicate that in the ground state the tetrazine–anion interaction is stronger with the larger more polarizable anions as expected for anion-π interactions leading to a more pronounced static quenching. When in the excited state, the tetrazine is strongly electron attractor and interact with all anions leading to dynamic quenching.
Conclusion
In summary, we have designed a new approach towards anion recognition. Our approach takes not only benefit on the joint presence of an urea and a tetrazine moieties as a H-bond donor and anion-π acceptor respectively. In addition, the design of the molecular architecture of the anion receptor is focused on the tetrazine unit which is expected to play the dual role of anion-π acceptor and on/off fluorescence probe. Theoretical calculations enabled to foresee the complexation of anions of various geometries including chloride, bromide, iodide, thiocyanate and hexafluorophosphate and predict the interaction strength. The new receptor architecture is readily prepared in good yield through a short two-step-synthetic sequence. A complementary set of experimental techniques have been further used to accurately determine anion-receptor interactions. First, tandem mass spectroscopy studies underlined the synergistic roles of hydrogen bonding and anion-π interaction during the complexation process. Complexation was next evaluated by NMR titrations, enabling the assessment of binding constants and confirming the tendency observed by theoretical calculations. Exciting photophysical properties of this new receptor have next been exploited and UV-Visible and steady state fluorescence spectroscopies were performed. In complete agreement with NMR, photophysics confirmed the tendency in the association constants already observed. Further, time resolved fluorescence studies were realized and allowed gaining insights on the quenching mechanism. The latter appeared anion-dependent
RESEARCH ARTICLE
9
combining both static and dynamic quenching. A preponderant dynamic quenching mode seems to act for smaller spherical anions (Cl- and Br-) while the static mode accounts for larger anions consistently with ground- and excited-states properties of the tetrazine unit. Further studies combining modified receptors and other anions are under way and will be reported in due time.
Acknowledgements
We are grateful to the CNRS and the University of Versailles Saint Quentin-en-Yvelines. We thank the French Ministère de l’Enseignement Supérieur et de la Recherche for funding (R. P.). This work was also supported by the French National Research Agency under the program CHARMMMAT ANR-11-LABX-0039-grant. This work was granted access to the HPC resources of CINES under the allocation 2019-A0060810812 made by GENCI.
Keywords: anion recognition • tetrazine • anion-π •
fluorescence • mass spectroscopy
[1] L. M. Eytel, H. A. Fargher, M. M. Haley, D. W. Johnson,
Chem. Commun. 2019, 55, 5195–5206.
[2] J.-B. Kim, Korean J. Pediatr. 2014, 57, 1–18.
[3] X. Xia, S. Zhang, S. Li, L. Zhang, G. Wang, L. Zhang, J. Wang, Z. Li, Environ. Sci. Process. Impacts 2018, 20, 863– 891.
[4] H. Nakamura, Anal. Methods 2010, 2, 430–444. [5] Z. Zhang, P. R. Schreiner, Chem. Soc. Rev. 2009, 38,
1187–1198.
[6] N. Mittal, D. X. Sun, D. Seidel, Org. Lett. 2014, 16, 1012– 1015.
[7] T. Le, T. Courant, J. Merad, C. Allain, P. Audebert, G. Masson, J. Org. Chem. 2019, 84, 16139–16146.
[8] S. Beckendorf, S. Asmus, O. G. Mancheño, ChemCatChem
2012, 4, 926–936.
[9] T. L. Mako, J. M. Racicot, M. Levine, Chem. Rev. 2019,
119, 322–477.
[10] P. Gamez, Inorg. Chem. Front. 2014, 1, 35–43.
[11] G. Cavallo, P. Metrangolo, R. Milani, T. Pilati, A. Priimagi, G. Resnati, G. Terraneo, Chem. Rev. 2016, 116, 2478– 2601.
[12] M. Mascal, I. Yakovlev, E. B. Nikitin, J. C. Fettinger, Angew.
Chemie - Int. Ed. 2007, 46, 8782–8784.
[13] Y. Z. Liu, K. Yuan, L. L. Lv, Y. C. Zhu, Z. Yuan, J. Phys.
Chem. A 2015, 119, 5842–5852.
[14] W. L. Huang, X. D. Wang, S. Li, R. Zhang, Y. F. Ao, J. Tang, Q. Q. Wang, D. X. Wang, J. Org. Chem. 2019, 84, 8859–8869.
[15] A. S. Mahadevi, G. N. Sastry, Chem. Rev. 2016, 116, 2775–2825.
[16] P. Audebert, F. Miomandre, G. Clavier, M. C. Verniéres, S. Badré, R. Méallet-Renault, Chem. - A Eur. J. 2005, 11, 5667–5673.
[17] G. Clavier, P. Audebert, Chem. Rev. 2010, 110, 3299– 3314.
[18] Y. H. Gong, F. Miomandre, R. Méallet-Renault, S. Badré, L. Galmiche, J. Tang, P. Audebert, G. Clavier, European J.
Org. Chem. 2009, 2009, 6121–6128.
[19] I. Janowska, F. Miomandre, G. Clavier, P. Audebert, J. Zakrzewski, H. T. Khuyen, I. Ledoux-Rak, J. Phys. Chem. A
2006, 110, 12971–12975.
[20] H. Boufroura, S. Poyer, A. Gaucher, C. Huin, J. Y. Salpin, G. Clavier, D. Prim, Chem. - A Eur. J. 2018, 24, 8656– 8663.
[21] O. Colin, H. Boufroura, C. Thomassigny, S. Perato, A. Gaucher, J. Marrot, D. Prim, European J. Org. Chem. 2017,
2017, 746–752.
[22] M. Savastano, C. Bazzicalupi, C. Giorgi, C. García-Gallarín,
M. D. López De La Torre, F. Pichierri, A. Bianchi, M. Melguizo, Inorg. Chem. 2016, 55, 8013–8024.
[23] M. Savastano, C. García-Gallarín, M. D. López de la Torre, C. Bazzicalupi, A. Bianchi, M. Melguizo, Coord. Chem. Rev.
2019, 397, 112–137.
[24] M. J. Frisch, G. W. Trucks, H. B. Schlegel, G. E. Scuseria, M. A. Robb, J. R. Cheeseman, G. Scalmani, V. Barone, B. Mennucci, G. A. Petersson, et al., Gaussian 09, Revis.
B.01, Gaussian, Inc., Wallingford CT 2009.
[25] A. Austin, G. A. Petersson, M. J. Frisch, F. J. Dobek, G. Scalmani, K. Throssell, in J. Chem. Theory Comput., American Chemical Society, 2012, pp. 4989–5007. [26] J. Contreras-García, E. R. Johnson, S. Keinan, R.
Chaudret, J. P. Piquemal, D. N. Beratan, W. Yang, J.
Chem. Theory Comput. 2011, 7, 625–632.
[27] Henry S. Rzepa, “Script for creating an NCI surface as a JVXL compressed file from a (Gaussian) cube of total electron density,” can be found under
https://www.ch.ic.ac.uk/rzepa/cub2nci/, 2013.
[28] B. P. Pritchard, D. Altarawy, B. Didier, T. D. Gibson, T. L. Windus, J. Chem. Inf. Model. 2019, 59, 4814–4820. [29] R. D. J. Gless, S. K. Anandan, Soluble Epoxide Hydrolase
Inhibitors, 2008, WO 2008/116145 A2.
[30] Y. H. Gong, P. Audebert, G. Clavier, F. Miomandre, J. Tang, S. Badré, R. Méallet-Renault, E. Naidus, New J.
Chem. 2008, 32, 1235–1242.
[31] P. J. Linstrom, W. G. Mallard, NIST Chemistry WebBook,
NIST Standard Reference Database Number 69, National
Institute of Standards and Technology, Gaithersburg MD, 20899, 1997.
[32] G. González-Gaitano, G. Tardajos, J. Chem. Educ. 2004,
81, 270–274.
[33] C. Würth, M. Grabolle, J. Pauli, M. Spieles, U. Resch-Genger, Nat. Protoc. 2013, 8, 1535–1550.
[34] A. P. De Silva, H. Q. N. Gunaratne, T. Gunnlaugsson, A. J. M. Huxley, C. P. McCoy, J. T. Rademacher, T. E. Rice,
Chem. Rev. 1997, 97, 1515–1566.
[35] B. Valeur, M. N. Berberan-Santos, Molecular Fluorescence:
Principles and Applications, Second Edition, Wiley-VCH,
RESEARCH ARTICLE
10
Entry for the Table of Contents
Detection AND recognition: on the prominent dual role of tetrazine in anion- / H-bond based anion receptors. The rational design and complexation properties of a new molecular platform combining tetrazine and urea patterns are reported. Binding constants have been predicted by DFT calculations and cross-determined by a complementary set of experimental techniques taking benefits from the joint presence of tetrazine and urea units.
1
Supporting Information
©Wiley-VCH 2019
69451 Weinheim, Germany
Intertwined detection and recognition roles of tetrazine in
synergistic anion-π and H-bond based anion receptor
Romain Plais,
[a]Guy Gouarin,
[a]Anne Gaucher,
[a]Violette Haldys,
[b],[c]Arnaud Brosseau,
[d]Gilles
Clavier,
[d]Jean-Yves Salpin,
[b],[c]Damien Prim*
[a]Abstract: The intrinsic properties of tetrazine as a p-anion receptor and as an on/off recognition probe merged with H-bond ability of an urea motif into a single architecture designs a new generation of well-defined anion receptors. Complexation properties directly benefit from the dual and synergistic contribution of tetrazine and urea. In this study, we report on the synthesis and assessment of binding properties to anions of diverse geometries. Association constants have been predicted by theoretical calculations and evaluated by multiple and complementary experimental techniques including electrospray-mass tandem spectroscopy, NMR, UV-Visible, steady state fluorescence spectroscopies and time resolved fluorescence. These results provide the basis for a better understanding of both the complexation and the anion-dependent quenching mechanism.
[a] Mr. R. Plais, Mr. G. Gouarin, Dr. A. Gaucher, Prof. Dr. D. Prim Université Paris-Saclay, UVSQ, CNRS, ILV, 78035 Versailles, France E-mail: damien.prim@uvsq.fr
[b] Mme. V. Haldys, Dr. J.-Y. Salpin
Université Paris-Saclay, Univ Evry CNRS, LAMBE, 91025 Evry-Courcouronnes, France [c] Mme. V. Haldys, Dr. J.-Y. Salpin
CYU Paris Cergy Université, CNRS, LAMBE, 95000, Cergy, France [d] Mr. A Brosseau, Dr. G. Clavier
2
Table of contents
1. General procedures, Material and Instrumentation ... 5
1.1 General experimental procedures and Materials ... 5
1.2 Instrumentation ... 5
1.3 Molecular modelling and software ... 6
2. Computational Data of 1, anions and 1-anion complexes ... 7
2.1 Coordinates and thermodynamic data ... 7
2.2 Calculation of interaction energies ... 21
3. Synthetic Procedures and Characterization Data ... 22
3.1 Preparation of 1-(3,5-bis(trifluoromethyl)phenyl)-3-(2-hydroxyethyl)urea S1 ... 22
3.2 Preparation of 1-(3,5-bis(trifluoromethyl)phenyl)-3-(2-((6-chloro-1,2,4,5-tetrazin-3-yl)oxy)ethyl)urea 1 ... 25
3.3 Preparation of 1-(3,5-bis(trifluoromethyl)phenyl)-3-(2-methoxyethyl)urea 2... 31
4. Mass spectrometry experiments ... 34
4.1 Typical electrospray spectra obtained for the 1:1 (1)/TBABr mixture ... 35
4.2 Typical electrospray spectra obtained for the 1:1 (1)/TBAI mixture ... 36
4.3 Typical electrospray spectra obtained for the 1:1 (1)/TBASCN mixture ... 37
4.4 Typical electrospray spectra obtained for the 1:1 (1)/TBAPF6 mixture ... 38
4.5 Fragmentation mechanisms associated to Scheme 3 ... 39
5. NMR Titrations ... 41
5.1 Practical analysis procedure ... 41
5.2 Titration of 1 with TBACl ... 42
5.3 Titration of 2 with TBACl ... 45
5.4 Titration of 1 with TBABr ... 47
5.5 Titration of 1 with TBAI ... 49
5.6 Titration of 1 with TBASCN ... 52
5.7 Superposition of experimental curves ... 54
6. Photophysical analysis and procedures ... 55
6.1 General practical analysis procedure ... 55
6.2 Determination of quantum yield of 1 ... 55
6.3 Time dependant DFT analysis of 1 ... 56
6.4 Titration of 1 with TBACl ... 59
6.5 Titration of 1 with TBABr ... 64
6.6 Titration of 1 with TBAI ... 69
6.7 Titration of 1 with TBASCN ... 74
7. References ... 79
3
Table of illustrations
Figure S1 : General procedure for Synthesis of 1 and 2 ... 22
Figure S2:1H NMR (300 MHz) spectrum of S1 in MeOD... 23
Figure S3: 13C NMR (75 MHz) spectrum of S1 in MeOD ... 24
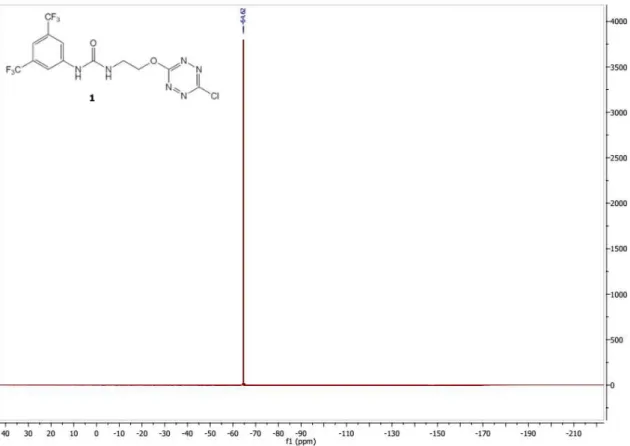
Figure S4: 19F NMR (282 MHz) spectrum of 1 in MeOD ... 24
Figure S5: Mass spectrum of S1 (TOF ES+) ... 25
Figure S6: 1H NMR (300 MHz) spectrum of 1 in MeOD ... 26
Figure S7: 13C NMR (75 MHz) spectrum of 1 in MeOD ... 27
Figure S8: 19F NMR (300 MHz) spectrum of 1 in MeOD ... 27
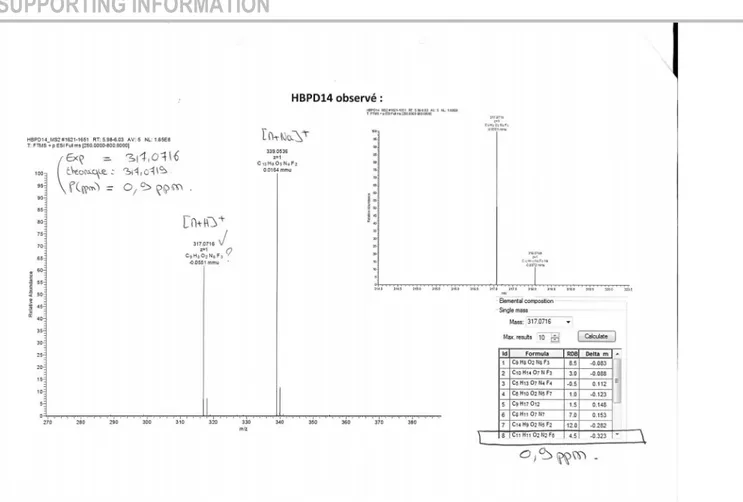
Figure S9: Mass spectrum of 1 (TOF ES+) ... 29
Figure S10: Single mass analysis of 1 (TOF ES+) ... 31
Figure S11: 1H NMR (300 MHz) spectrum of 2 in Acetone d6 ... 31
Figure S12: 13C NMR (75 MHz) spectrum of 2 in Acetone d6 ... 32
Figure S13: 19F NMR (300 MHz) spectrum of 2 in Acetone d6 ... 33
Figure S14: Mass spectrum of 2 (TOF ES+) ... 33
Figure S15: Single mass analysis of 2 (TOF ES+) ... 34
Figure S16: Typical electrospray spectra obtained for the 1:1 1/TBABr mixture a) Electrospray mass spectrum of an equimolar (10-4 M) mixture of 1/TBABr (90/10 acetonitrile/water) b) MS/MS spectrum of the [(1)-Br]- ion– c) MS/MS spectrum of the [(1) 2-Br]- ion ... 35
Figure S17: Typical electrospray spectra obtained for the 1:1 1/TBAI mixture a) Electrospray mass spectrum of an equimolar (10-4 M) mixture of 1/TBAI (90/10 acetonitrile/water) b) MS/MS spectrum of the [(1)-I]- ion– c) MS/MS spectrum of the [(1) 2-I]- ion ... 36
Figure S18: Typical electrospray spectra obtained for the 1:1 1/TBASCN mixture a) Electrospray mass spectrum of an equimolar (10-4 M) mixture of 1/TBASCN (90/10 acetonitrile/water) b) MS/MS spectrum of the [(1)-SCN]- ion– c) MS/MS spectrum of the [(1) 2 -SCN]- ion ... 37
Figure S19: Typical electrospray spectra obtained for the 1:1 1/TBAPF6 mixture a) Electrospray mass spectrum of an equimolar (10 -4 M) mixture of 1/TBAPF 6 (90/10 acetonitrile/water) b) MS/MS spectrum of the [(1)-PF6]- ion– c) MS/MS spectrum of the [(1)2-PF6]- ion ... 38
Figure S20: 1H NMR titration of 1 with tetrabutylammonium chloride (0 to 25 equivalents) %c = percentage of complex %a = percentage of free receptor ∆δcalc = chemical shift calculated ∆δobs = chemical shift observed ... 43
Figure S21: Determination of binding constant using SPECFIT software for the 1H NMR titration of 1 with tetrabutylammonium chloride ... 44
Figure S22: 1H NMR titration of 2 with tetrabutylammonium chloride (0 to 25 equivalents) %c = percentage of complex %a = percentage of free receptor ∆δcalc = chemical shift calculated ∆δobs = chemical shift observed ... 46
Figure S23: Determination of binding constant using SPECFIT software for the 1H NMR titration of 2 with tetrabutylammonium chloride ... 47
Figure S24: 1H NMR titration of 1 with tetrabutylammonium bromide (0 to 26 equivalents) %c = percentage of complex %a = percentage of free receptor ∆δcalc = chemical shift calculated ∆δobs = chemical shift observed ... 47
Figure S25: Determination of binding constant using SPECFIT software for the 1H NMR titration of 1 with tetrabutylammonium bromide ... 49
Figure S26: 1H NMR titration of 1 with tetrabutylammonium iodide (0 to 114 equivalents) %c = percentage of complex %a = percentage of free receptor ∆δcalc = chemical shift calculated ∆δobs = chemical shift observed ... 50
Figure S27: Determination of binding constant using SPECFIT software for the 1H NMR titration of 1 with tetrabutylammonium iodide ... 51
Figure S28: 1H NMR titration of 1 with tetrabutylammonium thioisocyanate (0 to 320 equivalents) %c = percentage of complex %a = percentage of free receptor ∆δcalc = chemical shift calculated ∆δobs = chemical shift observed ... 52
Figure S29 : Determination of binding constant using SPECFIT software for the 1H NMR titration of 1 with tetrabutylammonium thioisocyanate ... 53
Figure S30 – Differences in chemical shifts observed as a function of the number of equivalents of salts added protons a, b and c for 1 and 2 with tetrabutylammonium chloride ... 54
Figure S31 – Differences in chemical shifts observed as a function of the number of equivalents of salts added protons b and c ... 54
Figure S32 – Emission curves of compound 1 and reference in reference conditions ... 56
Figure S33 – Compounds studied by time dependent DFT analysis ... 56
Figure S34 – Experimental (blue) and calculated (orange) absorption spectra ... 57
Figure S35 - Calculated transitions (major transitions in bold) ... 57
4
Figure S37 – Experimental UV-Visible spectrum of 1 and attribution of different bands observed ... 58 Figure S38 – Experimental Fluorescence spectrum of 1 ... 59 Figure S39 – Experimental UV-Visible spectra measured during the titration of 1 with TBACl (0 to 70 equivalents) ... 59 Figure S40 : Determination of binding constant using SPECFIT software for the UV-Visible titration of 1 with tetrabutylammonium chloride ... 60 Figure S41 – Experimental fluorescence spectra during the titration of 1 with TBACl (0 to 70 equivalents) ... 61 Figure S42 – Mathematical fit during the fluorescence titration of 1 with TBACl (0 to 70 equivalents) and determination of the
association constant ... 62 Figure S43: Determination of binding constant using SPECFIT software for the fluorescence titration of 1 with tetrabutylammonium chloride ... 63 Figure S44 –Fluorescence decay titration of 1 with TBACl (0 to 70 equivalents) Logarithmic scale ... 63 Figure S45 –Mathematical fit during the fluorescence decay titration of 1 with TBACl (0 to 70 equivalents) and determination of the association constant ... 64 Figure S46 –Analysis of fluorescence decay titration of 1 with TBACl ... 64 Figure S47 – Experimental UV-Visible spectra measured during the titration of 1 with TBABr (0 to 160 equivalents) ... 65 Figure S48 – Determination of binding constant using SPECFIT software for the UV-Visible titration of 1 with tetrabutylammonium bromide ... 66 Figure S49 – Experimental fluorescence spectra during the titration of 1 with TBABr (0 to 160 equivalents) ... 66 Figure S50 – Mathematical fit during the fluorescence titration of 1 with TBABr (0 to 160 equivalents) and determination of the association constant ... 67 Figure S51: Determination of binding constant using SPECFIT software for the fluorescence titration of 1 with tetrabutylammonium bromide ... 68 Figure S52 –Fluorescence decay titration of 1 with tetrabutylammonium bromide (0 to 160 equivalents) Logarithmic scale ... 68 Figure S53 –Mathematical fit during the fluorescence decay titration of 1 with TBABr (0 to 160 equivalents) and determination of the association constant ... 69 Figure S54 –Analysis of fluorescence decay titration of 1 with tetrabutylammonium bromide ... 69 Figure S55 – Experimental UV-Visible spectra measured during the titration of 1 with TBAI (0 to 200 equivalents) ... 70 Figure S56 – Determination of binding constant using SPECFIT software for the UV-Visible titration of 1 with tetrabutylammonium iodide ... 71 Figure S57 – Experimental fluorescence spectra during the titration of 1 with TBAI (0 to 200 equivalents) ... 71 Figure S58 – Mathematical fit during the fluorescence titration of 1 with TBAI (0 to 200 equivalents) and determination of the
association constant ... 72 Figure S59: Determination of binding constant using SPECFIT software for the fluorescence titration of 1 with tetrabutylammonium iodide ... 73 Figure S60 – Fluorescence decay titration of 1 with tetrabutylammonium iodide (0 to 200 equivalents) Logarithmic scale ... 73 Figure S61 –Mathematical fit during the fluorescence decay titration of 1 with TBAI (0 to 200 equivalents) and determination of the association constant ... 73 Figure S62 –Analysis of fluorescence decay titration of 1 with tetrabutylammonium iodide ... 74 Figure S63 – Experimental UV-Visible spectra measured during the titration of 1 with TBASCN (0 to 300 equivalents) ... 74 Figure S64 – Determination of binding constant using SPECFIT software for the UV-Visible titration of 1 with tetrabutylammonium thiocyanate ... 75 Figure S57 – Experimental fluorescence spectra during the titration of 1 with TBASCN (0 to 300 equivalents)... 76 Figure S66 – Mathematical fit during the fluorescence titration of 1 with TBASCN (0 to 300 equivalents) and determination of the association constant ... 76 Figure S67: Determination of binding constant using SPECFIT software for the fluorescence titration of 1 with tetrabutylammonium thiocyanate ... 77 Figure S68 –Fluorescence decay titration of 1 with tetrabutylammonium thiocyanate (0 to 300 equivalents) Logarithmic scale ... 78 Figure S69 –Mathematical fit during the fluorescence decay titration of 1 with TBASCN (0 to 300 equivalents) and determination of the association constant ... 78 Figure S70 –Analysis of fluorescence decay titration of 1 with tetrabutylammonium thiocyanate ... 79
5
1. General procedures, Material and Instrumentation
1.1 General experimental procedures and Materials
Unless otherwise noted, all starting materials were obtained from commercial suppliers and used without purification. N,N-Dimethylformamide (100mL, Anhydrous, 99.8%) was purchased at Sigma-Aldrich. Dichloromethane was distilled over Sodium and under argon. For NMR titrations, deuterated acetonitrile (99.80% D) was purchased in 0.75mL precoated bulbs from Eurisotop®. For photophysical analysis, acetonitrile RS –SPECTROSOL – For optical spectroscopy was purchased from Carlo Erba®.
Reaction progress was carried out using pre-coated TLC sheets ALUGRAM® Xtra SIL G/UV254 (0.20mm) from Macherey-Nagel® and
visualized under 254 and 365 nm UV lamp from Fisher Bioblock Scientific®. Flash chromatography were proceeded using Silica 60M (0.04-0.063mm) for column chromatography silica gel from Macherey-Nagel®.
1.2 Instrumentation
1H NMR spectra were recorded with Bruker AV-I 300MHz spectrometer at 298K, referenced to TMS signal and were calibrated using
residual proton in MeOD (δ=3.31ppm), according to the literature. [1] 19F NMR spectra were recorded with Bruker AV-I 300MHz
spectrometer at 282MHz and 298K and were calibrated using CFCl3 (δ=0.00ppm). [2] 13C NMR spectra were recorded with a Bruker
AV-I 300MHz spectrometer at 75MHz and 298 K and were calibrated using MeOD (δ = 49.00 ppm). [1]1H NMR spectroscopic data are
reported as follow: chemical shift δ [parts per million] (multiplicity, coupling constants in Hertz, integration). Multiplicities are reported as follow: s = singlet, d = doublet, t = triplet, q = quadruplet, quint = quintuplet, sext = sextuplet, hept = heptuplet, dd = doublet of doublet, td = triplet of doublet, tt = triplet of triplet, ddd = doublet of doublet of doublet, m = multiplet. 13C NMR spectroscopic data are reported
in terms of chemical shifts δ [ppm] and when it is necessary multiplicity and coupling constant in Hertz.
To check the structure of the product obtained during the synthesis, high resolution mass spectra (HRMS) were obtained with a Waters Xevo QTOF instrument fitted with an electrospray ionization source (ESI+), using Leucine Enkephaline solution as internal calibrant. In order to study the interaction of 1 with the various anions, a 3D ion trap instrument (Bruker Amazon Speed ETD) has been used. Complexes were generated in the gas phase by electrospraying equimolar mixtures of 1/TBAX. Starting from 10-1M stock solutions of
1 and TBAX prepared in acetonitrile (ACN) and purified water, respectively, 10-4 M mixtures of 1/TBAX (90/10 ACN/H
2O) were
introduced in the electrospray source by a syringe pump (3 µL/min). Typical experimental conditions were as followed: Capillary voltage: 4000 V; End plate offset : -550 V; Dry gas: 5 L/min / Dry gas temperature: 200 °C, Nebuliser gas : 7.3 PSI ; Cap exit: -140 ; Trap Drive 49.5 ; MS analysis : ICC mode : “on” and acquisition time : auto.
MS/MS analysis : ICC mode off / accumulation time 1 ms / Isolation window 6 or 8 Da / Fragmentation delay 40 ms / amplitude 0.20-0.50.
UV-Visible spectra were recorded at 25°C on a Cary 400 (Agilent) double-beam spectrometer using a 10 mm path quartz cell. Emission spectra were measured on a Fluoromax-3 (Horiba) or a Fluorolog-3 (Horiba) spectrofluorometer. An angle configuration of 90° was used. Optical density of the samples was checked to be less than 0.1 to avoid reabsorption artifacts.
Fluorescence decay curves in the ns regime were obtained by the time-correlated single-photon counting (TCSPC) method with a femtosecond laser excitation composed of a Titanium Sapphire laser (Tsunami, Spectra-Physics) pumped by a double Nd:YV04 laser (Millennia Xs, Spectra Physics). Light pulses at 990 nm from the oscillator were selected by an acousto-optic crystal at a repetition rate of 4 MHz, and then tripled at 330 nm by non-linear crystals. Fluorescence photons were detected at 90° through a monochromator and a polarizer at magic angle by means of a Hamamatsu MCP R3809U photomultiplier, connected to a SPC-630 TCSPC module from Becker & Hickl. The instrumental response function was recorded before each decay measurement with a fwhm (full width at half-maximum) of ~25 ps.
6
1.3 Molecular modelling and software
All calculations were carried out using Gaussian 09® program:Gaussian 09, Revision D.01, M. J. Frisch, G. W. Trucks, H. B. Schlegel, G. E. Scuseria, M. A. Robb, J. R. Cheeseman, G. Scalmani, V. Barone, B. Mennucci, G. A. Petersson, H. Nakatsuji, M. Caricato, X. Li, H. P. Hratchian, A. F. Izmaylov, J. Bloino, G. Zheng, J. L. Sonnenberg, M. Hada, M. Ehara, K. Toyota, R. Fukuda, J. Hasegawa, M. Ishida, T. Nakajima, Y. Honda, O. Kitao, H. Nakai, T. Vreven, J. A. Montgomery, Jr., J. E. Peralta, F. Ogliaro, M. Bearpark, J. J. Heyd, E. Brothers, K. N. Kudin, V. N. Staroverov, T. Keith, R. Kobayashi, J. Normand, K. Raghavachari, A. Rendell, J. C. Burant, S. S. Iyengar, J. Tomasi, M. Cossi, N. Rega, J. M. Millam, M. Klene, J. E. Knox, J. B. Cross, V. Bakken, C. Adamo, J. Jaramillo, R. Gomperts, R. E. Stratmann, O. Yazyev, A. J. Austin, R. Cammi, C. Pomelli, J. W. Ochterski, R. L. Martin, K. Morokuma, V. G. Zakrzewski, G. A. Voth, P. Salvador, J. J. Dannenberg, S. Dapprich, A. D. Daniels, O. Farkas, J. B. Foresman, J. V. Ortiz, J. Cioslowski, and D. J. Fox, Gaussian, Inc., Wallingford CT, 2013.
Computed structures were preoptimized with a MM2 forcefield using Chem3D®. Then, optimizations were calculated at APFD/6-31G+(d,p) calculation level using Gaussian® software without any solvent correction. For the complex including bromide and iodide ions, a double basis set composed of APFD/6-31G+(d,p) for carbon, nitrogen, hydrogen, fluoride, oxygen, chloride and LANL2DZ for bromide or iodine, respectively, was used. Stationary points were verified by a harmonic vibrational frequencies calculation. None of the predicated geometry has any imaginary frequency implying that the optimized geometry of each of the molecules under study lay at a minimum local point on the potential energy surface.
Effect of solvent (acetonitrile) on geometries was evaluated by proceeding optimizations calculations at APFD/6-31G+(d,p) by adding the Polarizable Continuum Model (PCM) using the integral equation formalism variant (IEFPCM). Once again, stationary points were verified by a harmonic vibrational frequencies calculation. None of the predicated geometry has any imaginary frequency implying that the optimized geometry of each of the molecules under study lay at a minimum local point on the potential energy surface.
Gibbs free energies without solvent effect were calculated by generating frequencies calculations from optimized geometries of anions, receptor and complexes with and without anions using the triple zeta basis set APFD/aug-cc-pvtz level of calculation. Basis sets of bromide and iodide atoms at aug-cc-pvtz level of calculation were downloaded on basissetexchange.org.
Effect of solvent (acetonitrile) on Gibbs Free Energies was evaluated by generating frequencies calculations from optimized structures of anions, receptor and complexes with and without anions using the triple zeta basis set APFD/aug-cc-pvtz level of calculation. Basis sets of bromide and iodide atoms at aug-cc-pvtz level of calculation were downloaded on basissetexchange.org.
Theoretical UV-Visible spectra were calculated on optimized geometries structures in vacuum by an energy calculation using time dependant DFT calculation at TDpbe0/6-311+g(d,p)//b3lyp/6-31+g(d) level and solving on 12 first singlet states. When specified, a standard solvation model for acetonitrile was used.
Electrostatic Potentials Surfaces (ESP) were thus calculated using Gaussview® software from optimized structures in vacuum using a fine grid for Total Density and a medium grid for ESP. NCIplots were generated from total densities calculations using the script developed by Rzepa available on the website application of the Imperial College London. [3,4]
7
2. Computational Data of 1, anions and 1-anion complexes
2.1 Coordinates and thermodynamic data
Electronic energies reported afterwards are defined as the sum of electronic and zero-point energies calculated from Gaussian software. All energies, unless precised, are expressed in Hartrees.
1 APFD/6-31+G(d,p)
Charge: 0 Spin Multiplicity: Singlet Imaginary frequencies: 0
Electronic Energy (ZPE correction): -2037.491528 Hartree Symbol X Y Z s C -3.56056400 1.34585500 -0.29396900 C -4.72867300 0.78309600 0.21034900 C -4.73227200 -0.58346100 0.47221200 C -3.60433600 -1.36255300 0.24635200 C -2.43290700 -0.78264000 -0.25691400 C -2.41553300 0.59073300 -0.53217100 N -1.33542800 -1.62493300 -0.45076800 C -0.10047400 -1.29624200 -0.98853500 N 0.78991500 -2.34718800 -0.99041100 O 0.17982800 -0.19559100 -1.44238000 C 2.13363100 -2.13909100 -1.48648300 C 2.99423000 -1.38971600 -0.47904700 O 4.29347700 -1.28321600 -1.07897700 C 5.23612000 -0.64688300 -0.40573600 N 6.42006900 -0.57932400 -1.04667600 N 7.38307700 0.04694500 -0.43416700 C 7.11156000 0.56432100 0.77453200 N 5.95398900 0.48266000 1.41962000 N 4.97501800 -0.14861800 0.80687900 Cl 8.39097600 1.39902400 1.55817200 C -3.49490900 2.82932400 -0.55939300 F -2.83158300 3.47454500 0.42768800 F -4.71969700 3.38690600 -0.64112700 F -2.84830600 3.10599100 -1.70947900 C -5.95306800 -1.24429000 1.05666200 F -6.17644100 -2.45875400 0.50527800 F -7.06736100 -0.51118900 0.88128100 F -5.81482300 -1.44632700 2.38832500 H -5.61230000 1.38653000 0.38300000 H -3.64233000 -2.42884800 0.45949900
8
H -1.52269800 1.04907400 -0.93779000 H -1.50647000 -2.60068700 -0.24990300 H 0.63586800 -3.13328500 -0.37421300 H 2.57501600 -3.11391500 -1.71613600 H 2.07467400 -1.56803200 -2.41674100 H 2.59060200 -0.39192600 -0.28366600 H 3.07522600 -1.92991600 0.47169900 Cl- APFD/6-31+G(d,p) Charge: -1 Spin Multiplicity: Singlet Imaginary frequencies: 0Electronic Energy (ZPE correction): -460.149600 Hartree Frequencies calculation (vacuum)
APFD/aug-cc-pvtz
Zero-point correction= 0.000000 (Hartree/Particle) Thermal correction to Energy= 0.001416 Thermal correction to Enthalpy= 0.002360 Thermal correction to Gibbs Free Energy= -0.015023 Sum of electronic and zero-point Energies= -460.184512
Sum of electronic and thermal Energies= -460.183096 Sum of electronic and thermal Enthalpies= -460.182151 Sum of electronic and thermal Free Energies= -460.199535
Frequencies calculation (IEFPCM, Acetonitrile) APFD/aug-cc-pvtz scrf=(iefpcm,solvent=acetonitrile)
Zero-point correction= 0.000000 (Hartree/Particle) Thermal correction to Energy= 0.001416 Thermal correction to Enthalpy= 0.002360 Thermal correction to Gibbs Free Energy= -0.015023 Sum of electronic and zero-point Energies= -460.293942
Sum of electronic and thermal Energies= -460.292526 Sum of electronic and thermal Enthalpies= -460.291582 Sum of electronic and thermal Free Energies= -460.308965
Br-
APFD/6-31+G(d,p) Charge: -1 Spin Multiplicity: Singlet Imaginary frequencies: 0
Electronic Energy (ZPE correction): -2571.803183 Hartree Frequencies calculation (vacuum)
APFD/aug-cc-pvtz
Zero-point correction= 0.000000 (Hartree/Particle) Thermal correction to Energy= 0.001416 Thermal correction to Enthalpy= 0.002360 Thermal correction to Gibbs Free Energy= -0.016176 Sum of electronic and zero-point Energies= -416.970349
Sum of electronic and thermal Energies= -416.968933 Sum of electronic and thermal Enthalpies= -416.967989 Sum of electronic and thermal Free Energies= -416.986525
Frequencies calculation (IEFPCM, Acetonitrile) APFD/aug-cc-pvtz scrf=(iefpcm,solvent=acetonitrile)
Zero-point correction= 0.000000 (Hartree/Particle) Thermal correction to Energy= 0.001416 Thermal correction to Enthalpy= 0.002360 Thermal correction to Gibbs Free Energy= -0.016176 Sum of electronic and zero-point Energies= -417.072485
Sum of electronic and thermal Energies= -417.071068 Sum of electronic and thermal Enthalpies= -417.070124 Sum of electronic and thermal Free Energies= -417.088660
I
-APFD/LANL2DZ Charge: -1 Spin Multiplicity: Singlet Imaginary frequencies: 0
Electronic Energy (ZPE correction): -11.483295 Hartree Frequencies calculation (vacuum)
APFD/aug-cc-pvtz
Zero-point correction= 0.000000 (Hartree/Particle) Thermal correction to Energy= 0.001416 Thermal correction to Enthalpy= 0.002360
Frequencies calculation (IEFPCM, Acetonitrile) APFD/aug-cc-pvtz scrf=(iefpcm,solvent=acetonitrile)
Zero-point correction= 0.000000 (Hartree/Particle) Thermal correction to Energy= 0.001416 Thermal correction to Enthalpy= 0.002360