HAL Id: hal-02374883
https://hal.archives-ouvertes.fr/hal-02374883
Submitted on 27 Oct 2020HAL is a multi-disciplinary open access archive for the deposit and dissemination of sci-entific research documents, whether they are pub-lished or not. The documents may come from teaching and research institutions in France or abroad, or from public or private research centers.
L’archive ouverte pluridisciplinaire HAL, est destinée au dépôt et à la diffusion de documents scientifiques de niveau recherche, publiés ou non, émanant des établissements d’enseignement et de recherche français ou étrangers, des laboratoires publics ou privés.
Supercritical fluid chromatography coupled to mass
spectrometry for lipidomics
Celine Chollet, Stéphanie Boutet-Mercey, Laurent Laboureur, Carlos Rincon,
Marie Méjean, Juliette Jouhet, Francois Fenaille, Benoit Colsch, David
Touboul
To cite this version:
Celine Chollet, Stéphanie Boutet-Mercey, Laurent Laboureur, Carlos Rincon, Marie Méjean, et al.. Supercritical fluid chromatography coupled to mass spectrometry for lipidomics. Journal of Mass Spectrometry, Wiley-Blackwell, 2019, 54 (10), pp.791-801. �10.1002/jms.4445�. �hal-02374883�
Supercritical fluid chromatography coupled to mass
1
spectrometry for lipidomics
2 3
Céline Chollet,1,2 Stéphanie Boutet-Mercey,1,3 Laboureur Laurent,1 Carlos Rincon,1 Marie
4
Méjean,1 Juliette Jouhet,4 François Fenaille,2 Benoit Colsch,2 David Touboul.1,*
5 6
Affiliations : 7
1 Institut de Chimie des Substances Naturelles, CNRS UPR2301, Université Paris-Sud,
8
Université Paris-Saclay, Avenue de la Terrasse, 91190 Gif-sur-Yvette, France. 9
2 Service de Pharmacologie et Immuno-Analyse (SPI), Laboratoire d'Etude du Métabolisme
10
des Médicaments, CEA, INRA, Université Paris Saclay, MetaboHUB, F-91191 Gif-sur-Yvette, 11
France. 12
3 Institut Jean-Pierre Bourgin, INRA, AgroParisTech, CNRS, Université Paris-Saclay,
13
Versailles, France. 14
4 Univ. Grenoble Alpes, CNRS, INRA, CEA, IRIG - LPCV, 38000 Grenoble, France
15
* Corresponding author: David Touboul, david.touboul@cnrs.fr, Tel: +33 1 69 82 30 32 16
17
Abstract 18
Supercritical fluid chromatography (SFC) has experienced a particular revival in recent years 19
thanks to the development of robust and efficient commercial systems. Due to its physico-20
chemical properties, supercritical carbon dioxide (CO2) mixed with co-solvents and additives
21
is particularly suitable for SFC to allow the elution of compounds of different polarity, and more 22
particularly complex lipids. Hyphenation with mass spectrometry (MS) is increasingly 23
described in the literature but still requires many further developments in order to be as user-24
friendly as coupling with liquid chromatography. The basic concepts of SFC and MS 25
hyphenation will be first considered. Then a representative example of method development 26
in lipidomics will be introduced. In conclusion, the challenges and future needs in this field of 27
research will be discussed. 28
29 30 31
Introduction 1
2
Lipids can be defined as a set of hydrophobic biomolecules with extremely varied physico-3
chemical structures and properties that play multiple biological functions in living organisms. 4
They are an important energy source for organisms and accomplish essential functions in cell 5
compartmentalization and signaling.1 However, all of their functions are still not fully known
6
and understood. In human health, lipids are scrutinized for the discovery of biomarkers of 7
pathologies. Indeed, alterations or variations in the concentration of lipids are indicative of 8
dysfunctions in the body that may be linked to pathologies, such as cancer, autoimmune 9
diseases, diabetes and inherited metabolic diseases.2,3 In the field of renewable energies, the
10
ability of certain algae to accumulate high levels of some particular lipid species can be 11
exploited for the production of biofuels.4
12 13
Over the last two decades, technical progress in the development of analytical methods, 14
combined with the growing interest in lipids, has led to a broad development of lipidomic 15
studies. 5,6 The great diversity of lipids in terms of structure and physico-chemical properties
16
as well as a very wide concentration range (pg/g to mg/g of dried tissue) make it difficult to 17
simultaneously separate, detect and annotate all lipid signals in complex biological matrices. 18
The most common chromatographic technique used for lipid analysis is high performance 19
liquid chromatography (HPLC) in normal phase (NPLC) or reverse phase (RPLC). In RPLC, 20
lipids are separated by molecular species according to their polarity depending on the polar 21
head, carbon chain lengths, the number of unsaturations and the presence of hydroxylations 22
and methylations. This method leads to the elution of many lipids of different classes in a 23
reduced chromatographic space that can induce significant ion suppression phenomena. In 24
addition, this chromatographic mode is not compatible with the injection of organic solvents 25
such as chloroform or hexane requiring an extra sample preparation step (drying and 26
resuspension in alcohol). In the opposite, NPLC allows separation by lipid class and is 27
compatible with organic solvent for injection. Nevertheless, the analysis is time consuming 28
(about 30 minutes) and require the use of toxic organic eluents. Gas chromatography (GC) 29
remains mainly focused on fatty acid analysis after saponification of complex lipids and 30
methylation of free fatty acids. 31
32
The recent improvement of chromatographic technology based on the use of 33
subcritical/supercritical fluids is of increasing interest to lipidomics research groups.7 Indeed,
34
supercritical fluid chromatography (SFC) is considered a hybrid of GC and LC, and has many 35
advantages, such as high separation efficiency, low organic solvent consumption and short 36
analysis time, up to 4 times when comparing LC and SFC with the same column parameters 37
(internal diameter, length and particle size), required for high-throughput screening.8 It is
1
particularly well suited for the analysis of low-polarity compounds, such as lipids, because 2
supercritical CO2 is an non-polar solvent, often compared to hexane.9 With some adaptations,
3
which will be described hereafter, SFC can be coupled with mass spectrometry (MS) 4
techniques, providing high mass resolution, mass accuracy and tandem MS in particular, to 5
allow efficient separation and annotation of complex lipid mixtures. 6
7
History and principles of SFC 8
9
Nowadays, carbon dioxide (CO2) is by far the most widely used supercritical fluid as a mobile
10
phase in SFC. It is the only fluid for which commercial chromatography systems are available 11
today. The discovery of CO2 in the supercritical phase dates back to 1822 by Baron Charles
12
Cagniard de la Tour (1777-1859), who introduced his work to the “Académie des Sciences” in 13
1823.10 Andrews first described this state as "critical" in 1869 when he determined the critical
14
pressure and temperature (31°C and 74 bar) of CO2.11
15 16
These two values are fully compatible with pumps and columns conventionally used in LC. 17
Supercritical CO2 displays the advantage of not being toxic to humans at low concentrations,
18
of being chemically inert towards most chemical compounds, non-flammable, odourless and 19
inexpensive. It is also UV transparent as low as 190 nm, allowing the hyphenation with UV 20
detectors using high-pressure cells. The only limitation could be its low solvation power, similar 21
to hexane.12 Nevertheless, this limitation is mitigated by the miscibility of supercritical CO 2 with
22
the majority of organic solvents (alcohols, acetonitrile). It is therefore possible to modify its 23
solvation power by forming binary CO2/solvent mixtures. The first chromatographic separation
24
using a supercritical fluid as a mobile phase is attributed to Klesper et al. in 1962.13 The mobile
25
phase then consisted of a halogenated alkane and the stationary phase of polyethylene glycol. 26
27
In its early days, SFC was considered as an extension of gas chromatography (GC). The 28
authors describe it as a chromatography using a dense gas phase allowing the study of 29
thermolabile compounds. The use of a restrictor provided the necessary pressures in the 30
chromatographic columns. Since then, two types of chromatographic columns coexisted until 31
the late 1990s: capillary and packed columns. 32
33
The capillary SFC (cSFC) used capillary or "open tubular" columns derived from GC 34
columns.14 They consisted of a fused silica capillary with an internal diameter of 50 μm and a
35
stationary phase film on the wall. High pressure was maintained using a restrictor at the outlet 36
of the chromatographic column. The instrumentation was similar to that used in GC, notably 37
for detection using a flame ionization detector (FID). The FID was perfectly suited when using 1
pure CO2 since it does not provide a FID signal. However, FID is incompatible with mobile
2
phases consisting of a binary mixture (CO2/polar modifier) since the polar modifier leads to a
3
high FID signal. Until the early 1990s, cSFC was the most widespread SFC technique. The 4
use of CO2 at low flow rates (a few mL/min) also allowed coupling to mass spectrometry.
5
However, cSFC shows long analysis times and low column efficiencies compared to GC with 6
the same column.15 This type of column is now very uncommon in SFC since all commercial
7
systems use packed columns. 8
9
The packed-SFC consists of the use of packed columns and reflects the fact that the SFC can 10
also be considered as the extension of liquid chromatography. In 1983, Hewlett-Packard 11
launched the first commercial SFC system. This system is directly based on a commercial 12
HPLC system. The use of packed columns increases the interaction surfaces with the 13
stationary phase and reduces dead volumes.16 Due to the low viscosity of supercritical fluids
14
(Table 1), the pressure drops in the system are lower than in LC. It is therefore technically 15
possible to increase the flow rate of the mobile phase without the risk of reaching the 16
instrumental limits. Moreover, considering the high diffusion coefficient value, this increase in 17
flow rate has no impact on the quality of the separations. These properties often lead to flow 18
rates that are 3 times higher in SFC than LC, but at the same time, a lower organic solvent 19
consumption since most of the mobile phase is composed of CO2. As in LC, the mobile phase
20
can be made up of a binary mixture: a co-solvent (or polar modifier) is added to the CO2 in
21
order to modulate the elution strength of the mobile phase.17 In practice, the most commonly
22
encountered co-solvent is ethanol since it allows a high modulation of elution strength, is 23
available in analytical grade, is inexpensive and bears a relative low toxicity. Other solvents 24
such as methanol, isopropanol and less frequently acetonitrile are also used. This strategy 25
allows the study of more polar compounds and extends the scope of the SFC, particularly to 26
pharmaceutical compounds.18 However, when the compounds studied are polar, the mobile
27
phase composed of a binary mixture no longer reaches satisfactory chromatographic 28
performance. The obtained peaks are then extremely deformed. Figure 1 shows an example 29
from which the addition of ammonium acetate at a concentration of 15 mmol/L in the co-solvent 30
significantly improved peak shape. The most common additives are acetic and formic acids, 31
ammonium acetate or formate, and water. It should be noticed here that water is considered 32
as an additive and not a co-solvent. Indeed, since water and CO2 are not miscible, only a few
33
percent (1 to 5 %) of water can be added to the co-solvent.19 Additives can act in different
34
ways. For example, they can avoid ionization (by modifying the pH), interact with active sites 35
of the stationary phase or form ion pairs with charged analytes.20 These additives can
36
sometimes significantly modify the stationary phase and thus modify the characteristics of a 37
column. When coupling to mass spectrometry, the additive must be carefully chosen not to 1
interfere with the ionization of analytes or pollute the analyzers. Amines (isopropylamine, 2
dimethylamine, triethylamine), quaternary amine salts and trifluoroacetic acid should be thus 3
avoided. 4
5
Given the compressibility of the mobile phase, a back pressure regulator (BPR) is required to 6
maintain the mobile phase pressurized through the system. This regulator is an automated 7
valve that imposes pressure at the outlet of the column regardless of the flow rate through it. 8
Although very important when pure CO2 is used as a mobile phase, the value of the back
9
pressure generally shows a weak influence when a binary mobile phase is used. Effects on 10
retention are minimal and those on selectivity are almost non-existent. To maximize the 11
chances of observing effects, it is necessary to make changes with relatively large steps (at 12
least 20 bar). 13
14
There is no ideal and universal stationary phase chemistry in SFC. However, the choice of the 15
stationary phase can be based on the work of Lesellier's group.21 They propose a classification
16
by studying the retention factors (k) obtained when separating a mixture of 109 molecular 17
compounds under identical chromatographic conditions (except the stationary phase 18
chemistry). This classification is based on column characterization via quantitative structure-19
retention relationships (QSRRs). 20
The equation to be solved for each column is as follows: 21
𝑙𝑜𝑔𝑘=𝑐C+𝑒𝐸+𝑠𝑆+𝑎𝐴+𝑏𝐵+𝑣𝑉+𝑑-𝐷-+𝑑+𝐷+
22
Upper-case letters are variables corresponding to each compound. Lower-case letters are the 23
constants to be determined for each column. c is the intercept term for the model. E is linked 24
to the refractive index of the analyte, S to the polarity/apolarity of the analyte, A and B to the 25
acid and basic characteristics of the hydrogen bonds, V is the McGowan volume, D+
26
represents the charges carried by a cation and D- those carried by an anion.22
27
Initially the D terms were not included in the original model.23 This resulted in poor
28
classification when ionic or zwitterionic species were considered. However, the calculation of 29
these constants causes problems since it requires knowledge of both pH and pKa in situ. 30
Indeed, the pKa of an analyte depends on its environment and is not measurable in SFC. 31
Similarly, the pH of the mobile phase is difficult to measure experimentally. West et al. propose 32
the use of colored indicators and estimate the "apparent aqueous" pH of the mobile phase 33
CO2/MeOH (with or without basic additives) to be between 2 and 8 and close to 1 when using
34
acid additives.24 A double approximation was therefore agreed by the authors: use a pH value
35
equal to 525 and the pKa obtained in aqueous solution. The final results are presented in the
36
form of a spider diagram where each axis corresponds to a constant (Figure 2). Although very 37
useful to get an idea of columns with similar or orthogonal selectivities, this classification can 1
show some limitations, especially when using additives or a co-solvent significantly different 2
from an alcohol.26 For these reasons, each new project starts with a column screening in our
3
laboratory. 4
5
Currently, the range of commercial equipments is quite limited. Indeed, almost all authors in 6
the literature use UPC² system (Waters) or Infinity 1260 SFC system (Agilent Technologies). 7
It should be noted that other manufacturers sell analytical SFC systems (Shimadzu, Pic 8
Solution or Jasco). All these systems use chromatographic columns with geometries similar 9
to liquid chromatography (Figure 3). These systems are based on the knowledge and 10
experience of ultra-high performance liquid chromatography (UHPLC) manufacturers since 11
they operate at pressures comparable to SFC. The commercialization of these reliable and 12
robust systems has enabled SFC to find its place alongside LC and GC in the world of 13 analytical chemistry. 14 15 SFC-MS hyphenation 16 17
Mass spectrometry is the most widely used detection system for lipidomics studies. The 18
coupling of SFC with MS is highly valuable because it combines the efficiency and speed of 19
the SFC separation with the contribution of the high sensitivity and specificity of MS detection. 20
Atmospheric pressure sources such as electrospray (ESI), atmospheric pressure 21
photoionization (APPI) and atmospheric pressure chemical ionization (APCI) are well suited 22
for coupling with SFC and allow the analysis of compounds with different polarities.27,28,29,30 All
23
mass analyzers can be coupled to the SFC, and the choice will depend on the study issue: 24
low-resolution analyzers, such as the quadrupole, only provide access to the nominal mass of 25
the compound, while high-resolution analyzers, such as Orbitrap or Time-of-Flight (TOF) 26
analyzers, provide access to the accurate mass of the ions. In the case of studies of complex 27
biological environments, the use of high-resolution mass spectrometry (HRMS) is most often 28
necessary for untargeted profiling whereas triple quadrupoles are required for targeted 29
quantitative approaches. 30
31
The coupling of atmospheric pressure ionization sources with SFC is significantly more 32
challenging than with LC. Although the properties of the supercritical fluid are favorable for 33
nebulization, its expansion at the outlet of the column results in poor solvation of the solutes. 34
The latter may then precipitate into the transfer capillary to the ionization source. To avoid this 35
problem and facilitate the ionization of the compounds, a solvent, called a "make-up" solvent, 36
is added using an isocratic pump and a "T" or "Y" type fitting. The choice of this solvent 37
depends on the nature of the compounds to be analyzed and must be optimized in order to 1
increase the solubility of the components and promote their ionization. For this purpose, it is 2
possible to test any type of solvent and additives, ensuring that they are miscible with the 3
mobile phase and compatible with the ionization source. The addition of a make-up solvent is 4
required for lipid quantifications for better repeatability. Finally, in order to avoid the 5
condensation of CO2 during its expansion, a module called "caloratherm", consisting of a
6
heated sheath whose temperature is regulated to a chosen value, is placed just before the 7
source. 8
9
Several types of interfaces were reviewed and compared by Pinkston first in 2005,18 then by
10
Grand-Guillaume Perrenoud et al. in 2014.31 Very recently, Tarafder published a review of the
11
different solutions proposed for coupling SFC to MS (Figure 4), and their effects on dispersion 12
and chromatographic resolution.32
13 14
Two configurations are currently operated for coupling with a mass spectrometer: either the 15
coupling takes place after the back pressure regulator BPR, and in this case all the 16
chromatographic effluent is injected into the ionization source, or it can be done before the 17
BPR, using a split system. Although the first configuration (Figure 4d) allows to obtain a good 18
sensitivity, BPR generates important dead volumes which induce a consequent loss of 19
chromatographic efficiency. The introduction of the split system makes it possible to minimize 20
dead volumes (Figure 4e-f). Even if only a part of the sample is introduced, the effects of 21
dilution would be compensated by thinner chromatographic peaks. In addition, the possibility 22
of adding make-up solvent after BPR has also been described in the literature. 23
24
Few systematic studies have compared the ionization efficiency of ESI, APCI and APPI 25
sources in coupling with SFC. Méjean et al. reported that the APPI source is significantly more 26
sensitive and robust than ESI and APCI for the quantification of tocopherols and tocotrienols 27
in edible oils.27 To obtain the best ionization conditions, all voltage and gas pressure
28
parameters must be carefully optimized. In this sense, Duval et al. published an extensive 29
study on the influence of different source parameters in APCI for the detection and 30
quantification of lipids in vegetable oils.33,34 Since no liquid phase reaches the ion source but
31
rather a disperse phase in CO2, APCI and APPI sources often display the best performance
32
in terms of sensitivity and robustness. 33
34
Targeted and untargeted lipidomics 35
Lipidomic studies can be designed according to two approaches, i.e. targeted or untargeted 1
studies. The first aims to extract, enrich and quantify specific lipids from a complex matrix. The 2
second consists of the least selective extraction and large-scale profiling methods of all 3
molecular species present in the sample. Both approaches are well suited to lipidomics 4
because of the wide dynamic range of concentration and the high structural diversity of lipids 5
in tissues, biological fluids or other samples of interest. 6
7
Targeted lipidomics methods in SFC-MS have been focused on several classes such as free 8
fatty acids (C18 column, methanol/acetonitrile (50:50, v/v) with 0.1% formic acid)35 or vitamin
9
E derivatives in vegetable oils (NH2 column, pure ethanol),27 carotenoids in human plasma
10
(C30 column, pure methanol), eicosanoids in human plasma and cerebrospinal fluid (2-11
picolamine column, MeOH with 0.1% formic acid and 10 mM of ammonium acetate),36 steroids
12
(2-ethylpyridine column, pure isopropanol),37 environmental toxins as acetogenins
(2-13
ethylpyridine column, pure ethanol).28 These examples perfectly demonstrate the diversity of
14
stationary phase and co-solvent that are described in the literature and which contrast strongly 15
with HPLC studies that lead mainly to the use of C18 columns and water/acetonitrile gradients. 16
17
For profiling of complex lipid mixtures, the studies mainly focused on animal and human 18
plasma lipid extracts. It is indeed a good model and a rapid access route to biomedical 19
applications for treatment monitoring or pathology biomarker research. T. Bamba's group has 20
been a pioneer in this field by demonstrating the class separation of a total lipid extract of 21
Madagascar Periwinkle by SFC-ESI-MS.38 The authors use a mixture of 14 lipid standards to
22
develop their method. The final chromatographic method requires a cyano column (250 mm x 23
4.6 mm x 5 µm) and employs methanol with 0.1% ammonium formate as co-solvent. The 24
gradient was programmed over 20 minutes without taking into account rinsing and 25
equilibration times. Several co-elutions were observed, including between phosphatidic acids 26
(PA), phosphotidylethanolamines (PE) and phosphotidylinositols (PI) as well as between 27
phosphatidylserines (PS), phosphatidylcholines (PC) and sphingomyelins (SM). Limits of 28
detection (LODs) were in the range of 60 pmol (PC) to 15,000 pmol (PI) injected. An Inertsil 29
ODS-EP column (250mm x 4.6mm x 5 mm, GL Sciences) was then chosen in 2011 for the 30
separation of ten polar lipid classes after Trimethylsilyl (TMS) derivatization in 10 minutes.39
31
This method led to symmetrical and thin chromatographic peaks, but the derivatization step 32
remains time consuming. Nevertheless, the sensitivity was greatly improved with LODs in the 33
range of 5 (sphingosine-1-phosphate, S1P) to 300 fmol (PA) injected and the method was 34
successfully tested on sheep plasma. The initial underivatized method was then improved in 35
2012 by using a PC-HILIC column for the separation of polar lipids (PC, PE, SM) from dried 36
plasma spot analysis40 and in 2018 by a diethylamine (DEA) column and a co-solvent
methanol/water (95/5, v/v) with 0.1% formic acid for wide profiling of rabbit plasma lipids.41
1
Nineteen lipid classes were detected in less than 20 minutes and 413 species were annotated 2
and semi-quantified according to MS/MS data with limits of quantification (LOQs) from 5 (PC) 3
to 1000 fmol (lysoPA). 4
M. Holcapek's group also demonstrated the separation of 30 lipid classes from 6 families of 5
lipids (fatty acyles, phospholipids, glycerolipids, sphingolipids, sterols and derivatives, prenols) 6
in less than 6 minutes with a stationary phase BEH silica column (100 mm x 3 mm x 1.7 µm, 7
Waters) and a co-solvent methanol-water mixture (99:1, v/v) containing 30 mM of ammonium 8
acetate.42 By injecting a lipid extract from pig brain, the authors controlled the separation by
9
class by observing ion chromatograms extracted from several species belonging to the same 10
lipid class. 11
Tests with a similar stationary phase were conducted in our team for the analysis of microalgae 12
extracts but led to the co-elution of glycolipids of interest (monogalactosyldiacylglycerol 13
(MGDG), digalactosyldiacylglycerol (DGDG), diacylglyceryltrimethylhomoserine (DGTS) and 14
sulfoquinovosyl diacylglycerol (SQDG)) with sphingolipids and phospholipids. This 15
observation led us to start a classic method development as briefly described below. 16
17
Method development 18
19
The set-up available in our laboratory is based on a 1260 Infinity Analytical SFC system 20
hyphenated to a 6540 Q-ToF mass spectrometer (Agilent Technologies, Waldbronn, 21
Germany). A make-up solvent is added between the analytical column and the BPR. The 22
chromatographic flow is then directly introduced to the mass spectrometer through a capillary 23
(500 x 0.17 mm). As previously described by the group of Bamba,41 we chose a Torus-DEA
24
column (150 mm x 2.1 mm x 1.7 µm) for the method development. The lipid extract of 25
Nannochloropsis gaditana microalgae was provided by J. Jouhet (CEA Grenoble). It was
26
prepared according to the following protocol: the cells were collected by centrifugation and 27
immediately frozen in liquid nitrogen. The pellets were suspended in 4mL of ethanol and boiled 28
for 5 minutes to prevent the degradation by phospholipases. Lipid extraction was then 29
performed by adding 10mL of chloroform/methanol mixture (4:1, v/v) at room temperature. 30
The solution obtained was shaken for 1 hour at room temperature under argon to avoid any 31
oxidation. After filtration on quartz wool filter, the cells were rinsed with 3mL of 32
chloroform/methanol mixture (2:1, v/v) and 5 mL of 1% NaCl was added to obtain two phases. 33
The lower phase was sampled and dried under argon. A 1 mg.mL-1 stock solution was
34
prepared in a chloroform/methanol mixture (2/1, v/v) by weighting the extract and was diluted 35
twice before injection. 36
A generic gradient ranging from 1 to 35% of ethanol was tested in the first approach. This 1
method allows a partial separation of cholesteryl esters with triglycerides, 1,2- and 1,3-2
diglycerides and polar lipids except SQDG. In order to optimize the separation, a 3 min plateau 3
with 15% co-solvent was implemented at 2.5 min elution time allowing a separation with 4
baseline resolution of the different lipid classes. Finally, the percentage of co-solvent at the 5
end of the gradient was increased to 45% allowing the elution of SQDGs and PI which are the 6
most polar species in the mixture. This led to a total time of the SFC run of 20 min including 7
equilibration time. In order to optimize the performance of the SFC-ESI-MS coupling, a set-up 8
with or without split was evaluated by comparing the full widths at half height of the major 9
peaks of the main classes and their peak intensities (Figure S1). The split set-up allows 10
significant refinement of peaks without loss of sensitivity or even a gain, except for the DGs. 11
The final method leads to peaks with a full width at half height between 4 and 6 seconds 12
(Figure 5). 13
Once the separation dimension has been optimized, it is necessary to ensure the detection of 14
as many species as possible, whatever their polarity and ionizability. In order to ensure the 15
transfer of analytes to the ESI source of the mass spectrometer and to facilitate their ionization, 16
a make-up solvent is therefore added. After optimizing the solvent composition, we chose to 17
use MeOH/EtOH 1:1 (v/v) as the solvent make-up mixture. We added various additives, such 18
as ammonium acetate at 20 mM, water at 2% (v/v) or formic acid at 0.1% and 0.5% (v/v). Six 19
"make-up" solvents were tested at 3 different flow rates (100, 200, and 400 μL.min-1)
20
monitoring the response of one major species per lipid class (Figure S2). For all additives, the 21
compounds that are eluted at the beginning of the gradient are better ionized with a flow rate 22
of 200 μL.min-1, while the compounds that are most retained are better detected with a lower
23
flow rate of 100 μL.min-1. In addition, the sensitivity is increased for all lipid classes in positive
24
and negative ionization mode when 20 mM of ammonium acetate are added in the make-up 25
solvent. In that case, ammonium adducts in positive ion mode and acetate adducts in the 26
negative ion mode were mainly detected. Such ionization process led to a better sensitivity for 27
PC in the negative ion mode even if the molecule bears a permanent positive charge on a 28
quaternary ammonium group. Thus the make-up pump will deliver a mixture of MeOH/EtOH 29
1:1 (v/v) + 20 mM ammonium acetate at 200 μL.min-1 from 0 to 6 minutes, then 100 μL.min-1
30
from 7 to 19 minutes. It should be noted that the change of the make-up flow during the 31
analysis was not described in the literature and should be compared to the LC-CAD set-up 32
that allows the same solvent composition arriving at the detector to be maintained throughout 33
the analysis. 34
35
Finally, the gas temperatures, the voltages applied to the ESI probe and at the fragmentor 36
were optimized in positive and negative ionization mode leading to sensitivities in the order of 37
10 pg/mg of extracts. A mass spectrum extracted between 0.87 min and 1.79 min is used to 1
annotate up to 34 triglycerides (Figure 6). It should be noted that within the same lipid class, 2
a partial separation of molecular species is demonstrated according to the number of carbons 3
of the fatty chains (Figure S3). 4
5
Future Developments 6
7
Although the coupling between supercritical fluid chromatography and mass spectrometry has 8
been demonstrated for more than ten years, this technology still faces many challenges in 9
becoming a universal technique like LC-MS. The choice of a large number of stationary 10
phases can be considered as a particularly attractive aspect for carrying out analytical studies 11
but often discourages new users and can be judged as a waste of time and efficiency in an 12
analytical platform context requiring simple and robust methods. Thus, the stationary 2-13
ethylpyridine phase is often viewed as a versatile phase in the literature but is not widely used 14
in the context of lipidomics as previously described. The arrival of new stationary phases 15
based on highly basic material nevertheless opens the way to the gradual removal of additives, 16
i.e. ammonium salts in particular, which require fairly long equilibration and rinsing times for
17
the columns. In the context of lipidomics, it should be noted that the use of chiral stationary 18
phases is rarely described in the literature and deserves particular attention, especially for the 19
separation of arachidonic acid derivatives (leukotriens, prostaglandins, thromboxanes, etc.). 20
The SFC-MS interface itself still requires further improvements to eliminate peak expansion 21
or molecule condensation phenomena leading to significant sensitivity losses. Nowadays, 22
SFC-MS is still considered less sensitive than LC-MS by one to two orders of magnitude. 23
Nowadays, APCI and APPI sources, although less popular than ESI sources, appear to be 24
the most suitable for analyzing effluent arriving at the source in the form of a pneumatic spray 25
by expanding CO2 at atmospheric pressure. It is recommended to set up designed
26
experiments to determine the optimal ionization parameters during method development, 27
especially for targeted approaches where trace quantification may be required. As an inter-28
laboratory study was undertaken in SFC-UV,43 it would be extremely attractive to carry out the
29
same work with different SFC-MS platforms. 30
Concerning lipidomics studies in SFC-MS, the pioneering works of T. Bamba and M. 31
Holcapeck have paved the way for applications in biology, cosmetics or biofuels. The cost of 32
instrumentation and the time required to optimize methods remain a barrier to the 33
dissemination of these methods, which have the advantage of being efficient in terms of 34
separation, fast with analysis times of 20 minutes compared to more than 45 minutes in NPLC 35
for lipid separation by class, and sensitive. Conditions for high-throughput screening are now 36
met and SFC-MS studies should be expanded in this direction. In addition, the adaptation of 37
modern methods for MS/MS annotation of lipids by post-column cationization,28 method for
1
labelling double bonds via the Paternò-Büchi reaction44 or the use of molecular networks for
2
data classification45 have yet to be developed in the near future.
3 4 5
Acknowledgements 6
This work was supported by the Agence Nationale de la Recherche (Grant ANR-16-CE29-7
0002-01 CAP-SFC-MS). 8
9 10
Table 1: Orders of magnitude of physical properties of solvents in different states 1
Type of fluid
Property Gas SCF Liquid
Density, r (g.cm-3) 10-3 0.3 1 Diffusivity, D (cm².s-1) 10-1 10-3 5 x 10⁻⁶ Viscosity, h (g.s.cm-1) 10-4 10-4 10-2 2 3 4
Figure 1: Effect of the addition of ammonium acetate (15 mmol.L-1) on the peak shape of polar
1
compounds. Mix of 3 isomers of methylcytidines. Column Waters Acquity UPC² Torus 2-PIC 2
(150 mm x 2.1 mm x 1.7 µm), 150 bar, 30°C; Gradient 5 to 20% of co-solvent (MeOH) in 25 3
min; Flow rate 1.5mL.min-1.
4
5 6 7
Figure 2: Spider diagram proposed by West et al.23 representing a column classification based
1
on quantitative structure-retention relationships (QSRRs). Testing conditions: CO2-MeOH
2
90:10 (v/v), 25 °C, 150 bar, 1 or 3 mL.min-1 depending on column dimension. Retention data
3
was measured for 85 neutral species with 31 columns. 4
5 6 7
Figure 3: Schematic view of Infinity 1260 SFC system (Agilent Technologies) and its 1
hyphenation with mass spectrometry.7
2 3
4 5 6
Figure 4: Schematic representation of various SFC-MS interfacing configurations.32 (a)
1
Chromatographic column is connected directly to MS through a pressure restrictor heated at 2
its end, (b) same as in (a) but here the restrictor is heated at the beginning, (c) Full flow from 3
the column is first passed through a UV detector, and then is mixed with an organic solvent 4
delivered by a fixed-pressure pump, before being expanded to MS through a restrictor, (d) 5
here flow from the column is passed through an automated back-pressure regulator (ABPR) 6
before the MS and the flow is mixed with a make-up pump flow, either before or after the 7
ABPR, (e) here a part of the outlet from the column is directed towards an MS whereas the 8
other part is taken to an ABPR passing through a UV detector, (f) in this configuration, flow 9
from the column is first passed through a UV detector, and then is mixed with an organic 10
solvent delivered by a make-up pump. A part of the mixed stream is then taken to the MS and 11
the other part to an ABPR. 12
13
14 15
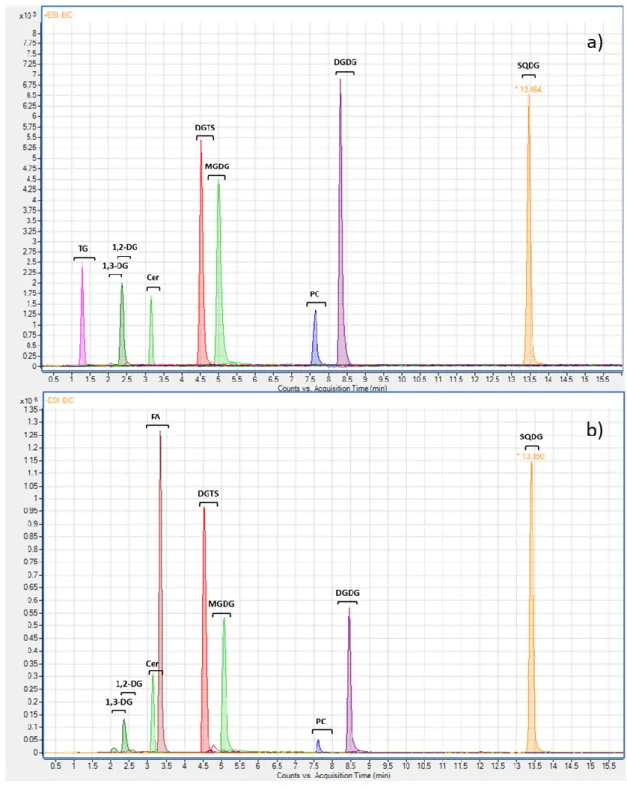
Figure 5: UHPSFC/ESI-MS extracted ion chromatogramms in positive (a) and negative (b) ion 1
mode of the major peaks of the main classes of lipid detected in the extract of Nannochloropsis 2
microalgae. UHPSFC conditions: Torus DEA column (150 × 2.1 mm, 1.7 μm, Waters), the flow 3
rate 1 mL.min-1, the column temperature 60 °C, the ABPR pressure 130 bar and the gradient
4
of methanol−ethanol mixture (1:1, v/v) containing 20 mM of ammonium acetate as the 5
modifier: 0 min, 1%; 1.5 min, 4%; 2.5 to 5.5 min, 15%; 7.5 min, 30%; 8.5 to 15 min; 45%. 6
7
8 9 10
Figure 6: a) Extracted Ion Chromatogram (EIC) of eight different triglycerides detected in the 1
extract of Nannochloropsis microalgae. b) Extracted Mass spectrum between 0.87 min and 2 1.79 min. 3 4 5 6 7
1
1 A.A. Spector, M.A. Yorek. Membrane lipid composition and cellular function. J. Lipid Res.
1985, 26(9), 1015.
2 D.J. Stephenson, L.A. Hoeferlin, C.E. Chalfant. Lipidomics in translational research and the
clinical significance of lipid-based biomarkers. Transl. Res. 2017, 189, 13.
3 F. Lamari, F. Mochel, F. Sedel, J.M. Saudubray. Disorders of phospholipids, sphingolipids
and fatty acids biosynthesis: toward a new category of inherited metabolic diseases. J. Inherit.
Metab. Dis. 2013, 36, 411.
4 A.Z. Khan, A. Shahid, H. Cheng, S. Mahboob, K.A. Al-Ghanim, M. Bilal, F. Liang, M.Z.
Nawaz. Omics Technologies for Microalgae-based Fuels and Chemicals: Challenges and Opportunities. Protein Pept. Lett. 2018, 25, 99.
5 R.W. Gross. The evolution of lipidomics through space and time. Biochim. Biophys. Acta Mol. Cell Biol. Lipids. 2017, 1862(8), 731.
6 X. Han. Lipidomics for precision medicine and metabolism: A personal view. Biochim. Biophys. Acta Mol. Cell. Biol. Lipids. 2017, 1862(8), 804.
7 L. Laboureur, M. Ollero, D. Touboul. Lipidomics by Supercritical Fluid Chromatography. Int. J. Mol. Sci. 2015, 16(6), 13868.
8 X. Zhang, X. Ding, J. Wang, B. Dean. Supercritical fluid chromatography-tandem mass spectrometry for high throughput bioanalysis of small molecules in drug discovery. J. Pharm.
Biomed. Anal. 2019, 164, 62.
9 E. Lesellier, C. West. The many faces of packed column supercritical fluid
chromatography--a critical review. J. Chromatogr. A. 2015, 1382, 2.
10 Ampère and Dulong, Rapport fait à l’Institut de France le 27 octobre 1823 sur un mémoire
de M. Cagniard de La Tour, Am. Chim. Brochure 8 (série 2), XXI p12, WVII p410, 1823.
11 T. Andrews. Philos. Trans. R. Soc. Lond., On the continuity of the gaseous and liquid states
of matter. 1869, 159, 575.
12 L. Nováková, A. Grand-Guillaume Perrenoud, I. François, C. West, E. Lesellier, D.
Guillarme. Modern analytical supercritical fluid chromatography using columns packed with sub-2 μm particles: a tutorial. Anal. Chim. Acta. 2014, 824, 18.
13 E. Klesper, A.H. Corwin, D.A. Turner. High Pressure Gas Chromatography above Critical
Temperatures. J. org. Chem. 1962, 27, 700.
14 P.A. Peaden, J.C. Fjeldsted, M.L. Lee, S.R. Springston, M. Novotny. Instrumental aspects
of capillary supercritical fluid chromatography Anal. Chem. 1982, 54, 1090.
15 M.A. Morrissey, H.M. Widmer. Ion-mobility spectrometry as a detection method for
packed-column supercritical fluid chromatography J. Chromatogr. A. 1991, 552, 551.
16 L.T. Taylor. Supercritical fluid chromatography for the 21st century J. Supercritical Fluids.
2009, 47, 566.
17 J.B. Crowther, J.D. Henion. Supercritical fluid chromatography of polar drugs using
small-particle packed columns with mass spectrometric detection. Anal. Chem. 1985, 57, 2711.
18 J.D. Pinkston. Advantages and drawbacks of popular supercritical fluid chromatography /
mass spectrometry interfacing approaches - a user’s perspective. Eur. J. Mass Spectrom. 2005, 78, 7467.
19 C. West, S. Khater, E. Lesellier. Characterization and use of hydrophilic interaction liquid
chromatography type stationary phases in supercritical fluid chromatography. J. Chromatogr.
A. 2012, 1250, 182.
20 T.A. Berger. Chromatography: supercritical fluid, theory of supercritical fluid
chromatography. Editor Ian D. Wilson, Encyclopedia of Separation Science. Academic Press. Oxford. 2007. p.1-9.
21 E. Lesellier. Overview of the retention in subcritical fluid chromatography with varied polarity
stationary phases. J. Sep. Sci. 2008, 31(8), 1238.
22 C. West, E. Lemasson, S. Bertin, P. Hennig, E. Lesellier. An improved classification of
stationary phases for ultra-high performance supercritical fluid chromatography. J.
23 C. West, E. Lesellier. A unified classification of stationary phases for packed column
supercritical fluid chromatography. J. Chromatogr. A. 2008, 1191(1-2), 21.
24 C. West, J. Melin, H. Ansouri, M. Mengue Metogo. Unravelling the effects of mobile phase
additives in supercritical fluid chromatography. Part I: Polarity and acidity of the mobile phase.
J. Chromatogr. A. 2017, 1492, 36.
25 D. Wen., S.V. Olesik. Characterization of pH in liquid mixtures of methanol/H
2O/CO2. Anal. Chem. 2000, 72, 475.
26 Snyder L.R. Classification of the solvent properties of common liquids. J. Chromatogr. 1974, 92, 230.
27 M. Méjean, A. Brunelle, D. Touboul. Quantification of tocopherols and tocotrienols in
soybean oil by supercritical-fluid chromatography coupled to high-resolution mass spectrometry. Anal. Bioanal. Chem. 2015, 407(17), 5133.
28 L. Laboureur, N. Bonneau, P. Champy, A. Brunelle, D. Touboul. Structural Characterisation
of Acetogenins from Annona muricata by Supercritical Fluid Chromatography Coupled to High-Resolution Tandem Mass Spectrometry. Phytochem. Anal. 2017, 28(6), 512.
29 L. Laboureur, V. Guérineau, S. Auxilien, S. Yoshizawa, D. Touboul. Profiling of modified
nucleosides from ribonucleic acid digestion by supercritical fluid chromatography coupled to high resolution mass spectrometry. J. Chromatogr. A. 2018, 1537, 118.
30 C. Santerre, N. Vallet, D. Touboul. Fingerprints of flower absolutes using supercritical fluid
chromatography hyphenated with high resolution mass spectrometry. J. Chromatogr. B
Analyt. Technol. Biomed. Life Sci. 2018, 1092, 1.
31 A. Grand-Guillaume Perrenoud, J.L. Veuthey, D. Guillarme. Coupling state-of-the-art
supercritical fluid chromatography and mass spectrometry : From hyphenation interface optimization to high-sensitivity analysis of pharmaceutical compounds. J. Chromatogr. A, 2014, 1339, 174.
32 A. Tarafder. Designs and methods for interfacing SFC with MS. J. Chromatogr. B, 2018, 1091, 1.
33 J. Duval, C. Colas, V. Pecher, M. Poujol, J.F. Tranchant, E. Lesellier. Hyphenation of ultra
ionisation high resolution mass spectrometry: Part 1. Study of the coupling parameters for the analysis of natural non-polar compounds. J. Chromatogr. A. 2017, 1509, 132.
34 J. Duval, C. Colas, P. Bonnet, E. Lesellier. Hyphenation of ultra-high performance
supercritical fluid chromatography with atmospheric pressure chemical ionisation high resolution mass spectrometry: Part 2. Study of chromatographic and mass spectrometry parameters for the analysis of natural non-polar compounds. J. Chromatogr. A. 2019, 1596, 199.
35 S. Qu, Z. Du, Y. Zhang. Direct detection of free fatty acids in edible oils using supercritical
fluid chromatography coupled with mass spectrometry. Food Chem. 2015, 170, 463.
36 S.J. Kumari A Ubhayasekera, S.R. Acharya, J. Bergquist. A novel, fast and sensitive
supercritical fluid chromatography-tandem mass spectrometry (SFC-MS/MS) method for analysis of arachidonic acid metabolites. Analyst 2018, 143(15), 3661.
37 J. Teubel, B. Wüst, C.G. Schipke, O. Peters, M.K. Parr. Methods in endogenous steroid
profiling - A comparison of gas chromatography mass spectrometry (GC-MS) with supercritical fluid chromatography tandem mass spectrometry (SFC-MS/MS). J. Chromatogr. A. 2018,
1554, 101.
38 T. Bamba, N. Shimonishi, A. Matsubara, K. Hirata, Y. Nakazawa, A. Kobayashi, E. Fukusaki.
High throughput and exhaustive analysis of diverse lipids by using supercritical fluid chromatography-mass spectrometry for metabolomics. J. Biosci. Bioeng. 2008, 105, 460.
39 J.W. Lee, T. Yamamoto, T. Uchikata, A. Matsubara, E. Fukusaki, T. Bamba. Development
of a polar lipid profiling method by supercritical fluid chromatography/mass spectrometry. J.
Sep. Sci. 2011, 24, 3553.
40 T. Uchikata, A. Matsubara, E. Fukusaki, T. Bamba. High-throughput phospholipid profiling
system based on supercritical fluid extraction-supercritical fluid chromatography/mass spectrometry for dried plasma spot analysis. J. Chromatogr. A. 2012, 1250, 69.
41 H. Takeda, Y. Izumi, M. Takahashi, T. Paxton, S. Tamura, T. Koike, Y. Yu, N. Kato, K.
Nagase, M. Shiomi, T. Bamba. Widely-targeted quantitative lipidomics method by supercritical fluid chromatography triple quadrupole mass spectrometry. J. Lipid Res. 2018, 59(7), 1283.
42 M. Lisa, M. Holcapek. High-Throughput and Comprehensive Lipidomic Analysis Using
Ultrahigh-Performance Supercritical Fluid Chromatography-Mass Spectrometry. Anal. Chem. 2015, 87, 7187.
43A. Dispas, et al. First inter-laboratory study of a Supercritical Fluid Chromatography method for the determination of pharmaceutical impurities. J. Pharm. Biomed. Anal. 2018, 161, 414.
44 X. Ma, Y. Xia. Pinpointing double bonds in lipids by Paternò-Büchi reactions and mass
spectrometry. Angew. Chem. Int. Ed. Engl. 2014, 53(10), 2592.
45 F. Olivon, N. Elie, G. Grelier, F. Roussi, M. Litaudon, D. Touboul. MetGem Software for the
Generation of Molecular Networks Based on the t-SNE Algorithm. Anal. Chem. 2018, 90(23), 13900.