HAL Id: cea-02338748
https://hal-cea.archives-ouvertes.fr/cea-02338748
Submitted on 24 Feb 2020
HAL is a multi-disciplinary open access
archive for the deposit and dissemination of
sci-entific research documents, whether they are
pub-lished or not. The documents may come from
teaching and research institutions in France or
abroad, or from public or private research centers.
L’archive ouverte pluridisciplinaire HAL, est
destinée au dépôt et à la diffusion de documents
scientifiques de niveau recherche, publiés ou non,
émanant des établissements d’enseignement et de
recherche français ou étrangers, des laboratoires
publics ou privés.
traces proficiency testing organized by CETAMA
S. Picart, M. Crozet, D. Roudil, R. Brennetot, F. Pilon
To cite this version:
S. Picart, M. Crozet, D. Roudil, R. Brennetot, F. Pilon. Inter-laboratory comparison for trace analysis:
EQRAIN traces proficiency testing organized by CETAMA. Symposium on international safeguards:
building future safeguards capabilities 2018, Nov 2018, Vienne, Austria. �cea-02338748�
INTER-LABORATORY COMPARISON FOR TRACE
ANALYSIS: EQRAIN TRACES PROFICIENCY
TESTING ORGANIZED BY CETAMA
S. PICART, M. CROZET, D. ROUDIL CEA/DEN/DMRC/CETAMA 30207 Bagnols-sur-Ceze, France Email: [email protected] R. BRENNETOT CEA/DEN/DPC/SEARS 91191 Gif-sur-Yvette, France F. PILON CEA/DAM/DMAT/SR2C 37260 Monts, France Abstract
The Commission d’Établissement des Méthodes d'Analyse (CETAMA) organises Inter-Laboratory Comparison round robins entitled “Evaluation of the Quality of Analysis Results in the Nuclear Industry”,” (EQRAIN, “Evaluation de la Qualité du Résultat d'Analyse dans l'Industrie Nucléaire”, in French). The “EQRAIN Trace Elements n° 21” inter-laboratory comparison (ILC), which was launched in the first half of 2016, concerned the elemental chemical analysis of 15 elements whose concentrations were between 0.2 and 15 mg/L. The main objective of this proficiency test was to check the quality of measurement results for the concentrations of metallic elements in a solution. It enabled the participating laboratories to evaluate their performances in carrying out this type of analysis and if they wish, to compare different analytical techniques. After the measurement results had been returned, the reference values were sent to the laboratories which were then able to estimate the bias of their measurements and to check for the absence of drift, implementing corrective actions if necessary. Inductively coupled plasma mass spectrometry (ICP-MS) and inductively coupled plasma atomic emission spectrometry (ICP-AES) are the best-adapted analytical techniques for this kind of exercise, leaving atomic absorption a complementary role and the use of colorimetry for certain special elements.
1. INTRODUCTION
One of the missions of the Analysis Method Establishment Commission (CETAMA) is to supervise the organization of Inter-Laboratory Comparisons (ILC) for the nuclear industry and for environmental or safeguards public organizations. These ILC programs are organized every year or every two years on uranium, plutonium and anions or cations; at a trace level in solution for the latter.
Notably, the EQRAIN traces ILC concerns laboratories implementing inductively coupled plasma atomic emission spectroscopy (ICP-AES) or mass spectrometry (ICP-MS) and willing to estimate the accuracy of their measurements for trace elements at concentrations between 0.1 and 15 mg/L. The challenge for the laboratories is to evaluate the performance of their methods and equipment for the determination of these elements in solution, and to meet the requirements of quality management and accreditation body.
The “target” elements are chosen by partners during working group (WG) meetings dedicated to Atomic Emission Spectroscopy (WG6) and Mass Spectrometry (WG12). The results of the ILC are presented every year during joint WG6-WG12 meetings, in which the performance scores are discussed anonymously. It also provides the opportunity to run a variance analysis on both techniques, ICP-AES and ICP-MS, for the 15 elements and to highlight evolution in their performance.
This paper will then focus on the implementation of “EQRAIN Traces N°21” proficiency testing and on the statistical treatment of the results1.
2. OBJECTIVES
Since 1987, the CETAMA has been organizing EQRAIN Traces ILC which concern the determination of 15 elements with concentrations are between 0.2 and 15 mg/L.
The ILC which is presented hereafter took place between May and September 2016, and it enabled the 30 participating laboratories to evaluate their performance in elemental chemical analysis for all or part of the 15 elements available, using the technique of their choice.
The main objective was to check the quality of elemental concentration measurement results for a solution, and to thus enable the participating laboratories to check their conformity to their quality system and to respect the requirements imposed by the related standards.
The ILC was also intended to situate the general level of performances in the main techniques and associated analytical methods currently used for multi-elemental analyses, i.e. inductively-coupled plasma mass spectrometry (ICP-MS) and inductively-coupled plasma atomic emission spectrometry (ICP-AES).
Result processing was based on the normative system in force, i.e. the ISO NF 13528 standard for the evaluation of laboratory performances and of deviations from trueness, and the ISO NF 5725 standard for the determination of method precision. Through its analytical approach, it permits not only the evaluation of the measurement techniques but also the highlighting of the difficulty of testing for certain elements.
3. TARGET ELEMENTS
The material to be analyzed was a multi-elemental solution including the following elements: Al, B, Be, Co, Fe, Gd, Li, Mo, Ni, Ru, Si, Sn, Ta, U, and Zr.
The material suppliers was SPEX-CertiPrep and the certified concentrations are given in Table 1 with the associated expanded uncertainties expressed in mg/L (for k=2).
TABLE 1. EQRAIN Traces 21 metal concentration and their expanded uncertainties.
EQRAIN21 Al B Be Co Fe Gd Li Mo Ni Ru Si Sn Ta U Zr
Xref (mg/L) 11.000 3.010 0.900 0.500 0.300 0.400 4.030 7.010 1.590 1.510 2.470 0.600 0.810 5.030 0.198
U(Xref) (mg/L) 0.060 0.020 0.005 0.003 0.002 0.002 0.020 0.040 0.008 0.008 0.010 0.003 0.004 0.030 0.001
The reference values were certified with a relative uncertainty of 2% for a period of 6 months. The 15 elements to be analyzed were decided on after discussion among the members of the Working Groups concerned, i.e. WG 06 “Atomic Absorption and Emission Spectrometry” and WG 12 “Mass Spectrometry”, early in 2016.
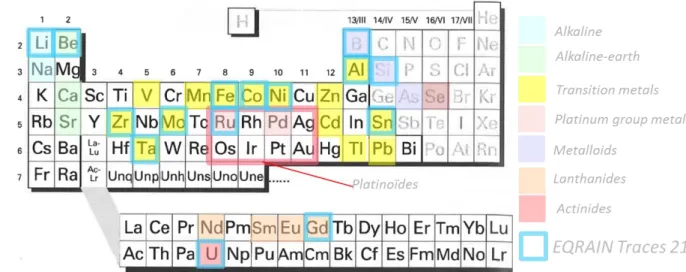
They were selected depending on the applications implemented in the main laboratories. Several families can be listed, including those inevitable for spectrometry (Fe, Mo, Ni), the alkalines and alkalino-earths (Li, Be), the elements of interest in fuel cycle processes (Al, Mo, B, Si, Zr, U, Gd) and those which are important for environmental monitoring (U, Be). This EQRAIN Traces 21 ILC also offered the analysis of 3 new impurities which are rarely proposed: Sn, Co and Ru. Thus 4 elements were excluded - As, Pd, Se, and Zn - and 4 newcomers were introduced, Co, Ru, Sn, and Ta. Uranium, an important tracer in nuclear activities, has been present in all the round robins, with a concentration range of from 0.2 to 10 mg/L. The elements selected for the EQRAIN 21 ILC are shown in the Mendeleyev Periodic Table in Figure 1.
FIG. 1. Chart showing the position of chosen elements for the EQRAIN Traces ILC in the Mendeleyev periodic table with the highlighting of the one selected for the 21st edition.
4. ILC ORGANISATION
The samples were distributed to the 30 laboratories participating, among AREVA, CEA, CNRS, EDF, EVANS ANALYTICAL, HUNGARIAN ACADEMY OF SCIENCES, IRSN, JRC KARLSRUHE, KAERI, MELOX, VALAIS. Depending on its choice of technique(s) to implement and thus the number of additional vials requested, each laboratory could send back several series of results if different techniques or different operators were involved in the tests. Thus one laboratory could be allocated several laboratory codes, and there were 64 laboratory codes in total.
The samples were sent out to the laboratories in June 2016, and the round robin was closed at the end of September that year.
Table 2 reports the number of measurements carried out for each element and for each technique. These indicate the levels of interest which the laboratories had in testing for certain elements, or may point to difficulties or specific issues involved with some techniques when testing for these elements.
TABLE 2. Counts of number of analysis per element and per element & technique. Element Measur. ICP-AES ICP-MS Autre
Al 50 36 13 1 (AA) B 49 34 15 0 Be 43 24 18 1 (AA) Co 51 32 18 1 (AA) Fe 47 36 10 1 (AA) Gd 37 24 13 0 Li 50 31 18 1 (AA) Mo 51 32 18 1(AA) Ni 57 37 19 1(AA) Ru 31 18 13 0 Si 32 28 4 0 Sn 38 21 17 0 Ta 31 18 13 0 U 40 20 19 1 (Color.) Zr 44 28 16 0
The results were presented in Pau during the plenary meetings of joint meeting WG 06 “Atomic Absorption and Emission Spectrometry” and WG 12 “Mass Spectrometry”, held 29-30 November 2016.
The result reporting formalism was imposed, but the participants were left a free choice as to the techniques they would implement.
Together with a written acknowledgement of the reception of its results, each laboratory received a number known only to itself and to the CETAMA and which served as the laboratory reference for the statistical processing and the anonymous return of the performance scores.
5. STATISTICAL PROCESSING
The results were processed following the recommendations given in the following standards NF ISO 13528: 2015 2 and - NF ISO 5725-5: 1998 3.
These standards foresee the use of calculations called “robust” for data analyses. Such calculations integrate all of the results, including those considered as outliers by the criteria of a normal law. They are based on an iterative procedure which enables the influence of extreme values to be minimized.
5.1. Measurement model
The mathematical model for a given level of concentration considers that any result from an individual measurement for a given method without method bias (true method) is the sum of 3 components (equation 1):
where
y = m+ b + e Equation 1
- m: expected value for Y; m is estimated by the reference value,
- b: bias from the laboratory, with a variance (interlaboratory variance) for which the estimation on a sample is ,
- e: random error of the sample measurement (individual), with a repeatability variance (intralaboratory variance) for which the estimation on a sample is
From the model of equation 1, the total variance of y for a sample, the reproducibility variance, , can be written as being equal to:
Equation 2
During an interlaboratory comparison, there are several laboratories carrying out their measurement replicates. Thus hereafter in this document the nomenclature applied is that given in Table 3.
TABLE 3Nomenclature used for the laboratory tests.
Symbol meaning
N = np Total number of individual measurements
n Number of replicates
p Number of laboratories
Index j : j = 1 to n Relative to the replicates Index i : i = 1 to p Relative to the laboratories
Thus each individual measurement or replicate can be written ij (equation 3):
yij = m+ bi+ eij Equation 3
where
- yij: result of the j th
replicate for laboratory i;
- m: expected value for Y; estimated by the reference value; - bi: bias due to laboratory i;
- eij: random error of the individual measurement for the jth replicate of laboratory i.
For each measurement result yij, variance is written as:
- Equation 4
5.2. Proficiency testing
In a proficiency test, each laboratory i is required to supply a result ylab_i and its associated uncertainty,
using the analysis method of its choice (Participants were recommended to carry out n = 5 independent tests). Most of the time, the result ylab_i returned is the result of the mean of ni individual measurements
carried out by laboratory i. This result therefore corresponds to the mean of ni values (replicates) of
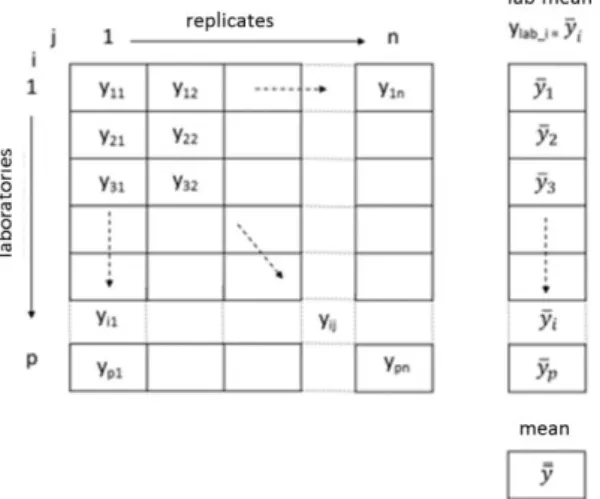
measurement ylab_i = (Equation 5 and Figure 2).
FIG. 2.
Matrix representation of the data (analysis results) for an identical number of replicates for all the laboratories.- With or ylab_i the mean of the ni replicates from laboratory i.
The general approach followed for the statistical processing of the results from a proficiency test (“proficiency testing”, with the abbreviation “pt”), according to the NF ISO 13528 standard, is structured in 3 broad steps:
- determination of the mean (robust) of the laboratory results ylab_i and of the standard deviation for the
proficiency evaluation spt,
- checking for the existence of outlier values,
- determination of the performance indicators (z score, zeta score…) for each laboratory. The main performance indicators are (equation 6), z (equation 7) and zeta (equation 9).
The difference Di between the result ylab_i and the assigned value yPt expressed in %, estimation of the
measurement bias for the laboratory concerned i, is:
%
Equation 6where
- ylab_i is the measurement result supplied by laboratory i
- ypt is the assigned value; in the case of this ILC, it is the certified reference value.
The z score, a performance indicator for the laboratory compared to all the participants without the evaluation of the estimation of its own reported uncertainty:
Equation 7
where spt is the standard deviation for the proficiency test, here the robust standard deviation (“robust” is
symbolized by *) for the laboratory measurements:
Equation 8
The zeta score, the evaluation of a participant’s proficiency in obtaining values close to the reference value with the uncertainty estimated by that laboratory:
zeta
Equation 9 where
is the standard uncertainty associated with result ylab_i supplied by laboratory i,
is the standard uncertainty associated with the assigned value for the ILC, here the standard uncertainty for the certified reference value.
This statistical processing was carried out using the commercial software SAS JMP and used a“robust” calculation algorithm called “A” described in the standards NF ISO 13528 and NF ISO 57025.
The evaluation of a laboratory’s proficiency is carried out based on the values of the z score and of the zeta score:
between – 1 and + 1 being very satisfactory;
between – 2 and -1 or between +1 and +2 being satisfactory;
between + 2 and +3 or –2 et –3 being debatable;
greater than +3 or lower than –3 being unsatisfactory.
5.3. Normalized deviation
The compatibility between the robust mean and the reference value yref , which is equal here to ypt as
given in the SPEX certificate, is represented by the normalized deviation , calculated with the following equation:
Where:
- : robust mean of all ylab-i results
- : reference value
- : robust mean uncertainty : reference value uncertainty
Interpretation of the normalized deviation:
: satisfactory results
When the normalized deviation is between -2.0 and +2.0, there is no discernible bias in the methods implemented by the laboratories.
ou : debatable results
When the normalized deviation is between -3.0 and -2.0 or +2.0 and +3.0, there is either a potential bias in the methods implemented by the laboratories, or the reference value is erroneous. The presence of a bias should be confirmed in past and future comparisons.
: unsatisfactory results
When the normalized deviation is less than -3.0 or higher than +3.0, there is a significant difference between the reference value and the mean of the laboratory means. This difference comes either from a bias in the methods implemented by the laboratories, or from an erroneous reference value. In this case, potential causes for this difference should be analyzed.
5.4. Method evaluation
The precision of the method can be appreciated by respecting the characteristic conditions described below:
– Conditions of repeatability exist when the measurements are made by the same operator, on the same instrument, using a single method and within a short period of time, in order to obtain measurements under conditions which are as similar as possible.
– Conditions of reproducibility exist when one of the following conditions of execution changes: operator, instrument, variation in the application of the method, period of execution, or any other cause which adds sources of variability.
In this type of approach, the laboratory is asked to repeat each individual measurement a certain number of times n (5 in our case), and to report each of these results yij..
The planning of such a round robin enables the method to be validated via the criteria of trueness and of precision depending on the analysis techniques used and supposing that the methods applied are equivalent.
It consists in using a variance analysis (ANOVA) to determine the standard deviations of repeatability and of reproducibility characterizing the method.
Prior to these variance analysis, outliers were excluded using the Cochran and Grubs tests because classical statistics (not robust) are used and are sensitive to outliers.
Then going back to Equations 3 and 4, model of the measurement and associated variance, and provided that the measurement results were obtained using the same method, the mean per laboratory ylab_i = can
be obtained (equation 10):
= m+ bi+ eij Equation 10
as well as its associated variance (equation 11), provided that all the laboratories made the same number of replicates ni = n:
Equation 11
In the ANOVA approach, the sum of the squares of the deviations (noted SStotal hereafter) from the
general mean consists of 2 terms (Equation 12): one corresponding to the inter-laboratory variance (noted SSinter), and the other corresponding to a residual or repeatability or intra-laboratory variance
(noted SSintra) (This is only valid for ni = n).
Equation 12 = +
SStotal = SSinter + SSintra
By dividing by their respective numbers of degrees of freedom np-1 for term , p-1 for term and p(n-1) for term , these terms correspond respectively to the total variance s2total, the inter-laboratory
variances2inter and the repeatability variance (also called intra-laboratory or residual) sr2 = sintra2.
The repeatability variance for the method sr 2
is therefore (equation 13):
Equation 13
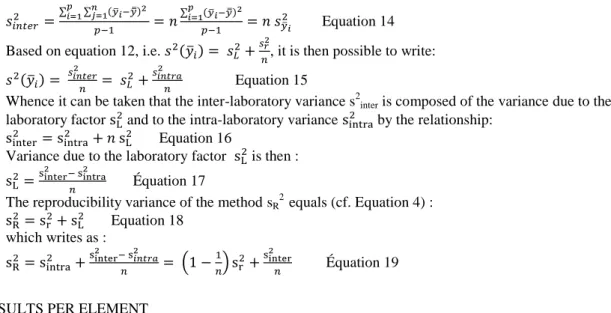
The interlaboratory variance can be expressed depending on the standard deviations of the laboratory results (means) by equation 14:
Equation 14 Based on equation 12, i.e. , it is then possible to write:
Equation 15
Whence it can be taken that the inter-laboratory variance s2inter is composed of the variance due to the
laboratory factor and to the intra-laboratory variance by the relationship: Equation 16
Variance due to the laboratory factor is then :
Équation 17
The reproducibility variance of the method sR 2 equals (cf. Equation 4) : Equation 18 which writes as : Équation 19
6. RESULTS PER ELEMENT
A first graph recapitulates the means of the laboratory results by increasing order of the relative deviations D, identified by the laboratory codes and technique (Figure 3 in the case of Al). The information includes:
- the reference value yref = ypt together with its expanded uncertainty in the form of a green line, and a
confidence interval also in green,
- the robust mean value together with twice the standard deviation for the robust mean u( ) in the form of a red line, and a confidence interval also in red.
FIG. 3. Al content analysis results for EQRAIN Traces 21 certified reference material..
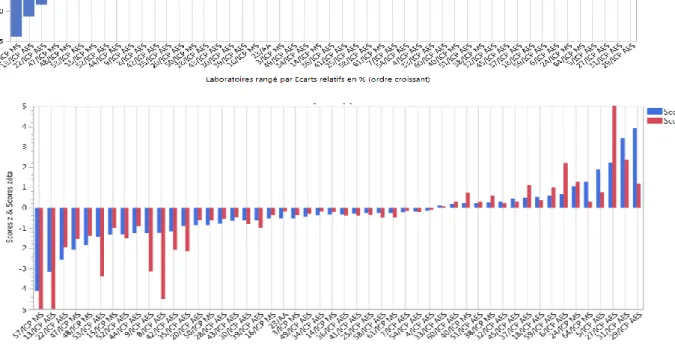
Two more graphs show the relative deviations in increasing order, depending on the laboratory codes and the z and zeta scores arranged in increasing z score order, with the same laboratory codes (Fig. 4).
FIG. 4. Graphs of relative deviation Di% and of z / zeta scores for Al content analysis ( EQRAIN Traces 21 ILC).
Next, a table summarizes per element (Table 4) the reference value yref together with its expanded
standard uncertainty U(yref), the number of laboratories for the test, all techniques together and per technique;
the robust mean and the robust standard deviation for the test in its totality s* (k=2) and for ICP-AES and ICP-MS results.
TABLE 4Summary of the mean values obtained for Al content analysis and of the normalized deviation.
Al
Eqrain Traces 21 Method n Lab.
Mean/ robust mean uncertainty (k=2) Normalized bias En Xref = (11.00 ± 0.06) mg/L (k=2) All techniques 50 (10.87 ± 0.13)mg/L -1.81 ICP-AES 36 (10.89 ± 0.15)mg/L -1.34 ICP-MS 13 (10.78 ± 0.34)mg/L -1.25
A final part discusses the ANOVA variance analysis at 1 factor (laboratory) with graphs showing the result yi (outliers omitted) compared to the arithmetical mean for each technique (Fig. 5).
z
(a) (b)
Two final tables give the calculation of the standard deviations for repeatability and for reproducibility for the ICP-AES (Table 5) and ICP-MS methods.
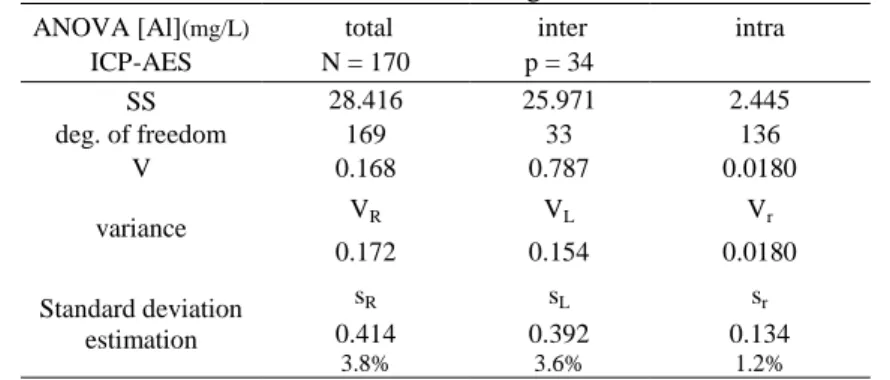
TABLE 5. ANOVA calculation for results concerning Al content and ICP-AES measurements.
ANOVA [Al](mg/L) total inter intra
ICP-AES N = 170 p = 34 SS 28.416 25.971 2.445 deg. of freedom 169 33 136 V 0.168 0.787 0.0180 variance VR VL Vr 0.172 0.154 0.0180 Standard deviation estimation sR sL sr 0.414 3.8% 0.392 3.6% 0.134 1.2%
7. SYNTHESIS OF RESULTS AND DISCUSSION
7.1. Bias analysis
En, the normalized deviations, which evaluate the compatibility between the robust means (consensual value for the proficiency test) and the reference values, are given in the following tables and figures for all the elements and for the two main techniques implemented, i.e. ICP-AES and ICP-MS.
FIG. 6. Graph of normalized deviation for the ICP-AES technique and EQRAIN Traces 21 ILC.
For the ICP-AES technique, only uranium had a borderline significant negative bias.
FIG. 7. Graph of normalized deviation for the ICP-MS technique and EQRAIN Traces 21 ILC.
For the ICP-MS method, no bias was detected.
Both ICP-AES and ICP-MS results from ILC are then consistent with the certified values of the standard and indicates that the laboratories are generally good for the implementation of both techniques and trace analysis. -4 -3 -2 -1 0 1 2 3 4 Al B Be Co Fe Gd Li Mo Ni Ru Si Sn Ta U Zr En
7.2. Performance indicators,
The z score enables an evaluation of the laboratory proficiency in giving a true result, compared to the expected uncertainties for the community taking part in the proficiency test.
The zeta score enables an estimation of the laboratory proficiency in giving a true result, compared to the uncertainties given by the laboratory combined with those of the reference.
In order to make reading the score indications easier, a common evaluation grid was adopted, as was the case for previous EQRAIN Traces ILC summaries.
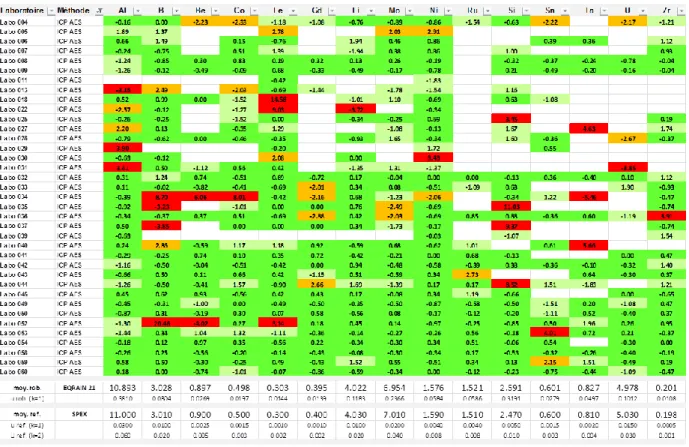
The tables drawn up for each technique include a ranking by laboratory (in lines by increasing code number) and a ranking by element (in columns by alphabetical order): the value of the score is given in the box and a colour is attributed according to the key below:
green indicates an absolute value for the z or zeta score between 0 and 1: very satisfactory result,
light green indicates an absolute value for the z or zeta score between 1 and 2: satisfactory result,
orange indicates an absolute value for the z or zeta score between 2 and 3: debatable result,.
red indicates an absolute value for the z or zeta score higher than 3: unsatisfactory result,
white means "not determined".FIG. 8. Z Score performance grid for ICP-AES technique (EQRAIN Traces 21 ILC).
A laboratory which tested the elements on its list very satisfactorily or just satisfactorily (score between 0 and 2 in absolute value) is considered to have met the test criteria, and is judged to be “satisfactory” in terms of either the z score or the zeta score.
From the score grid, it can be seen that 35% of the laboratories are "satisfactory to very satisfactory" for the ICP-AES method on the basis of the z criterion (13 laboratories out of 37), compared to 24% for the ICP-MS method (6 laboratories out of 24).
For the zeta criterion, the number of laboratories judged to be "satisfactory to very satisfactory" doubles for the ICP-MS method, going from 6 to 12, which shows that the laboratory uncertainties are well managed and enables the biases observed to be relativized.
This is unlike what can be observed for the ICP-AES method, where the number of laboratories decreases from 13 to 8, indicating that the laboratory uncertainties are sometimes underestimated for this technique.
7.3. Global analysis by element
Studying the result of the proficiency test overall, it can be seen that the relative deviations (difference between the robust mean and the reference value, in relative value) are well-managed for all of the elements and are less than or equal to 1.5%. The result dispersion is also low, less than 1%.
The only exception is the element Si, for which the bias and the dispersion are 3.4 % and 2.7% respectively. To this we can add the element Ta, whose dispersion at 1.3% is greater than 1%, as is the case for Si.
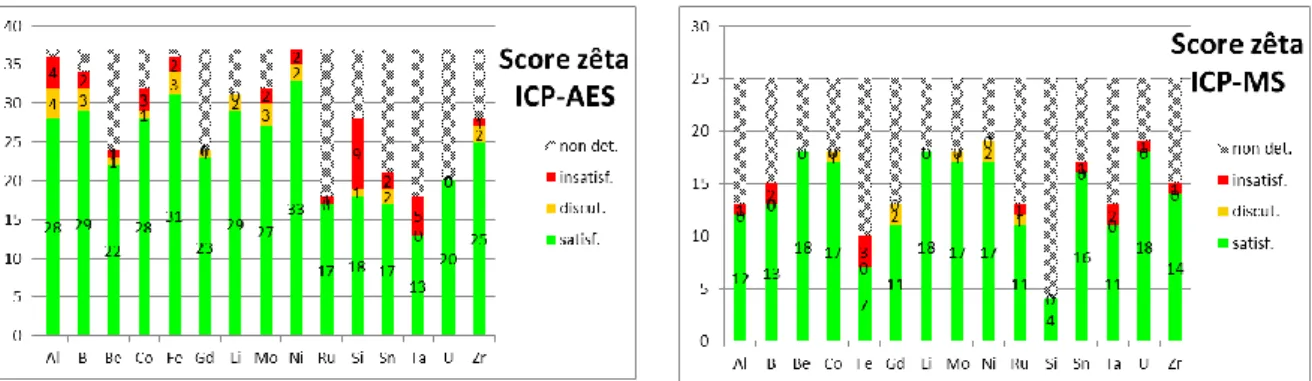
This analysis is confirmed by the graphs in Figure 9 where it can be clearly seen that there is a significant number of unsatisfactory results for silicon in terms of zeta score (9 laboratories out of 26, i.e. one laboratory out of three) with the ICP-AES method showing a strong tendency to overestimate the value. As concerns the ICP-MS method, very few analyses were reported (4), which indicates the difficulty of analyzing Si routinely by ICP-MS. The same difficulty is found for Ta, but only when using ICP-AES.
FIG. 9. Graph of satisfactory zeta score by element for ICP-AES and ICP-MS technique.
In terms of the normalized deviation, U stands out for its significant negative deviation of -2.0, as the dispersion is low (0.4%) compared to the non-negligible relative deviation (1.0%). The same remark can be made in the case of Al, with a high negative normalized deviation of 1.8 (0.6% dispersion for a deviation of -1.2%) or for Zr, with a positive normalized deviation of 1.5 (1.0% dispersion for a deviation of 1.5%).
Continuing with Figure 9, a significant number of laboratories had "debatable" and "unsatisfactory" zeta scores for the measurement of Al using ICP-AES (8 laboratories did not meet the "satisfactory" criterion), thus confirming the difficulty of measuring the Al concentration with trueness for certain laboratories.
7.4. Analysis of repeatability and reproducibility
Concerning method repeatability, the repeatability standard deviations are mainly between 0.7 and 2% for ICP-AES and between 1.5 and 3% for ICP-MS when the elements do not represent any special problems for testing. Beyond this, the parameter indicates any special technical issues, for example for Si where the repeatability standard deviation rose to 2.7% with ICP-AES, or for Al using ICP-MS, with a value of 3.7%.
For method reproducibility, the standard deviation varies between 1.6 and 5.0% for ICP-AES and between 2.6 and 7.0% for ICP-MS, meaning a value more than double that for the repeatability standard deviation. If it is outside this range, the parameter confirms the existence of an analysis issue which may be caused by spectral or mass problems (interferences) or have a chemical origin (pollution, adsorption, concentration level...): this is the case for Si using ICP-AES, where the reproducibility standard deviation reaches 12.4%. It should also be remembered that these deviations are sensitive to the concentration level, as is
the case for Zr with a reproducibility standard deviation of 3.6% for ICP-AES. This is certainly high, but it corresponds to a low Zr concentration (200 µg/L).
8. CONCLUSION AND PERSPECTIVES
The EQRAIN Traces 21 ILC enabled the 30 participating laboratories to evaluate their performances in elemental chemical analysis for a solution of 15 trace elements. There was a free choice as to the technique to implement, and some laboratories used both ICP AES and ICP MS to carry out the tests
Although mainly working in the nuclear-related field, the ILC participants are laboratories whose objectives (expertise or monitoring) as well as their fields of application (industry, research or instrumentation) are different, sometimes even opposite. The concentrations were chosen in order to to meet most of the needs in terms of trace measurement proficiency assessment. The annual frequency of EQRAIN ILCs is an opportunity to validate laboratory proficiency and to test new instruments or methods.
The statistical processing for all the results returned by the laboratories is based on the NF ISO 13528 standard and prioritizes robust methods for the calculation of trueness and for the expression of laboratory performance scores. It is also based on the ISO 5725 standard for the determination of the precision of the ICP-AES and ICP-MS methods via the evaluation of the standard deviations for repeatability and reproducibility.
These performance scores enable the laboratories to evaluate their proficiency in testing for elements at a level described as "trace", which are representative of those found in nuclear activities. They enable result trueness to be judged, as well as the realism of the reported laboratory uncertainties.
This round robin was also the opportunity to evaluate the performance of the ICP-AES and ICP-MS methods in terms of repeatability and reproducibility, for all the ILC participants. It thus enabled the laboratories to compare their individual performance with that of the group, and to examine changes to practices and methods if necessary.
The summary of this exercise shows very high quality analysis results, as attested to by the satisfactory z scores (|z|<2) for a large number of elements and laboratories. Moreover, a good number of laboratories returned excellent results, which confirms the reference values and the quality of the standards involved.
The number of laboratories registered and the distribution by technique were as follows:
30 participating laboratories, (64 laboratory codes)
37 series of results obtained with the ICP-AES technique,
25 series of results obtained with the ICP-MS technique. Atomic absorption was used once in this ILC, as was colorimetry.
The data processing involved 64 series of results 64. This shows laboratory interest in such an exercise as an evaluation tool for their know-how. The data processed concerned 656 concentration measurement results, representing more than 3000 unitary values and the associated uncertainties.
Participation in type of round robin is recommended by the ISO 17025 standard related to the competence of laboratories in carrying out tests [ISO17025]. This is particularly true for laboratories which have undertaken steps towards certification or accreditation.
Finally, during our last meeting, the idea came to organize a future ILC on trace elements contained in a uranium matrix composed of a 10 g/L uranium solution in acidic medium. The implementation of such an ILC is currently subject to a feasibility study and would be a follow-up to the proficiency test run in 2012 by CETAMA at the request of the IAEA. A total of 15 elements, between 1-100 ppm relative to uranium, would have to be analyzed, and will be chosen between alkaline, alkaline earth, transition metal, platinum metal and lanthanide groups.
REFERENCES
[1] PICART S., Technical Note, Summary of the "EQRAIN traces n°21" proficiency test by inter-laboratory comparison, internal report, CEA, DMRC/CETAMA/2017-05, 2017.
[2] NF ISO 13528, Statistical methods for use in proficiency testing by interlaboratory comparison, 2015.
[3] NF ISO 5725-2, Application of statistics - Accuracy (trueness and precision) of measurement methods and results – Basic method for the determination of repeatability and reproducibility of a standard measurement method, 1998.