HAL Id: hal-00297979
https://hal.archives-ouvertes.fr/hal-00297979
Submitted on 25 Feb 2008HAL is a multi-disciplinary open access
archive for the deposit and dissemination of sci-entific research documents, whether they are pub-lished or not. The documents may come from teaching and research institutions in France or abroad, or from public or private research centers.
L’archive ouverte pluridisciplinaire HAL, est destinée au dépôt et à la diffusion de documents scientifiques de niveau recherche, publiés ou non, émanant des établissements d’enseignement et de recherche français ou étrangers, des laboratoires publics ou privés.
Biogeochemical processes and microbial diversity of the
Gullfaks and Tommeliten methane seeps (Northern
North Sea)
G. Wegener, M. Shovitri, K. Knittel, H. Niemann, M. Hovland, A. Boetius
To cite this version:
G. Wegener, M. Shovitri, K. Knittel, H. Niemann, M. Hovland, et al.. Biogeochemical processes and microbial diversity of the Gullfaks and Tommeliten methane seeps (Northern North Sea). Biogeo-sciences Discussions, European GeoBiogeo-sciences Union, 2008, 5 (1), pp.971-1015. �hal-00297979�
BGD
5, 971–1015, 2008
Methane seepage in the North Sea G. Wegener et al. Title Page Abstract Introduction Conclusions References Tables Figures ◭ ◮ ◭ ◮ Back Close
Full Screen / Esc
Printer-friendly Version Interactive Discussion
Biogeosciences Discuss., 5, 971–1015, 2008 www.biogeosciences-discuss.net/5/971/2008/ © Author(s) 2008. This work is distributed under the Creative Commons Attribution 3.0 License.
Biogeosciences Discussions
Biogeosciences Discussions is the access reviewed discussion forum of Biogeosciences
Biogeochemical processes and microbial
diversity of the Gullfaks and Tommeliten
methane seeps (Northern North Sea)
G. Wegener1, M. Shovitri1, K. Knittel1, H. Niemann1,2,*, M. Hovland3, and A. Boetius1,2,4
1
Max Planck Institute for Marine Microbiology, Bremen, Germany 2
Alfred Wegener Institute for Polar and Marine Research, Bremerhaven, Germany 3
Statoil, Stavanger, Norway 4
Jacobs University Bremen, Bremen, Germany ∗
present address: Institute for Environmental Geoscience, University of Basel, Switzerland Received: 21 January 2008 – Accepted: 25 January 2008 – Published: 25 February 2008 Correspondence to: G. Wegener ([email protected])
BGD
5, 971–1015, 2008
Methane seepage in the North Sea G. Wegener et al. Title Page Abstract Introduction Conclusions References Tables Figures ◭ ◮ ◭ ◮ Back Close
Full Screen / Esc
Printer-friendly Version Interactive Discussion
Abstract
Fluid-flow related seafloor structures and gas seeps were detected in the North Sea in the 1970s and 1980s by acoustic sub-bottom profiling and oil rig surveys. A va-riety of features like pockmarks, gas vents and authigenic carbonate cements were found to be associated with sites of oil and gas exploration, indicating a link between 5
these surface structures and underlying deep hydrocarbon reservoirs. In this study we performed acoustic surveys and videographic observation at Gullfaks, Holene Trench, Tommeliten, Witch’s Hole and the giant pockmarks of the UK Block 15/25, to investigate the occurrence and distribution of cold seep ecosystems in the Northern North Sea. The most active gas seep sites, i.e. Gullfaks and Tommeliten, were investigated in de-10
tail: at both sites gas bubbles escaped continuously from small holes in the seabed to the water column, reaching the upper mixed surface layer as indicated by acoustic im-ages of the gas flares. At Gullfaks a 0.1 km2large gas emission site was detected on a flat sandy seabed, covered by filamentous sulfide-oxidizing bacteria. At Tommeliten we found a patchy distribution of small bacterial mats indicating sites of gas seepage. Here 15
the seafloor consists of layers of sand and stiff clay, and gas emission was observed from small cracks in the seafloor. At both sites the anaerobic oxidation of methane (AOM) coupled to sulfate reduction is the major source of sulfide. Molecular analy-ses targeting specific lipid biomarkers and 16 S rRNA gene sequences identified an active microbial community dominated by sulfide-oxidizing and sulfate-reducing bac-20
teria (SRB) as well as methanotrophic bacteria and archaea. Carbon isotope values of specific microbial fatty acids and alcohols were highly depleted, indicating that the microbial community at both gas seeps incorporates methane or its metabolites. The microbial community composition of both shallow seeps show high similarities to the deep water seeps associated with gas hydrates such as Hydrate Ridge or Eel River 25
BGD
5, 971–1015, 2008
Methane seepage in the North Sea G. Wegener et al. Title Page Abstract Introduction Conclusions References Tables Figures ◭ ◮ ◭ ◮ Back Close
Full Screen / Esc
Printer-friendly Version Interactive Discussion
1 Introduction
The North Sea is a marginal sea of the Atlantic on the European continental shelf. Its sedimentary basin, especially the Western and Northern areas, hosts large gas and oil fields which are exploited since the 1970s. Leaking methane reservoirs are a major source for shallow gas accumulations and emission into the water column and 5
atmosphere (Hovland and Judd, 1988; Rehder et al., 1998; Judd and Hovland 2007). In the North Sea, eruptive gas ebullition through impermeable seabed consisting of stiff glacial clays leads to the formation of small craters at the seafloor, also known as pockmarks (Hovland and Judd, 1988). These pockmarks have diameters in the range of few to several hundred meters and are widespread in gas and oil fields of the central 10
and northern North Sea. Intensive bathymetric and videographic surveys by the British Geological Survey and oil industry have led to a good understanding of the distribution of these and other gas escape structures in the North Sea (Judd and Hovland, 2007). As part of the 5th EU framework project METROL “Methane fluxes in ocean margin sediments: microbiological and geochemical control” we have studied the distribution, 15
biogeochemistry and microbiology of gas seepage in the North Sea, to identify potential sites of methane emission to the atmosphere, and to better understand the functioning of the associated shallow water seep ecosystems.
Although methane is abundant in the seafloor, the oceans account for only 3 to 5% of the global atmospheric methane flux (Reeburgh, 2007). Aerobic and anaerobic micro-20
bial methane consumption almost completely control the gas flux into the water column and atmosphere, except at sites of high fluid flow and free gas ebullition (Valentine and Reeburgh, 2000). The anaerobic oxidation of methane with sulfate as terminal elec-tron acceptor is the dominant biogeochemical process in gassy sediments (Hinrichs and Boetius, 2002). Its net reaction can be described according to Eq. (1), but the 25
underlying biochemistry of this process remains unknown (Widdel et al., 2007). CH4+ SO2−4 −→HCO
−
3 + HS
−
+ H2O (R1)
BGD
5, 971–1015, 2008
Methane seepage in the North Sea G. Wegener et al. Title Page Abstract Introduction Conclusions References Tables Figures ◭ ◮ ◭ ◮ Back Close
Full Screen / Esc
Printer-friendly Version Interactive Discussion
identified as anaerobic methanotrophs by analyses of 16 S rRNA gene sequences and of stable isotope signatures of specific biomarkers (Hinrichs et al., 1999; Boetius et al., 2000; Orphan et al., 2001b; Niemann et al., 2006). In most seep habitats archaea form consortia with sulfate-reducing bacteria of the Desulfosarcina/Desulfococcus or
Desul-fobulbus groups (Knittel et al., 2003; Niemann et al., 2006; L ¨osekann et al., 2007).
5
These associations are commonly attributed to obligate syntrophy, in which the ar-chaeal partner activates and metabolizes methane, providing an intermediate that is scavenged by the sulfate-reducing partner (Nauhaus et al., 2002; 2007). Analyses of carbon isotopes in seep ecosystems have shown a tight link between methane, the mi-crobial consortia, authigenic carbonate precipitates and higher trophic levels in the food 10
web (Hovland et al., 1985; Ritger et al., 1987; Hinrichs and Boetius, 2002; Hovland et al., 2002; Levin, 2005). Deep water gas seeps often support an enormous biomass of free-living and symbiotic microbial life that is nourished by the oxidation of methane and the product of its anaerobic oxidation, sulfide. A prominent feature of such seeps are mat-forming chemoautotrophic bacteria using sulfide as energy source, including 15
Beggiatoa (Treude et al., 2003; Joye et al., 2004), and Arcobacter (Omoregie et al.1).
Furthermore, authigenic carbonates related to anaerobic oxidation of methane (AOM) are found at many seeps. The precipitation of these carbonates is possibly related to an increase of pore water alkalinity due to AOM (Luff and Wallmann, 2003). Car-bonate outcrops attract a variety of hardground fauna like corals, ophiurids, sponges 20
and bivalves (Hovland and Risk, 2003; Niemann et al., 2005). Ultimately, the carbon-ate precipitation associcarbon-ated with AOM can fill and seal gas escape conduits (Hovland, 2002).
Biogeochemical research efforts on cold seeps during the last decade mainly fo-cused on deep water systems, especially those associated with gas hydrates. As a 25
consequence, much more is known about these systems than about shallow water seeps in estuaries and shelf seas, despite their potential relevance for gas emission
1
Omoregie, E., Niemann, H., Masterlerz, V., de Lange, G., Stadnitskaia, A., Foucher, J.-P., and Boetius, A.: Anaerobic oxidation of methane and sulfate, Mar. Geol., in review, 2008.
BGD
5, 971–1015, 2008
Methane seepage in the North Sea G. Wegener et al. Title Page Abstract Introduction Conclusions References Tables Figures ◭ ◮ ◭ ◮ Back Close
Full Screen / Esc
Printer-friendly Version Interactive Discussion
to the atmosphere. Specifically in the Northern North Sea, where the water column is frequently mixed by storms, methane emission from the seabed is likely to result in an export of this greenhouse gas to the atmosphere. However, well constrained estimates of the methane flux from the seabed to the atmosphere are still missing for the North Sea.
5
Here we investigated several pockmarks and potential sites of gas seepage of the Northern North Sea. Sediments were sampled from sulfide oxidizing bacterial mats which were associated with gas ebullition. Based on the concentration and carbon isotopy of specific lipid biomarkers, as well as by 16 S rRNA sequence analysis, we describe the microbial communities of the two active shallow water seeps in the North 10
Sea (Gullfaks and Tommeliten). Furthermore, their phylogenetic and biogeochemical characteristics are compared with those of known deep water cold seep communities to investigate whether shallow and deep seeps are populated by different types of methanotrophs.
2 Material and methods
15
2.1 Sampling sites
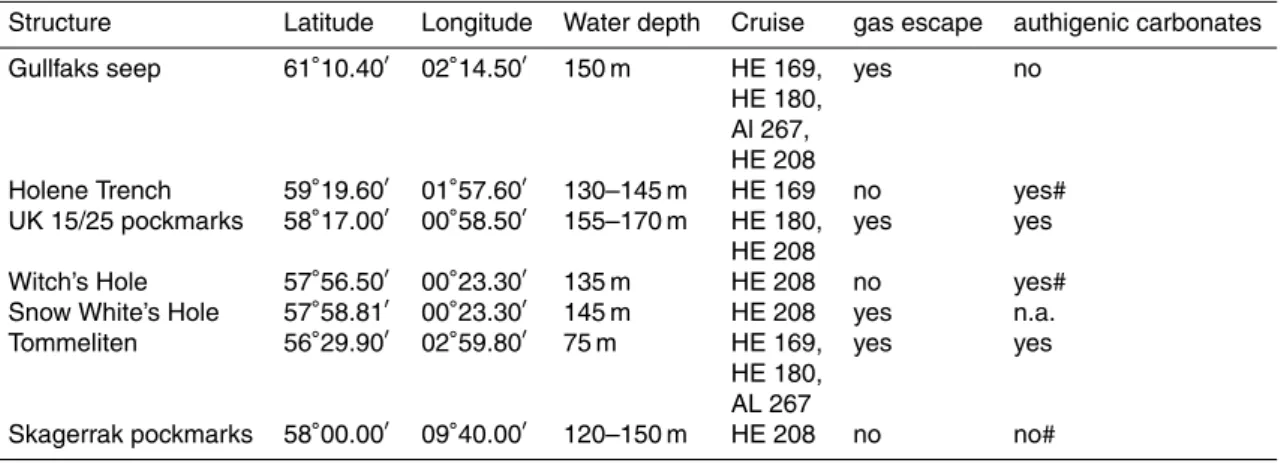
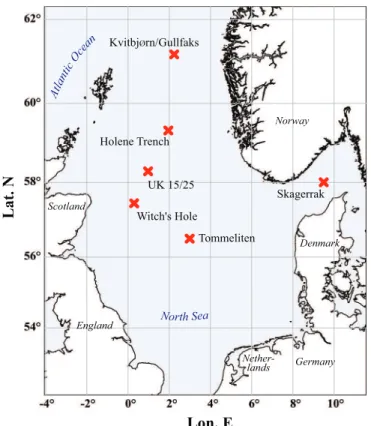
Figure 1 gives an overview on the cold seep sites in the North Sea visited during the METROL cruises (R/V Heincke cruises HE169, HE180, HE208 and R/V Alkor cruise AL267; also see Table 1). For all investigated sites detailed background information was obtained previously during extensive geological surveys including seismic and 20
sonar monitoring of seabed and water column features, as well as by videographic exploration using towed cameras and ROVs (Hovland and Judd, 1988). Gas emis-sions at Tommeliten and Gullfaks have been documented for a period over 25 years (Niemann et al., 2005; Judd and Hovland, 2007).
Gullfaks is one of the four major Norwegian oil and gas fields, located in the north-25
BGD
5, 971–1015, 2008
Methane seepage in the North Sea G. Wegener et al. Title Page Abstract Introduction Conclusions References Tables Figures ◭ ◮ ◭ ◮ Back Close
Full Screen / Esc
Printer-friendly Version Interactive Discussion
and deepens northeastwards towards the Norwegian trench (Hovland, 2007). During the last glacial maximum the plateau was exposed and coastal sands were deposited. Younger sediments of the Holocene have not been found in this area because tidal cur-rents prevent deposition (Eisma and Kalf, 1987). The Gullfaks hydrocarbon reservoir is situated in a depth of nearly 3 km (Hovland and Judd, 1988). Shallow gas accumu-5
lations formed above the leaky reservoir at depths between 300 and 450 m below the seafloor (m.b.s.f.) (Judd and Hovland, 2007).
Tommeliten lies in the greater Ekofisk area north of the central North Sea (Hovland and Judd, 1988; Hovland, 2002; Judd and Hovland, 2007) at a water depth of 75 m. This gas field is associated with salt diapirs at about 1 km bsf, and has already been 10
fully exploited (Hovland, 2002). Seismic profiles indicate extensive gas escape path-ways in the seabed above the deposit. Eruptive discharge of free gas probably formed the shallow pockmarks which lie 0.5–1 m below the surrounding seabed level (Hovland and Sommerville, 1985). The sediments consist of sands, silt and marl (Niemann et al., 2005). Associated with gas leakage pathways are calcareous cements, some of 15
which extend above the seafloor and form reefs populated by diverse anthozoa and other hardground fauna (Hovland and Judd, 1988; Niemann et al., 2005). Acoustic turbidity indicated the presence of free gas in the seabed in an area of about 0.12 km2. Sonar surveys revealed gas escape to the water column, and accordingly, numerous gas seeps associated with whitish bacterial mats were observed during ROV surveys 20
(Hovland et al. 1993; Judd and Hovland, 2007; Niemann et al., 2005). Gas seepage was confined to about 120 individual bubble streams in an area of 6500 m2. An emis-sion of 47 g CH4m−2 was estimated for this seepage area (Hovland et al., 1993). In the vicinity of the gas vents, elevated methane concentrations and gas bubbles were found in the seabed, at a sediment depth of 1–5 m.b.s.f., associated with layers of 25
carbonate precipitates and cements (Niemann et al., 2005). These observations and biogeochemical rate measurements indicate that most methane may be consumed in the seafloor, but that considerable gas escape to the water column occurs through cracks and fissures (Niemann et al., 2005). The carbon isotope signature of methane
BGD
5, 971–1015, 2008
Methane seepage in the North Sea G. Wegener et al. Title Page Abstract Introduction Conclusions References Tables Figures ◭ ◮ ◭ ◮ Back Close
Full Screen / Esc
Printer-friendly Version Interactive Discussion
emitted from the seafloor of −45.6‰ indicates its thermogenic origin (Hovland and Sommerville, 1985; Hovland and Judd, 1988).
3 Seafloor observations
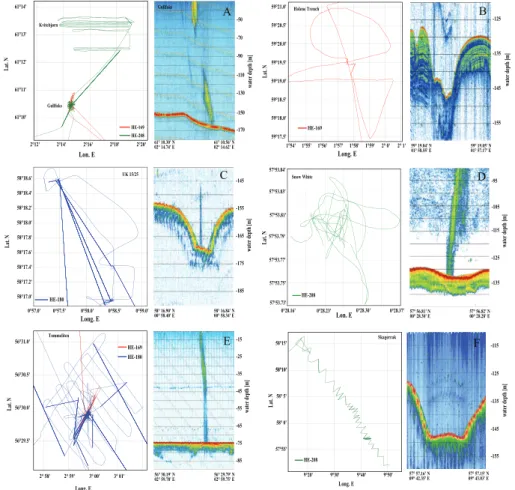
During the cruises HE169, HE180, HE208 and AL267 (Table 1), several seep locations of the North Sea were visited (Fig. 1). Gas flares were detected using the sediment 5
echo sounder system SES-2000 provided by INNOMAR (Rostock, Germany). The emitter induces two primary frequencies near 100 kHz to generate secondary band-widths of 4 and 15 kHz. The long waves were used to visualize shallow sea floor structures and layering. Water depth and gas flares were recorded with the 15 kHz spectrum, while sediment features were observed with a 4 kHz spectrum. Several 10
acoustic transects were evaluated to quantify the gas flares and their extensions, and to localize the flare source at the seafloor. Video observations were performed with the ROV Sprint (Alfred Wegener Institute for Polar and Marine Research, Bremerhaven; HE169), the towed camera system of the AWI (HE180) or the MPI (Spy, Mariscope, Kiel; HE208), or via a remotely operating vehicle at Tommeliten (ROV Cherokee, 15
MARUM, Bremen; AL267).
4 Sediment sampling
At Gullfaks sediments were sampled in May 2004 (HE208) using a video-guided mul-tiple corer system (MUC; Octopus, Kiel). The samples were recovered from an area densely covered with bacterial mats where gas ebullition was observed. The coarse 20
sands limited MUC penetration depth to max 30 cm. The highly permeable sands did not allow vertical subsampling of the MUCs at high resolution, because porewater was lost during subsampling.
The gas flare mapping and videographic observation at Tommeliten indicated an area of gas emission, which consisted of a few small patches of bacterial mats with 25
BGD
5, 971–1015, 2008
Methane seepage in the North Sea G. Wegener et al. Title Page Abstract Introduction Conclusions References Tables Figures ◭ ◮ ◭ ◮ Back Close
Full Screen / Esc
Printer-friendly Version Interactive Discussion
diameters <50 centimeters, spaced apart by 10–100 m, from most of which a single stream of gas bubbles emerged. Sampling of these patchy gas vents was only possible with the ROV Cherokee to which we mounted 3×3.8 cm diameter push cores. The cores were sampled in 3 cm intervals.
Sediment porosity, sulfate and methane concentrations were determined following 5
the METROL protocol (http://www.metrol.org/index.php?bereich=1). In situ methane concentrations were calculated using PHREEQC, Version 2, US Geological Survey, 2007. Samples for molecular, microbiological and biomarker analyses were processed as described below.
Radiotracer based in vitro measurements of AOM and SR were performed in the 10
home laboratory. Sediment samples stored anoxically in wide mouth bottles with ar-tificial, anaerobic seawater medium (28 mM Sulfate, 30 mM carbonate, 1 mM sulfide, equilibrated at a pH of 7.2; see also Widdel and Bak, 1992) were transferred into Hun-gate tubes, refilled with medium and brought into equilibrium with one atmosphere of methane (Kr ¨uger et al., 2005). Controls without methane addition were prepared to 15
determine methane independent SR. Rates were determined from replicate incuba-tions (n≥3). After one day of equilibration,35SO4 (50 kBq dissolved in 10 µl water) for SR and14CH4 (10 kBq dissolved in 50 µl water) for AOM were injected into the
Hun-gate tubes through a butyl rubber septum. Samples were incubated for 7 days at in situ temperatures (8◦C). The reactions were stopped by transferring the samples into 20
zinc acetate and NaOH solution, respectively (Treude et al., 2003). Further process-ing of AOM and SR samples was carried out as described previously (Treude et al., 2003; Kallmeyer et al., 2004), respectively. Concentrations and activities of the reac-tants (methane or sulfate) and the activities of the products (sulfide or carbonate) were measured to determine AOM and SR rates according to the following formulas:
25
AOMrate = [CH4] · a
14 C
carbonate
BGD
5, 971–1015, 2008
Methane seepage in the North Sea G. Wegener et al. Title Page Abstract Introduction Conclusions References Tables Figures ◭ ◮ ◭ ◮ Back Close
Full Screen / Esc
Printer-friendly Version Interactive Discussion
SRR = [SO4] · aTRIS
t ·aTOT · msed
·1.06, (2)
In Eq. (2) (CH4) is the concentration of methane, a 14C
methane and a14C carbonate the activity of the reactant and the product of AOM (Treude et al., 2003). In Eq. 3, (SO4)
is the concentration of sulfate, aTRIS the activity of the total reduced inorganic sulfur, aTOT is the total activity of sulfide and sulfate and t is the reaction time. The factor 5
1.06 accounts for the discrimination of the heavier radio nucleotide 35S (Jørgensen and Fenchel, 1974).
Total organic carbon content (TOC) and carbon nitrogen ratios (C/N) were analyzed from freeze-dried samples. Briefly, inorganic carbon (carbonate) was removed via HCl acidification. Subsequently, 20 to 30 mg of homogenized samples were filled in zinc 10
cartridges and organic carbon and nitrogen was measured in a CNS analyzer (Carlo Erba NA 1500 CNS analyzer).
4.1 Biomarker analyses
Lipid biomarker extraction from 10–17 g wet sediment was carried out as described in detail elsewhere (Elvert et al., 2003). Briefly, defined concentrations of cholestane, 15
nonadecanol and nonadecanolic acid with known δ13C values were added to the sed-iments prior to extraction as internal standards for hydrocarbons, alcohols and fatty acids, respectively. Total lipids were extracted from the sediment by ultrasonifica-tion with organic solvents of decreasing polarity. Esterified fatty acids were cleaved by saponification with methanolic KOH solution. From this mixture, the neutral frac-20
tion (mainly hydrocarbons and alcohols) was extracted with hexane. After subsequent acidification, fatty acids were extracted with hexane. For analysis, fatty acids were methylated using BF3in methanol yielding fatty acid methyl esters (FAMES).
The neutral fraction was further separated into hydrocarbons, ketones and alcohols on a SPE cartridge with solvents of increasing polarity (Niemann et al., 2005). The ke-25
methy-BGD
5, 971–1015, 2008
Methane seepage in the North Sea G. Wegener et al. Title Page Abstract Introduction Conclusions References Tables Figures ◭ ◮ ◭ ◮ Back Close
Full Screen / Esc
Printer-friendly Version Interactive Discussion
lated to trimethylsilyl (TMS) ethers using bis(trimethylsilyl)triflouracetamid (BSTFA). Concentration and identity of single lipid compounds was determined by gas chro-matography (GC) and gas chrochro-matography-mass spectrometry (GC-MS) analysis, re-spectively (Elvert et al., 2003, 2005; Niemann et al, 2005). Double bound positions of monoeonic fatty acids were determined analyzing their dimethyl disulfide (DMDS) 5
adducts according to Moss and Labert-Faeir (1989). δ13C-values of single lipid com-pounds were determined by GC-IRMS analyses according to Elvert et al. (2003). Con-centration and isotopic signatures of fatty acid and alcohol were corrected for the addi-tional carbon atoms added during derivatisation.
5 DNA extraction, PCR amplification and clone library construction 10
From both sites DNA was extracted from 2 g of wet sediment (1–3 cm depth) using bio101 soil kit (Bio101, La Jolla, California). Domain-specific primers were used to am-plify almost full-length 16 S rRNA genes from the extracted chromosomal DNA by PCR. For Bacteria, primers GM3F (Muyzer et al., 1995) and EUB1492 (Kane et al., 1993) were used, for Archaea, the primers ARCH20F (Massana et al., 1997) and Uni1392 15
(Lane et al., 1985) were used. PCRs were performed (30 cycles) and products purified as described previously (Ravenschlag et al., 1999). DNA was ligated in the pGEM-T-Easy vector (Promega, Madison, WI) and transformed into E. coli TOP10 cells (Invitro-gen, Carlsbad, CA) following manufacturer’s recommendation.
5.1 Sequencing and phylogenetic analysis 20
Sequencing was performed by Taq cycle sequencing with a model ABI377 sequencer (Applied Biosystems). The presence of chimeric sequences in the clone libraries was determined with the CHIMERA CHECK program of the Ribosomal Database Project II (Center for Microbial Ecology, Michigan State University,http://rdp8.cme.msu.edu/cgis/ chimera.cgi?su=SSU). Sequence data were analyzed with the ARB software package 25
BGD
5, 971–1015, 2008
Methane seepage in the North Sea G. Wegener et al. Title Page Abstract Introduction Conclusions References Tables Figures ◭ ◮ ◭ ◮ Back Close
Full Screen / Esc
Printer-friendly Version Interactive Discussion
(Ludwig et al., 2004). Phylogenetic trees were calculated with the ODP 204 sequences from this project together with reference sequences, which were available in the EMBL, GenBank and DDJB databases by maximum-likelihood and neighbor-joining analysis with different sets of filters.
5.2 Cell counts and CARD-FISH (Catalyzed reporter deposition – fluorescence in situ 5
hybridization)
The fixation for total cell counts and CARD-FISH were performed on-board directly after sampling. For both methods 2 ml of the sediment were added to 9 ml of 2% formalde-hyde artificial seawater solution, respectively. After fixation for two hours CARD-FISH samples were washed three times with 1xPBS (10 mM sodium phosphate solution, 10
130 mM NaCl, adjusted to a pH of 7.2 by titration with Na2HPO4 or NaH2PO4) and fi-nally stored in 1:1 PBS:ethanol solution at −20◦C until further processing. Samples for total cell counts were stored in formalin at 4◦C.
For the sandy samples the total cell count/CARD-FISH protocol were optimized to separate the sands particles from the cells. Cells were dislodged from sediment grains 15
and brought into solution with the supernatant by sonicating each samples on ice for 2 min at 50 W. This procedure was repeated four times and supernatants were com-bined. Total cell numbers were determined from the supernatant using acridine orange direct counting (AODC; Meyer-Reil, 1983).
CARD-FISH was performed following the protocol of Pernthaler (2002). The sed-20
iment samples were brought to a final dilution of 1:2000 to 1:4000 and filtered onto 0.2 µm GTTP filters (Millipore, Eschbonn, Germany). The probes used in this study (all purchased from biomers.net GmbH, Ulm, Germany) were EUB 338 I-III specific for most Bacteria (Amann et al., 1990; Daims et al., 1999), DSS658 specific for Desul-fosarcina spp., Desulfococcus spp. and closely related clone sequences (Manz et 25
al., 1998), Arch915 specific for most Archaea (Stahl and Amann, 1991), and probes ANME1-350 (Boetius et al., 2000), ANME2a-647, ANME2c-622 (Knittel et al., 2005) and ANME3-1249 (Niemann et al., 2006) specific for ANME-1, -2a, -2c, and -3 archaeal
BGD
5, 971–1015, 2008
Methane seepage in the North Sea G. Wegener et al. Title Page Abstract Introduction Conclusions References Tables Figures ◭ ◮ ◭ ◮ Back Close
Full Screen / Esc
Printer-friendly Version Interactive Discussion
cells, respectively. Cell permeabilization and probe hybridization were performed ac-cording to the author’s instructions. For reference cell numbers, samples were also stained with 4′6′-diamidino-2-phenlyindole (DAPI) for 15 min (1 µg/ml) and washed with sterile filtered water and ethanol for 60 and 30 sec, respectively. Air-dried filters were imbedded in Citifluor (Citifluor Ltd., Leicester, UK). Cells were counted using an 5
epifluorescence microscope (Axioplan, Zeiss, Germany). At least 1000 cells in ran-domly chosen fields were counted per sample. To quantify aggregates of ANME-2a, -2c and -3 up to 250 grids were counted under 400-fold magnification. Dual hybridiza-tions for sulfate reducers (DSS) and archaea (ANME-2a and -2c) were performed using different fluorescence dyes (cy3 and cy5) and images were taken with a confocal laser 10
scanning microscope (LSM510; Carl Zeiss, Jena, Germany).
6 Results and discussion
6.1 Distribution of active seeps in the Northern North Sea
The presence of gas flares indicating active methane seepage from the seabed was detected at different fluid flow-related seafloor structures visited during the METROL 15
cruises. Large and abundant gas flares were found at Tommeliten, Gullfaks, Snow White’s Hole and the giant pockmarks of UK block 15/25 (Figs. 1, 2; Table 1).
The pockmarks of UK Block 15/25, Snow White’s Hole and Witch’s Hole are part of the Witch Ground formation, northwest of the Tommeliten seep area (Fig. 1, Hov-land and Judd, 1988). During our cruises (HE180 and HE208), most of the 5 giant 20
(Scanner, Scotia and Challenger formation) and two medium sized pockmarks of the UK Block 15/25 showed active seepage of methane from the deepest part of each de-pression (up to 17 m below the surrounding seafloor; Fig. 2c). Hovland et al. (1993) estimated the average flux at this location with 26 g CH4m−2yr−1. In the center of the pockmarks we also observed carbonate outcrops which were populated with ben-25
BGD
5, 971–1015, 2008
Methane seepage in the North Sea G. Wegener et al. Title Page Abstract Introduction Conclusions References Tables Figures ◭ ◮ ◭ ◮ Back Close
Full Screen / Esc
Printer-friendly Version Interactive Discussion
surface and subsurface cements at the bottom of the steep pockmarks because the gravity corer and multiple corer could not penetrate. The methane venting and the car-bonate cements have been observed previously (Hovland and Judd, 1988) and during all expeditions to this site, indicating that the UK 15/25 pockmarks may have been con-tinuously emitting methane to the hydrosphere for at least 2 decades. The gas flares 5
at the UK 15/25 pockmarks reached up to 80 m below the sea surface. In contrast to earlier observations (Hovland and Judd, 1998), the Witch’s Hole structure itself was presently dormant, but we found an active pockmark southwest of it, which we named Snow White’s Hole (Fig. 2d). This structure emits a large gas flare extending about 80 m from the seafloor. However sampling directly at the flare was not possible most 10
likely because of the presence of carbonate cements. Sampling in the vicinity of the gas flare at the edge of the pockmark recovered only oxidized non-seep sediments.
The Holene Trench is an open channel of ca. 1 km width located on the Norwegian Plateau in about 120 m water depth. Previous surveys showed an acoustic turbidity in the top most 30 m of the surface sediments indicating gas charged sediments (Hov-15
land and Judd, 1988). During our survey, two places were found where the turbidity extends to the surface of the sea floor, which could be related to active seep sites. However, during HE-169 we could not find any traces for active seepage (Fig. 2b) and only beige, oxidized clay sediments were recovered by multiple corer sampling. The western slope of the Norwegian Trench hosts several pockmark-like structures, which 20
do not show carbonate outcrops (Hovland and Judd, 1988). Our survey during cruise HE-169 did not reveal any traces of seepage and one grab sample recovered beige, oxidized sandy-silty sediments. Previous surveys in the Skagerrak found several pock-marks with active gas escapes and seepage related fauna (Dando et al., 1994; Rise et al., 1999). During HE-208 we did not observe gas seepage from the positions reported 25
in Dando et al. 1994 (Fig. 2f).
For further investigations of the biogeochemistry and microbiology of shallow water cold seeps in the North Sea we focused on the Tommeliten and Gullfaks sites. The re-sults from subsurface sampling of the Tommeliten seeps with help of a vibrocorer were
BGD
5, 971–1015, 2008
Methane seepage in the North Sea G. Wegener et al. Title Page Abstract Introduction Conclusions References Tables Figures ◭ ◮ ◭ ◮ Back Close
Full Screen / Esc
Printer-friendly Version Interactive Discussion
already reported in Niemann et al. (2005). Here we focused on the hot spots for mi-crobial methane turnover and methane emission which were associated with bacterial mats at both sites.
7 Gullfaks
7.1 Seafloor observations 5
The Gullfaks field is located on the North Sea Plateau (∼150 m water depth) and on an ancient beach (140–190 m), respectively. The submerged beach was formed during the sea-level low of the last glacial maximum (Hovland and Judd, 1988). Pockmark-like depressions were absent, which may be explained by the sediment properties of this area. Pockmark formation is believed to be limited to silty or clayish seafloor with 10
low permeability and may not occur in highly permeable sandy seafloors (Hovland and Judd, 1988; Judd, 2003). The flat seafloor of the Gullfaks seep area is composed of coarse sand and gravel. However, ripple structures observed during the ROV dives in-dicate episodically high bottom water current velocities. Several gas flares were found within an area of about 0.5 km2, which was named “Heincke seep area” (Hovland, 15
2007). The flares extended up to 120 meters above the seafloor, reaching the mixed water layer (Fig. 2a). Visual observations of the seafloor showed 1–2 bubble streams escaping from the sands every 5 m2 within a smaller area of 0.1 km2 covered by mi-crobial mats (Fig. 3a). The macroscopic appearance resembled mats formed by giant filamentous sulfide oxidizing bacteria, such as Beggiatoa, which establish above zones 20
of high sulfide flux (Nelson et al., 1986). No megafauna was observed to populate the seep site or to graze upon the bacterial mats, but many large cod-like fish were ob-served in this area. Considering the solubility of methane in situ at a water depth of 150 m (equivalent to ∼16 bar modeled with PREEQC, USGS), methane concentrations in the seabed should exceed 26 mM.
25
BGD
5, 971–1015, 2008
Methane seepage in the North Sea G. Wegener et al. Title Page Abstract Introduction Conclusions References Tables Figures ◭ ◮ ◭ ◮ Back Close
Full Screen / Esc
Printer-friendly Version Interactive Discussion
Upon recovery, the sediment cores degassed strongly, releasing streams of methane bubbles into the overlaying water. The sediments smelled strongly of sulfide. The top 30 cm of sediment retrieved by multiple coring was unsorted, coarse to medium grained sands. Sediment porosity was on average 33%. Only the top surface layer of 1 to 5 cm was of beige color mixed with black particles, probably marking the oxygen penetration 5
depth. The color shift to blackish sediments below indicated the change of redox condi-tions to negative values and the presence of free sulfide and iron sulfide precipitacondi-tions. Within the gassy sediment abundant ferromagnetic minerals, probably magnetite or greigite, were found, indicating a connection of methane and iron fluxes. Total organic carbon showed average values of only 0.17%, indicating that the main source for the 10
observed high sulfide concentrations may be methane rather than deposited organic material.
7.2 Microbial methane oxidation and sulfate reduction
From all six multicorer samples retrieved from the mat covered area, methane oxi-dation and sulfate reduction rate measurements were performed using replicate sub-15
samples of the bulk sediments from the top 25 cm. Methane oxidation rates ranged from 0.006 µmol g−1to 0.18 µmol g−1dry weight d−1and sulfate reduction rates (SRR) from 0.05 µmol g−1 to 0.3 µmol g−1 dry sediment d−1. In control measurements with-out methane, SRR was negligible, indicating that methane was the dominant elec-tron donor for sulfate reduction. The integrated methane oxidation rates averaged 20
12.5 mmol m−2 d−1 and the integrated SRR 18.5 mmol m−2 d−1. These are compar-atively high rates which fall within the range of other measurements from bacterial mat covered seep sites like Hydrate Ridge (5.1 to 99 mmol m−2 d−1; (Treude et al., 2003) or Haakon Mosby Mud Volcano (4.5 mmol m−2 d−1; Niemann et al., 2006). Using the mean methane oxidation rate from our incubations, a methane consumption of 15 t yr−1 25
can be roughly calculated for an area of 0.1 km2. Based on quantifications of single gas bubble streams (Hovland et al., 1993) we estimated a gas flux to the water column of 76 t yr−1for this area, which means that the microbial filter could consume at least 16%
BGD
5, 971–1015, 2008
Methane seepage in the North Sea G. Wegener et al. Title Page Abstract Introduction Conclusions References Tables Figures ◭ ◮ ◭ ◮ Back Close
Full Screen / Esc
Printer-friendly Version Interactive Discussion
of the total gas flux. Of course, these are only rough estimates, as the gas streams may vary strongly in intensity and methane content.
7.3 Biomarker and carbon isotope signatures
The13C carbon signatures of methane at Gullfaks cover a range from −44.4‰ vs. PDB (Pee Dee Belemnite) at reservoir level (2,890 m below seafloor) to −70‰ at seafloor 5
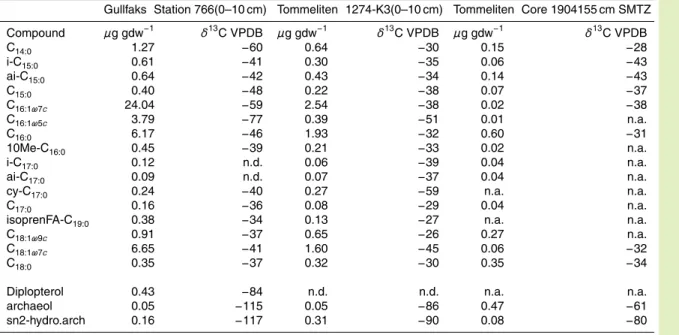
level (Judd and Hovland, 2007). The abundance of specific biomarker lipids and their stable carbon isotope signatures were analyzed to reveal the distribution of chemoau-totrophic and methanotrophic microbial communities. The lipid concentrations and iso-topic signatures of the Gullfaks microbial communities (Core 766) are shown in Table 2. In comparison to highly active seep sites such as Hydrate Ridge, concentrations of lipid 10
biomarkers at Gullfaks and Tommeliten were low.
In surface sediments of Gullfaks monoeonic fatty acids were strongly dominant. Al-though these fatty acids are produced by a wide range of gram negative bacteria (Fang et al., 2005), their relative abundance can be used to trace specific microbial groups. The measured ratio for C16:1ω7c, C18:1ω7c and C16:0 of 68:18:14 was close to the ratio 15
of 73:18:9 previously reported for Beggiatoa filaments covering cold seep sediments of the Gulf of Mexico (Zhang et al., 2005). The δ13C values of the FA C16:1ω7c and C18:1ω7c (−41 and −57‰, respectively) extracted from the bacteria covered sands, in-dicate a substantial contribution of autotrophic carbon fixation as previously found for several species of giant filamentous sulfide oxidizers (Nelson and Jannasch, 1983; 20
Nelson et al., 1986; Nelson et al., 1989). In addition to signatures of sulfide oxidizing bacteria, substantial amount of diplopterol were found. This hopanoid is synthesized by several aerobic bacteria including methanotrophs (Rohmer et al., 1984). A methan-otrophic origin of this biomarker at Gullfaks is likely because of its highly depleted stable carbon composition (−84%).
25
Characteristic lipids for seep associated sulfate reducing proteobacteria are C16:1ω5c,
cy-C17:0ω5,6, (Blumenberg et al., 2004; Elvert et al., 2003; Niemann et al., 2005; Nie-mann and Elvert, in press). We found a biomarker pattern with a clear dominance of
BGD
5, 971–1015, 2008
Methane seepage in the North Sea G. Wegener et al. Title Page Abstract Introduction Conclusions References Tables Figures ◭ ◮ ◭ ◮ Back Close
Full Screen / Esc
Printer-friendly Version Interactive Discussion
C16:1ω5c relative to iC15:0 previously identified as a typical signature for populations of sulfate reducers associated to ANME-2 and -3 dominated communities (Niemann and Elvert, in press). Specifically the δ13C value of C16:1ω5c, of −82‰ strongly indicates
an incorporation of methane-derived carbon. Previously, Niemann et al. (2006) re-ported an association of Desulfobulbus related bacteria to ANME-3. We did not find 5
the typical biomarker C17:1ω6 of this group, nor the related sequences in the Gullfaks
sediments (L ¨osekann et al., 2007). Instead, substantial amounts of the13C depleted FA cy-C17:0ω5,6 (−97‰) provides evidence for a dominance of SRB of the Seep-SRB1
cluster associated with ANME-2 (Elvert et al., 2003; Niemann et al., 2006; Niemann and Elvert, in press). The fatty acids iso- and anteiso-C15:0 were less depleted with 10
signatures of −41 to −52‰. From the difference in the isotope signatures of these two groups of sulfate reducing bacteria, it appears likely that a diverse community of sulfate reducers is present in the Gullfaks sediments, of which only some are coupled to the anaerobic methanotrophs.
Several clades of ANME produce 13C-depleted archaeol and sn2-hydroxyarchaeol 15
which are used as biomarkers for AOM (Orphan et al., 2001a; Michaelis et al., 2002; Blumenberg et al., 2004). At Gullfaks, sn2-hydroxyarchaeol was 2.2–2.9 fold more abundant than archaeol, indicating the dominance of ANME-2 populations (Blumen-berg et al., 2004; Niemann and Elvert, in press). Both compounds were highly de-pleted in 13C, with δ13C-values of −11‰ and −117‰. Assuming that methane was 20
the sole carbon source (δ13C-methane=−70 (Judd and Hovland, 2007) for the syn-thesis of archaeol and sn2-hydroxyarchaeol, this is equivalent to a 13C fractionation factor of −45 to −47‰. This is in the range of isotope fractionation factors previously reported for anaerobic methanotrophic archaea from different marine settings (Hinrichs and Boetius, 2002; Niemann and Elvert, in press).
25
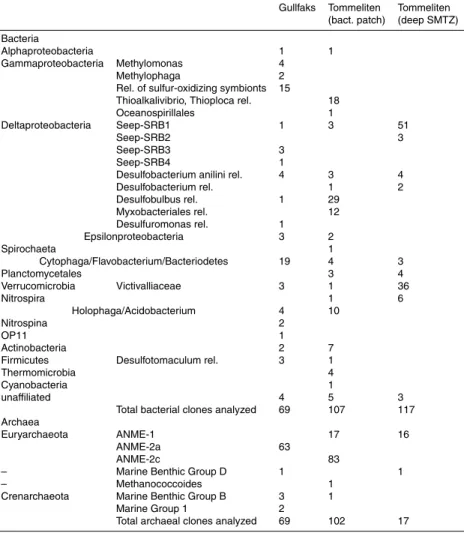
Microbial diversity and community composition based on 16S rRNA gene analyses. The bacterial 16S rRNA gene library from the gassy sands at Gullfaks comprised 69 gene sequences and was clearly dominated by microorganisms associated with seep ecosystems. We found different groups of sulfate-reducing bacteria and thiotrophic
BGD
5, 971–1015, 2008
Methane seepage in the North Sea G. Wegener et al. Title Page Abstract Introduction Conclusions References Tables Figures ◭ ◮ ◭ ◮ Back Close
Full Screen / Esc
Printer-friendly Version Interactive Discussion
as well as methylotrophic bacteria (Table 3, Fig. 4). 15 sequences belonged to rel-atives of sulfur-oxidizing symbiotic Gammaproteobacteria usually hosted by different marine worms or mussels. No closely related sequences of filamentous sulfide ox-idizers were found, although these were visually present in the sample from which DNA was extracted. Sequences related to methylotrophic bacteria (Methylomonas and 5
Methylophaga relatives) were also abundant (6 sequences) matching our results from
the biomarker studies. We found 10 sequences of Deltaproteobacteria, which were all related to SRB of the Desulfosarcina/Desulfococcus group (Seep-SRB-1), which is the partner of ANME-1 and -2 (Knittel et al., 2003). 19 clones were related to the clus-ter of Cytophaga – Flavobacclus-terium – Bacclus-teriodetes (CFB) which is a diverse group of 10
bacteria commonly found in the plankton and sediment involved in the degradation of complex organic matter, but which also occur at cold seep ecosystems (Knittel et al., 2003).
The archaeal 16 S rRNA sequence library was strongly dominated by Euryarchaeota sequences. Sixty three of 69 analyzed clones were affiliated with ANME-2a (Table 3, 15
Fig. 5), the most common group of anaerobic methane oxidizers in gas hydrate bear-ing environments (Knittel et al., 2005). The ANME-2a clones were highly similar to sequences from other seep sites (Fig. 5), e.g. the Santa Barbara Basin (Orphan et al., 2001a), Hydrate Ridge (Knittel et al., 2005), the Gulf of Mexico seeps (Mills et al., 2003), and a Pacific carbon dioxide seep (Inagaki et al., 2006). Sequences related 20
to other groups performing AOM, such as ANME-1, -2c, -3, were not found in our li-brary. The only other euryarchaeotal sequence belonged to the Marine Benthic Group D. Five clones belonged to the phylum Crenarchaeota including three clones of the Marine Benthic Group B which is regularly found at seeps (Knittel et al., 2005). The biogeochemical function of members of both archaeal marine benthic groups has not 25
been identified yet. A study based on isotopic signatures of lipid biomarkers suggests that subsurface Crenarchaeota of the Marine Benthic Group B could be heterotrophic, although they are commonly associated with methane sulfate transition zones (Biddle et al., 2006).
BGD
5, 971–1015, 2008
Methane seepage in the North Sea G. Wegener et al. Title Page Abstract Introduction Conclusions References Tables Figures ◭ ◮ ◭ ◮ Back Close
Full Screen / Esc
Printer-friendly Version Interactive Discussion
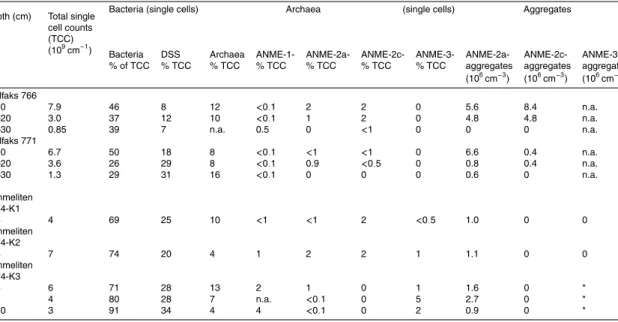
Total cell numbers in surface sediments at Gullfaks were quite high with 6.7×10⁹ and 7.9×10⁹ single cells ml−1 sediment in the uppermost 10 cm at station 771 and 766, respectively (Table 4). These cell numbers are higher than previously reported for non-seep sandy sediments (Llobet-Brossa et al., 1998; Wieringa et al., 2000; Rusch et al., 2001, 2003) and underline the stimulating effect of methane seepage on the micro-5
bial community inhabiting sands. The only other published cell counts from methane percolated sands showed numbers similar to those found at Gullfaks (Ishii et al., 2004). At a depth of 20–30 cm cell numbers decreased considerably to 0.85×10⁹and 1.3×10⁹ cells ml−1, indicating that the peak of microbial activity is in the upper 10 cm. The ra-tio of bacterial and archaeal cells were quantified by CARD-FISH. Bacteria comprised 10
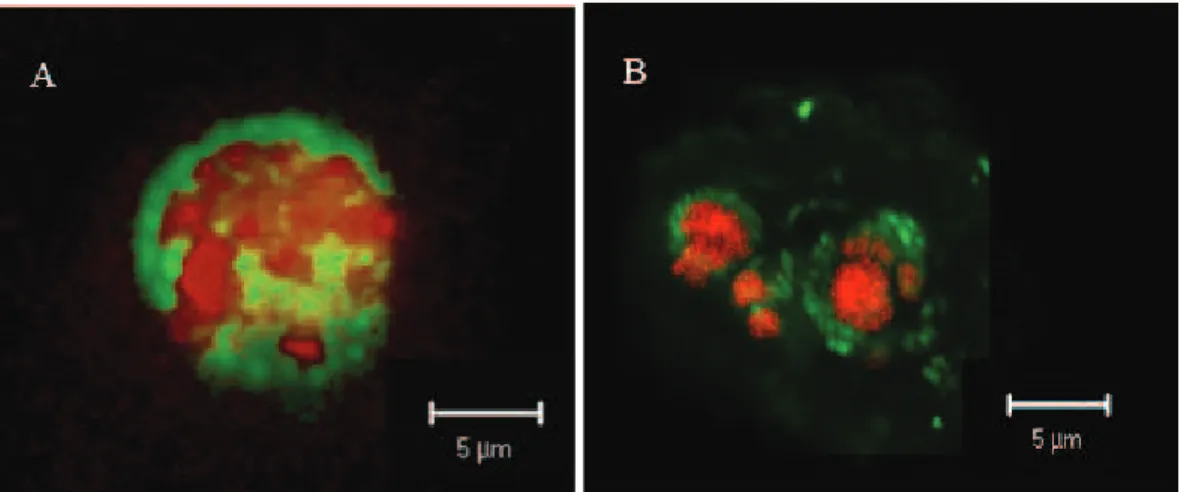
29–50% and Archaea 8–16% of the DAPI stained cells. We found relatively high num-bers of ANME 2a- and ANME 2c- cell aggregates; however, they did not reach the size and abundance of deep sea sites such as Hydrate Ridge (Nauhaus et al., 2002, 2007; Knittel et al., 2005). ANME-2a cells were clustering in dense, typically spherical ag-gregates associated with sulfate reducing bacteria in diameters of up to 10 µm (Fig. 6). 15
ANME-2c cells were detected in less dense, small aggregates. The highest counts of ANME aggregates (8.4×10⁶ ANME-2c aggregates at station 766, 6.6×10⁶ ANME-2a-aggregates at 771) and ANME single cells (1.6×10⁸cells ml−1) were also found in the top 10 cm, matching the distribution of total cell numbers. The abundance of methan-otrophic microorganisms strongly decreased with depth, providing evidence for a near 20
surface peak of AOM activity. This may indicate that the highest availability of both methane and sulfate as main energy source is generally found in the surface sediment horizon. Interestingly, this horizon is likely to experience temporary flushing with oxy-genated bottom waters, as indicated by the observed ripple structures on the seafloor, which are presumably caused by high bottom water currents. This should have a nega-25
tive effect on the anaerobic microbial communities. However, it is possible that the high upward advection of gas may restrict the downward diffusion of oxygenated bottom waters at the seep site.
BGD
5, 971–1015, 2008
Methane seepage in the North Sea G. Wegener et al. Title Page Abstract Introduction Conclusions References Tables Figures ◭ ◮ ◭ ◮ Back Close
Full Screen / Esc
Printer-friendly Version Interactive Discussion
ANME-2c were detected. Previously, only ANME-1 (Orphan et al., 2002; Niemann et al., 2005) and ANME-3 (L ¨osekann et al., 2007) were found as single cells. Monospe-cific ANME-2a or ANME-2c aggregates have been previously reported from Eck-ernf ¨order Bay (Treude et al, 2005) and Eel River Basin (Orphan et al., 2002). ANME-2 cells aggregates without bacterial partner were also found to dominate specific regions 5
of a microbial mat from the Black Sea (Treude et al., 2007).
8 Tommeliten seeps
8.1 Seafloor observations
The Tommeliten seep site lies at 75 m water depth and is part of the greater Ekofisk area of the Norwegian Block 1/9. In this area, the sedimentary rocks host a now 10
exploited hydrocarbon reservoir. This reservoir is pierced by a salt diapir at about 1 km depth below the sea floor, and disturbances on seismic profiles indicate that free gas migrates to the sea floor (Hovland and Judd, 1988; Hovland, 2002).
Within an area of 0.5 km2 at the Tommeliten site we observed several gas flares, which extended from the seafloor to the sea surface (Fig. 2f). Many of these flares 15
were concentrated in a small area of about 0.06 km2, which we assume to be the centre of the subsurface gas escape pathway. The distribution of the gas flares in 2005 (AL 267) was similar to the observations made in 2002 (HE180; Niemann et al., 2005). Previous expeditions to the Tommeliten seepage area used remotely operated vehicles (ROVs) for bottom observations and sampling, and documented streams of 20
single methane bubbles of thermogenic origin (δ13C −45.6‰), small patches of mi-crobial mats and methane derived authigenic carbonates outcropping at the sea floor (Hovland and Sommerville, 1985; Hovland and Judd, 1988; Trasher et al., 1996; Nie-mann et al., 2005). Our observations by ROV in 2005 confirmed that most gas flares originated from small holes (1–5 cm diameter) in the seafloor emitting single streams 25
BGD
5, 971–1015, 2008
Methane seepage in the North Sea G. Wegener et al. Title Page Abstract Introduction Conclusions References Tables Figures ◭ ◮ ◭ ◮ Back Close
Full Screen / Esc
Printer-friendly Version Interactive Discussion
diameter, Fig. 3b). We sampled three cores from such bacterial mats. The recov-ered sediments below the mats were highly gassy and consisted of fine sands. In contrast, sediments a few meters away from the gas flares consisted of consolidated, hardly permeable marls enclosing layers of unsorted silt and sands above carbonate cements (Niemann et al., 2005). Accordingly, gas migration from the subsurface to 5
the seabed may be limited to sandy horizons between the impermeable clays, and the gas bubbling may further erode the fine grain fraction. Upon recovery, the cores from these sediments continued to release methane gas as verified by GC measurements. This indicates a high in situ gas pressure in the seabed. At a water depth of 75 m the equilibrium methane concentrations in the interstitial waters in the direct vicinity of the 10
gas ebullition sites could be around 12 mM.
8.2 Methane and sulfate turnover
The sample from a black patch from which gas escape was observed was composed of silty sediments, and contained little TOC of 0.22 to 0.32% w/w. Due to the small amount of sediment recovered, we could not measure AOM and SR rates. It can be 15
assumed that the rates are locally very high due to the saturation with gas and the flux of sulfate from overlying bottom water into the bubble sites. However, for the subsurface sulfate methane transitions zones (SMTZ) associated with the gas-migration pathways at Tommeliten, Niemann et al. (2005) showed low AOM and SR rates of a few nmol cm−3 d−1, resulting in ca 50 g CH4m
−2
yr−1, or 0.3 t yr−1 for the whole seep area of 20
ca. 6500 m2. In comparison, the gas ebullition from the same site was estimated with 47 g CH4m
−2
yr−1 (Hovland et al., 1993) suggesting a 50% efficiency of the microbial filter against methane. The higher methane consumption efficiency compared to Gull-faks could be due to the impermeable nature of the Tommeliten sediments allowing only for few gas leakage pathways.
BGD
5, 971–1015, 2008
Methane seepage in the North Sea G. Wegener et al. Title Page Abstract Introduction Conclusions References Tables Figures ◭ ◮ ◭ ◮ Back Close
Full Screen / Esc
Printer-friendly Version Interactive Discussion
8.3 Biomarker and carbon isotope signatures
Similar to surface sediments at Gullfaks, monounsaturated fatty acids were also the dominant biomarker fraction in the surface sediments from the Tommeliten gas vents (Table 2). However, concentrations of these and other bacteria lipids were lower in comparison to the mat-covered sands at Gullfaks. The fatty acid distribution suggests 5
the presence of sulfide oxidizing bacteria, but the ratio of C16:1ω7c to C18:1ω7c to C16:0
(42:32:26) indicated a lower contribution to total bacterial biomass than in the Gullfaks sands.
In comparison to the Gullfaks seeps, the sediments from the Tommeliten gas vents contained similar amounts of archaeol but even more sn2-hydroxyarchaeol, indicating 10
the dominance of ANME-2 populations. Both archaeol and sn2-hydroxyarchaeol were less depleted than at Gullfaks with δ13C values of −86‰ and −90‰. However, consid-ering the heavier isotopic signature of the source methane at Tommeliten (δ13C CH4 −46‰ Hovland 2002), a stable carbon isotope fractionation of the lipid biomass rela-tive to source methane of more than 40‰ typical for AOM and comparable to that at 15
Gullfaks was found.
The specific biomarkers for SRB associated with AOM such as C16:1ω5c, i-C15:0,
and cy-C17:0 were similar in ratio but less abundant than at Gullfaks. The δ 13
C-values of C16:1ω5c and cy-C17:0 were relatively depleted with −51‰ and −59‰, re-spectively, whereas ai-C15:0 showed substantially less depleted carbon isotope signa-20
tures of −34‰. Interestingly, the surface seep sediments at Tommeliten resembled the biomarker signatures in the authigenic carbonate outcrops, but differed substantially from subsurface sediments (Niemann et al., 2005). In the deep SMTZ Niemann et al. (2005) found a dominance of ANME-1 communities as indicated by the dominance of archaeol over hydroxyarchaeol and a typical fatty acid pattern typical for sulfate re-25
ducing partners of ANME-1 (Blumenberg et al. 2004; Niemann and Elvert, in press; Niemann et al., 2005). These results correlated with 16 S rRNA and FISH analyses (Niemann et al., 2005). We conclude that ANME-1 could be better adapted to the low
BGD
5, 971–1015, 2008
Methane seepage in the North Sea G. Wegener et al. Title Page Abstract Introduction Conclusions References Tables Figures ◭ ◮ ◭ ◮ Back Close
Full Screen / Esc
Printer-friendly Version Interactive Discussion
energy conditions characteristic for deep sulfate methane transition zones, whereas ANME-2 dominates the advection driven highly active surface zones as already ob-served in some deep water seeps (Knittel et al., 2005).
8.4 Microbial diversity and community composition based on 16 S rRNA gene analy-ses
5
Similar to Gullfaks, the bacterial 16 S rRNA gene sequence library (Table 3) and the selected sequences in the phylogenetic tree (Fig. 4) obtained from sediments of Tom-meliten showed a relatively high diversity of sulfate reducing bacteria including relatives of the uncultured Seep-SRB1 (ANME-2 partners), Seep-SRB2 (Eel2), and of
Desul-fobacterium anilini. Seep-SRB2 organisms have been retrieved from nearly all seep
10
sediments (e.g. Knittel et al., 2003; L ¨osekann et al., 2007; Mills et al., 2005; Orphan et al., 2001b). However, their function remains unknown since no isolates are available.
Desulfobacterium anilini relatives have been shown to oxidize different aromatic
hydro-carbons such as naphthalene or xylene and could also have a function in hydrocarbon degradation at this site (for an overview see Widdel et al., 2007). Also a high number 15
of clones related to Desulfobulbus were found. In cold seep sediments of the Haakon Mosby mud volcano (Barents Sea), the SRB community was dominated by such rel-atives of Desulfobulbus, which formed aggregates with anaerobic methanotrophs of the ANME-3 cluster (Niemann et al., 2006, L ¨osekann et al., 2007). Single ANME-3 cells and a few aggregates occurred in the Tommeliten cold seep sediments, but their 20
abundance was too low to analyze the potential bacterial partners.
As predicted by the biomarker signatures, the archaeal gene sequence library of Tommeliten contained mainly relatives of ANME-1 and ANME-2c (Fig. 5). These were most closely related to sequences retrieved from gas hydrate bearing sediments such as the Eel River Basin, Hydrate Ridge, and the Gulf of Mexico. ANME-2a sequences 25
were not represented in the clone library, although ANME-2a aggregates were detected by CARD-FISH (see below).
BGD
5, 971–1015, 2008
Methane seepage in the North Sea G. Wegener et al. Title Page Abstract Introduction Conclusions References Tables Figures ◭ ◮ ◭ ◮ Back Close
Full Screen / Esc
Printer-friendly Version Interactive Discussion
the top layer of sediment and hence were comparable to the cell numbers at Gullfaks. With depth, cell numbers decreased to 3.0×10⁹ cell ml−1 (6–10 cm). Quantification with CARD-FISH indicated the presence of ANME-2a, ANME-2c and low numbers of ANME-3 single cells and aggregates. Sulfate reducing bacteria were highly abundant comprising up to one third of total single cells.
5
Hence, the microbial communities in gassy sediments below thiotrophic mats of both seep sites in the North Sea were dominated by anaerobic methanotrophs of the ANME-2 cluster, and their partner sulfate reducing bacteria. At Tommeliten, the AOM commu-nity in the mat covered surface sediments resembled more that of the Gullfaks seep and of the Tommeliten authigenic carbonates than that of the subsurface SMTZ community 10
(Niemann et al., 2005). The microbial communities also comprised sequences from other microorganisms typically occurring in methane rich deep-water seep ecosystems such as the crenarchaeotal Marine Benthic Group B. Gene libraries and CARD-FISH counts indicated also differences between Gullfaks and Tommeliten AOM communi-ties – such as the dominance of the ANME 2a cluster in Gullfaks cold seep sediments 15
and the dominance of ANME 2c at Tommeliten, which may be a result of the different geological and hydrological features of both sites.
9 The North Sea seeps in comparison to deep water cold seeps
At the shallow water seeps of the Northern North Sea, methane emission from deep reservoirs has been observed for more than 20 years. The habitats investigated here 20
are characterized by locally high advection of gaseous methane and ebullition of gas bubbles to the hydrosphere. Both Tommeliten and Gullfaks likely contribute to methane emission to the atmosphere as indicated by gas flares reaching to the upper mixed water layers. It would be an important future task to attempt quantification of gas emission to the atmosphere by monitoring flares and methane concentrations in the 25
flares and the overlying surface waters.
BGD
5, 971–1015, 2008
Methane seepage in the North Sea G. Wegener et al. Title Page Abstract Introduction Conclusions References Tables Figures ◭ ◮ ◭ ◮ Back Close
Full Screen / Esc
Printer-friendly Version Interactive Discussion
methane can reach concentrations of 12 mM and 25 mM, respectively. The highly permeable sands at Gullfaks allow the migration of gas bubbles through the sediment, leading to a relatively large seep area populated by methanotrophs and thiotrophs. The high upward advection of gas may restrict the downward diffusion of oxygenated bottom waters below a few cm, protecting the anaerobic methanotrophic communities, 5
which showed very high activities in the top 10 cm. In contrast, the compact silty sands of Tommeliten allow gas migration only through small cracks in the seafloor sediments, restricting the distribution of methanotrophs and thiotrophs to small patches around the gas vents. Phylogenetic analysis of Deltaproteobacteria and Euryarchaeota at Gullfaks and Tommeliten indicate a high similarity of these to sequences from deep water seep 10
sites, such as Hydrate Ridge (Boetius et al., 2000; Knittel et al., 2003; Knittel et al., 2005), Eel River Basin (Orphan et al., 2001b) or Guyamas Basin (Teske et al., 2002).
The concentrations of most of the AOM specific biomarker were about one order of magnitude lower at the investigated sites compared to deep water seep ecosystems such as Hydrate Ridge (Elvert et al., 2003) and Haakon Mosby Mud Volcano (Niemann 15
et al., 2006). This finding was reflected in the low number of ANME aggregates of around 106cm−3. In deep water cold seeps such as Hydrate Ridge, Haakon Mosby and Eel River Basin, ANME aggregate numbers reach 108, comprising a large fraction of the total microbial biomass (>90%) (Knittel et al., 2005). A reason for this difference in ANME biomass could be the higher availability of dissolved methane in deep water 20
seeps due to the increased solubility of methane at high hydrostatic pressures. Previ-ous experiments indicate that AOM rates and the energy yield available for growth are higher at elevated methane concentrations (Nauhaus et al., 2002; 2007), which may support higher biomasses of AOM consortia. A second explanation for lower aggre-gate sizes in the North Sea may be the high bottom water currents causing relocation of 25
particles, as well as sporadic oxygen influx into the sandy sediments. The only shallow water seeps known with higher biomass of ANME are the conspicuous methanotrophic microbial reefs of the Black Sea (Blumenberg et al., 2004; Treude et al., 2005). These lie in permanently anoxic waters and are hence protected from grazing.
BGD
5, 971–1015, 2008
Methane seepage in the North Sea G. Wegener et al. Title Page Abstract Introduction Conclusions References Tables Figures ◭ ◮ ◭ ◮ Back Close
Full Screen / Esc
Printer-friendly Version Interactive Discussion
10 Conclusions
Several gas seepages were mapped during the METROL cruises with R/V Heincke and Alkor. From these, we chose the two most active and accessible seepage ar-eas, Tommeliten and Gullfaks, for detailed surveys using geochemical and molecular tools. At Gullfaks a seepage area of about 0.1 km2 was characterized by a high den-5
sity of gas vents and extensive coverage by thiotrophic bacterial mats. At Tommeliten gas vents were less dense and the bacterial mat covered areas were limited to small patches around small holes in the seafloor emitting gas. The different permeability of the seabed at both seep sites could explain the observed differences in the effi-ciency of the microbial filter against methane. From both sites considerable amounts 10
of methane are emitted, some of which may reach the atmosphere as indicated by large gas flares reaching the upper mixed water layers. Specific biomarker and car-bon isotope signatures, as well as 16 S rDNA gene sequences and fluorescence in situ hybridization of specific microbial groups indicated that the bacterial mat covered sediments were populated by active communities of ANME-2 and their sulfate reducing 15
partner bacteria. Archaeal biomarkers were about 40‰ to 50‰ depleted in13C relative to the carbon source methane. Specific fatty acids of sulfate reducers involved in AOM were also considerably depleted in13C indicating that they partially assimilate methane derived carbon. The 16 S rRNA based gene libraries of both sites mostly included se-quences from known groups of deep water cold seep microorganisms, indicating that 20
water depth or other oceanographic conditions may not be limiting the dispersal of these groups. In contrast, distinct differences were found between the microbial com-munity in the mat covered surface sediments (dominated by ANME-2) to those of the subsurface sulfate methane transition zone at Tommeliten (dominated by ANME-1), suggesting that different energy availabilities may select for different methanotrophic 25
communities.
Acknowledgements. This study was conducted as part of the METROL project (http://www.
(EVK-3-CT-2002-BGD
5, 971–1015, 2008
Methane seepage in the North Sea G. Wegener et al. Title Page Abstract Introduction Conclusions References Tables Figures ◭ ◮ ◭ ◮ Back Close
Full Screen / Esc
Printer-friendly Version Interactive Discussion 00080). We thank captain, crew and shipboard scientists of R/V Heincke cruise HE-169 HE-180
and HE-208 and R/V Alkor cruise AL-267 for their excellent support of work at sea. We thank G. Wendt, J. Wunderlich (INNOMAR), J. Gutt, I. V ¨oge (AWI), F. Wenzh ¨ofer, M. Viehweger, V. Beier, T. Wilkop, I. Busse (MPI), N. Nowald (MARUM) as well as R. Usbeck, W. Dimmler, S. Gauger (FIELAX) for technical support and laboratory work, and A. Judd for important
infor-5
mation on seep structures of the North Sea.
References
Amann, R. I., Krumholz, L., and Stahl, D. A.: Fluorescent-oligonucleotide probing of whole cells for determinative, phylogenetic, and environmental studies in microbiology, J. Bacteriol., 172(2), 762–770, 1990.
10
Biddle, J. F., Lipp, J. S., Lever, M. A., Lloyd, K. G., Sørensen, K. B., Anderson, R., Fredricks, H. F., Elvert, M., Kelly, T. J., Schrag, D. P., Sogin, M. L., Brenchley, J. E., Teske, A., House, C. H., and Hinrichs, K. U.: Heterotrophic Archaea dominate sedimentary subsurface ecosystems off Peru, Proc. Natl. Acad. Sci., 103(10), 3846–3851, 2006.
Blumenberg, M., Seifert, R., Reitner, J., Pape, T., and Michaelis, W.: Membrane lipid patterns
15
typify distinct anaerobic methanotrophic consortia, Proc. Natl. Acad. Sci., 101(30), 11 111– 11 116, 2004.
Boetius, A. Ravenschlag, K., Schubert, C. J., Rickert, D. Widdel, F., Gieseke, A., Amann, R., Jørgensen, B. B., Witte, U., and Pfannkuche, O.: A marine microbial consortium apparently mediating anaerobic oxidation of methane, Nature, 407, 623–626, 2000.
20
Daims, H., Bruhl, A., Amann, R., Schleifer, K. H., and Wagner, M.: The domain-specific probe EUB338 is insufficient for the detection of all Bacteria: Development and evaluation of a more comprehensive probe set, Syst. Appl. Microbiol., 22(3), 434–444, 1999.
Dando, P. R., Bussmann, I., Niven, S. J., O’Hara, S. C. M, Schmaljohann, R., and Taylor, L. J.: A methane seep area in the Skagerrak, the habitat of the pogonophore Siboglinum poseidoni
25
and the bivalve mollusc Thyasira sarsi, Mar. Ecol. Prog. Ser., 107, 157–167, 1994.
Eisma, D. and Kalf, J.: Dispersal, concentration and deposition of suspended matter in the North Sea, J. Geol. Soc. London., 144, 161–178, 1987.
Mem-BGD
5, 971–1015, 2008
Methane seepage in the North Sea G. Wegener et al. Title Page Abstract Introduction Conclusions References Tables Figures ◭ ◮ ◭ ◮ Back Close
Full Screen / Esc
Printer-friendly Version Interactive Discussion brane Fatty Acids as Chemotaxonomic Markers for Sulfate-Reducing Bacteria Involved in
Anaerobic Oxidation of Methane, Geomicrobiol. J., 20(4), 403–419, 2003.
Fang, J., Shizuka, A., Kato, C., and Schouten, S.: Microbial diversity of cold-seep sediments in Sagami Bay, Japan, as determined by 16S rRNA gene and lipid analyses, FEMS Microbiol. Ecol., 57(3), 429–441, 2005.
5
Hinrichs, K.-U., Hayes, J. M., Silva, S. P., Brewer, P. G., and DeLong, E. F.: Methane-consuming archaebacteria in marine sediments, Nature, 398, 802–805, 1999.
Hinrichs, K.-U. and Boetius, A.: The Anaerobic Oxidation of Methane: New Insights in Microbial Ecology and Biogeochemistry, in: Ocean Margin Systems, edited by: Wefer, G., Billett, D., and Hebbeln, D., Springer-Verlag, Berlin Heidelberg, 457–477, 2002.
10
Hovland, M.: On the self-sealing nature of marine seeps, Cont. Shelf. Res., 22(16), 2387–2394, 2002.
Hovland, M.: Discovery of prolific natural methane seeps at Gullfaks, northern North Sea, Geo-Mar. Lett., 27(2), 197–201, 2007.
Hovland, M., Gardner, J. V., and Judd, A. G.: The significance of pockmarks to understanding
15
fluid flow processes and geohazards, Geofluids, 2(2), 127–136, 2002.
Hovland, M. and Judd, A. G.: Seabed pockmarks and seepages. Graham and Trotham, Lon-don, 293 pp., 1988.
Hovland, M., Judd, A. G., Burke Jr., R. A.: The global flux of methane from shallow submarine sediments, Chemosphere, 26(1–4), 559–578, 1993.
20
Hovland, M. and Risk, M.: Do Norwegian deep-water coral reefs rely on seeping fluids? Mar. Geol., 198(1–2), 83–96, 2003.
Hovland, M. and Sommerville, J.H.: Characteristics of two natural gas seepages in the North Sea, Mar. Petrol. Geol., 4(2), 319–326, 1985.
Inagaki, F., Kuypers, M. M. M., Tsunogai, U., Ishibashi, J., Nakamura, K. Treude, T., Ohkubo,
25
S., Nakaseama, M., Gena, K., Chiba, H., Hirayama, H., Nunoura, T., Takai, K., Jorgensen, B. B., Horikoshi, K., and Boetius, A.: Microbial community in a sediment-hosted CO2lake of the southern Okinawa Trough hydrothermal system, Proc. Natl. Acad. Sci., 103(38), 14 164– 14 169, 2006.
Ishii, K., Mussmann, M., MacGregor, B. J., and Amann, R.: An improved fluorescence in situ
30
hybridization protocol for the identification of bacteria and archaea in marine sediments, FEMS Microbiol. Ecol., 50(3), 203–212, 2004
BGD
5, 971–1015, 2008
Methane seepage in the North Sea G. Wegener et al. Title Page Abstract Introduction Conclusions References Tables Figures ◭ ◮ ◭ ◮ Back Close
Full Screen / Esc
Printer-friendly Version Interactive Discussion Biol., 24(3), 189–201., 1974.
Joye, S. B., Boetius, A., Orcutt, B. N., Montoya, J. P., Schulz, H. N., Erickson, M. J., and Lugo S.: The anaerobic oxidation of methane and sulfate reduction in sediments from Gulf of Mexico cold seeps, Chemical Geology 205, 219–238, 2004.
Judd, A. G.: A global importance and context of methane escape from the seabed, Geo-Mar.
5
Lett., 23, 147–154, 2003.
Judd, A. and Hovland, M.: Seabed Fluid Flow: The Impact on Geology, Biology and the Marine Environment, Cambridge University Press, 492 pp., 2007.
Kallmeyer, J., Ferdelman, T. G., Weber, A., Fossing, H., and Jorgensen, B. B.: A cold chromium distillation procedure for radiolabeled sulfide applied to sulfate reduction measurements,
Lim-10
nol. Oceanogr. Meth., 2, 171–180, 2004.
Kane, M. D., Poulsen, L. K., and Stahl, D. A.: Monitoring the enrichment and isolation of sulfate-reducing bacteria by using oligonucleotide hybridization probes designed from environmen-tally derived 16S rRNA sequences, Appl. Env. Microbiol., 59, 682–686, 1993.
Knittel, K., Boetius, A., Lemke, A., Eilers, H., Lochte, K., Pfannkuche, O., Linke, P., and Amann,
15
R.: Activity, distribution, and diversity of sulfate reducers and other bacteria in sediments above gas hydrate (Cascadia margin, Oregon), Geomicrobiol. J., 20(4), 269–294, 2003. Knittel, K., L ¨osekann, T., Boetius, A., Kort, R., and Amann, R.: Diversity and Distribution of
Methanotrophic Archaea at Cold Seeps, Appl. Environ. Microbiol., 71, 467–479, 2005. Lane, D. J., Pace, B., Olsen, G. J., Stahl, D. A., Sogin, M. L., and Pace, N. R.: Rapid
Determi-20
nation of 16S Ribosomal RNA Sequences for Phylogenetic Analyses, Proc. Natl. Acad. Sci., 82(20), 6955–6959, 1985.
Levin, L. A.: Ecology of cold seep sediments: Interactions of fauna with flow, chemistry and microbes, in: ceanography and Marine Biology: An Annual Review., edited by: Gibson, R. N., Atkinson, R. J. A., Gordon, J. D. M., Taylor & Francis, London, UK, 1–46, 2005.
25
Llobet-Brossa, E., Rossello-Mora, R., and Amann, R.: Microbial Community Composition of Wadden Sea Sediments as Revealed by Fluorescence In Situ Hybridization, Appl. Environ. Microbiol., 64(7) 2691–2696, 1998.
L ¨osekann, T., Knittel, K., Nadalig, T., Fuchs, B. Niemann, H., Boetius, A., and Amann, R.: Diversity and Abundance of Aerobic and Anaerobic Methane Oxidizers at the Haakon Mosby
30
Mud Volcano, Barents Sea. Appl. Environ. Microbiol., 73(10), 3348–3362, 2007.
Ludwig, W. Strunk, O., Westram, R., Richter, L., Meier, H., Yadhukumar, Buchner, A., Lai, T., Steppi, S., Jobb, G., Forster, W., Brettske, I., Gerber, S., Ginhart, A. W., Gross, O., Grumann,