HAL Id: hal-00302695
https://hal.archives-ouvertes.fr/hal-00302695
Submitted on 2 Apr 2007HAL is a multi-disciplinary open access
archive for the deposit and dissemination of sci-entific research documents, whether they are pub-lished or not. The documents may come from teaching and research institutions in France or abroad, or from public or private research centers.
L’archive ouverte pluridisciplinaire HAL, est destinée au dépôt et à la diffusion de documents scientifiques de niveau recherche, publiés ou non, émanant des établissements d’enseignement et de recherche français ou étrangers, des laboratoires publics ou privés.
The potential importance of frost flowers, recycling on
snow, and open leads for Ozone Depletion Events
M. Piot, R. von Glasow
To cite this version:
M. Piot, R. von Glasow. The potential importance of frost flowers, recycling on snow, and open leads for Ozone Depletion Events. Atmospheric Chemistry and Physics Discussions, European Geosciences Union, 2007, 7 (2), pp.4521-4595. �hal-00302695�
ACPD
7, 4521–4595, 2007 The processes influencing ODEs M. Piot and R. von Glasow Title Page Abstract Introduction Conclusions References Tables Figures ◭ ◮ ◭ ◮ Back CloseFull Screen / Esc
Printer-friendly Version
Interactive Discussion
EGU
Atmos. Chem. Phys. Discuss., 7, 4521–4595, 2007 www.atmos-chem-phys-discuss.net/7/4521/2007/ © Author(s) 2007. This work is licensed
under a Creative Commons License.
Atmospheric Chemistry and Physics Discussions
The potential importance of frost flowers,
recycling on snow, and open leads for
Ozone Depletion Events
M. Piot1and R. von Glasow1,*
1
Institute of Environmental Physics, University of Heidelberg, Germany
*
now at: School of Environmental Sciences, University of East Anglia, Norwich, UK Received: 5 March 2007 – Accepted: 19 March 2007 – Published: 2 April 2007 Correspondence to: M. Piot (matthias.piot@iup.uni-heidelberg.de)
ACPD
7, 4521–4595, 2007 The processes influencing ODEs M. Piot and R. von Glasow Title Page Abstract Introduction Conclusions References Tables Figures ◭ ◮ ◭ ◮ Back CloseFull Screen / Esc
Printer-friendly Version
Interactive Discussion
EGU Abstract
We present model studies with the one-dimensional model MISTRA to investigate the potential role of frost flowers, recycling on snow, and open leads in the depletion of tro-pospheric ozone in the Arctic spring. In our model, we assumed frost flower aerosols to be the major source of bromine. We show that a major ozone depletion event can 5
be satisfactorily reproduced only if the recycling on snow of deposited bromine into gas phase bromine is assumed. In the model, this cycling is more efficient than the bromine explosion process and maintains sufficiently high levels of bromine to deplete ozone down to few nmol mol−1within four days. We assessed the influence of different surface combinations (open lead/frost flowers) on the chemistry in the model. Results 10
showed noticeable modifications affecting the composition of aerosols and the deposi-tion velocities. A model run with a series of coupled frost flower fields and open leads, separated by large areas of snow, showed results comparable with field observations. In addition, we studied the effects of modified temperature of either the frost flower field or the ambient airmass. A warmer frost flower field increases the relative humidity and 15
the aerosol deposition rate. The deposition/re-emission process gains in importance, inducing more reactive bromine in the gas phase, and a stronger ozone depletion. A decrease of 1 K in airmass temperature shows in our model that the aerosol up-take capacities of all gas phase species substantially increases, leading to enhanced uptake of acids from the gas phase. Consequently, the so-called bromine explosion 20
accelerated and O3mixing ratios decreased. In our model representation, variations in wind speed affected the aerosol source function and influenced the amount of bromine in the atmosphere and thus the ozone depletion strength. Recent studies have sug-gested the important role of the precipitation of calcium carbonate (CaCO3) out of the brine layer for the possible acidification of the liquid phase by acid uptake. Our 25
investigation showed that this precipitation is a crucial process for the timing of the bromine explosion in aerosols. Nevertheless, model runs with either 50% precipitation or complete precipitation displayed a relatively weak difference in ozone mixing ratios
ACPD
7, 4521–4595, 2007 The processes influencing ODEs M. Piot and R. von Glasow Title Page Abstract Introduction Conclusions References Tables Figures ◭ ◮ ◭ ◮ Back CloseFull Screen / Esc
Printer-friendly Version
Interactive Discussion
EGU
after four simulated days. By considering conditions typical for “Arctic Haze” pollution events at the start of the run we obtained a low pH in frost flower aerosols due to a greater mixing ratio of SO2, and a strong recycling efficiency via large aerosol num-ber concentration. The aerosol acidification during a haze event most likely intensifies the ozone depletion strength and occurrence. The comparison between our modeled 5
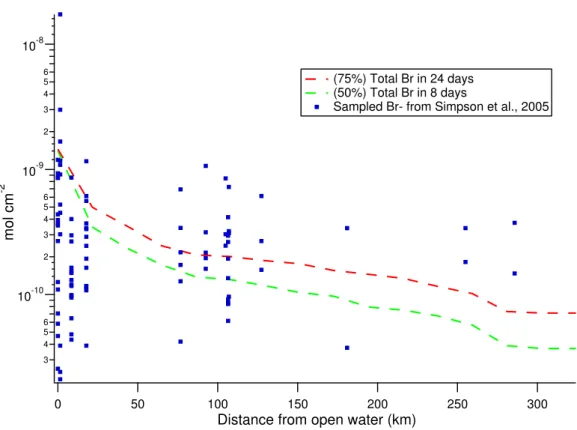
deposition on snow and sampled snow at Barrow (Alaska) shows that approximately 75% of deposited bromine may be re-emitted into the gas phase as Br2/BrCl. Among several non-halogen fluxes from the snow, model simulations showed that only HONO affects the chemistry. Finally, we investigated the release of Br2 potentially produced by heterogeneous reactions directly on frost flowers. In this case, we obtained un-10
realistic results of aerosol compositions and deposition rates on snow compared to observations in the Arctic.
1 Introduction
In the mid 1980s, events with extremely low ozone concentrations in the troposphere have been observed at several sites in the Arctic. It was first observed at Barrow, 15
Alaska (Oltmans,1981;Oltmans and Komhyr, 1986), later at Alert, Canada (
Botten-heim et al.,1986;Barrie et al.,1988;Mickle et al.,1989) and at other stations in the Arctic (Thule, Greenland; Ny- ˚Alesund, Spitsbergen). Similar observations were also reported in the Antarctic (Kreher et al., 1997;Roscoe et al.,2001;Tarasick and
Bot-tenheim,2002). However, a reanalysis of surface ozone measurements undertaken 20
during the International Geophysical Year (IGY) (MacDowall, 1960) in 1957–1958 at Halley Bay, Antarctic, showed the presence of periodic ozone depletions already then (Roscoe and Roscoe,2006). According to current knowledge, these so-called Ozone Depletion Events (ODEs) occur regularly in polar boundary layers (PBL) in spring, both in the Arctic and Antarctic. The near-total depletions of ozone last several hours to 25
several days. This might significantly impact the global tropospheric ozone budget. Measurements made byBarrie et al.(1988,1989) andBottenheim et al.(1990)
sug-ACPD
7, 4521–4595, 2007 The processes influencing ODEs M. Piot and R. von Glasow Title Page Abstract Introduction Conclusions References Tables Figures ◭ ◮ ◭ ◮ Back CloseFull Screen / Esc
Printer-friendly Version
Interactive Discussion
EGU
gested that tropospheric ozone depletions might be related to Br atom chain reactions. Their collections of aerosol samples by cellulose filters have highlighted a striking cor-relation between high concentrations of filterable bromine and a corresponding ozone destruction (see also Lehrer et al., 1997; Langend ¨orfer et al., 1999). Subsequently BrO has been measured byHausmann and Platt (1994) by the use of long-path Dif-5
ferential Optical Absorption (DOAS) instruments. Lehrer et al.(1997) showed a clear positive correlation between filterable bromine in aerosols and BrO. More recently, measurements of column BrO from the GOME satellite instrument showed that signif-icant concentrations were observable over large scale areas in Arctic spring (Wagner
and Platt,1998;Richter et al.,1998;Wagner et al.,2001;Hollwedel et al.,2004). Later 10
on, substantial molecular halogen concentrations of Br2 and BrCl were measured at Alert, Canada (Foster et al.,2001;Spicer et al.,2002). They varied from values close to the detection limit (∼0.2 ppt) to 30–35 ppt in a range of hours during periods of ODEs, while Cl2was not observed above its detection limit of about 2 ppt.
It is now widely accepted that the bromine catalytic reaction cycles in the gas phase 15
are responsible for the ozone destruction via three main cycles. Under high BrO con-centrations, the self reaction of BrO is dominant:
Cycle I: 2(O3+ Br −→ BrO + O2) (1) BrO + BrO −→ 2 Br + O2 (2) 20 −→ Br2+ O2 (3) Br2−→ 2 Brhν (4) Net: 2 O3 −→ 3 O2 (5)
If enough chlorine is present, the interhalogen reaction between BrO and ClO might become a relevant pathway for recycling the halogen oxides (Le Bras and Platt,1995). 25
ACPD
7, 4521–4595, 2007 The processes influencing ODEs M. Piot and R. von Glasow Title Page Abstract Introduction Conclusions References Tables Figures ◭ ◮ ◭ ◮ Back CloseFull Screen / Esc
Printer-friendly Version Interactive Discussion EGU Cycle II: BrO + ClO −→ Br + Cl + O2 (6) −→ BrCl + O2 (7) −→ Br + OClO (8) Net: 2 O3−→ 3 O2 (9) 5
At smaller BrO levels, its reaction with HO2becomes relatively important: Cycle III: BrO + HO2−→ HOBr + O2 (10) HOBr−→ OH + Brhν (11) CO + OH O2 −→ HO2+ CO2 (12) 10 Net: O3+ CO −→ O2+ CO2 (13)
In order to sustain a significant amount of halogens in the gas phase, additional mech-anisms involving the liquid and solid phases (aerosols, quasi-liquid layers (QLL) on snow, ice crystals/snow) are necessary to activate halides and recycle non-reactive gas phase halogens. In the early 1990sFan and Jacob (1992) and McConnell et al.
15
(1992) suggested the following important heterogeneous reaction path (X=Br, Cl) for the liberation of Br2 and BrCl from sea salt (based on data from Eigen and Kustin,
1962), involving HOBr found in Reaction (10): HOBraq+ X−
sea salt+ H+−→ BrXaq+ H2O (14)
H+ ions may be supplied by strong acids, such as HNO3and H2SO4mostly originating 20
from man-made emissions (see alsoMozurkewich,1995;Tang and McConnell,1996;
Vogt et al., 1996). The release of two bromine atoms out of the liquid phase from one gaseous Br (X=Br in Eq.14) atom is called “Bromine explosion” (Platt and Lehrer,
ACPD
7, 4521–4595, 2007 The processes influencing ODEs M. Piot and R. von Glasow Title Page Abstract Introduction Conclusions References Tables Figures ◭ ◮ ◭ ◮ Back CloseFull Screen / Esc
Printer-friendly Version
Interactive Discussion
EGU 1996). Later, these reaction cycles were studied in detail by numerical models (Sander
et al.,1997;Michalowski et al.,2000;Evans et al.,2003;Lehrer et al.,2004).
With sufficient NOx levels, the formation of halogen nitrates can substantially modify the availability of reactive bromine:
XO + NO2
M
−→ XONO2 (15)
5
X + NO2−→ XNO2 (16)
After its formation, XONO2 can either photolyse, decompose back to XO and NO2, or hydrolyse in water surfaces via:
XONO2H2O
−→ HOX + HNO3 (17)
Also,Sander et al. (1999) suggested that XONO2 can heterogeneously react on the 10
surface of aerosols without the need for acidity to convert halides into photolysable compounds:
XONO2+ X−aq−→ X2,aq+ NO−3,aq−→ X2 (18)
XONO2+ Y−
aq−→ XYaq+ NO−3,aq−→ XY (19)
but the reaction rate of these activation pathways remains small (about 100 times less 15
efficient than Reaction (14) under Arctic conditions).
These heterogeneous reactions activating bromide ions (Br−) are needed to sustain the autocatalytic destruction of ozone. Indeed, both laboratory and modeling studies showed that observations can only be explained if both gas phase and heterogeneous reactions are taken into account (McConnell et al.,1992;Sander et al.,1997;Kirchner
20
et al.,1997;Fickert et al.,1999;Michalowski et al.,2000). However, it can be easily demonstrated that sea salt aerosols are a minor contributor to gas phase bromine (see
Sander et al.,1997;Michalowski et al.,2000;Lehrer et al.,2004).
Several sources for bromine were suggested in the literature. The presence of high concentrations of biological bromoform in April (spring bloom) was proposed to be 25
ACPD
7, 4521–4595, 2007 The processes influencing ODEs M. Piot and R. von Glasow Title Page Abstract Introduction Conclusions References Tables Figures ◭ ◮ ◭ ◮ Back CloseFull Screen / Esc
Printer-friendly Version
Interactive Discussion
EGU
linked to the destruction of ozone (Barrie et al., 1988;Sturges et al.,1992). But the CHBr3mixing ratio is too small and its photodissociation is too slow (JCHBr3∼10−6s−1,
Moortgat et al., 1993). Growing evidence from observations highlighted the impor-tance of the snowpack and models satisfactorily underlined its role for the heteroge-neous halogen chemistry (Tang and McConnell,1996;Michalowski et al.,2000;Lehrer
5
et al.,2004), but the geographical occurrence of ODEs cannot be fully explained with the simple presence of snow and aerosols. Studies on first-year sea ice highlighted its potential importance in providing adequate halogen-enriched surfaces with a likely role of frost flowers (FF) as they are promising candidates for supplying bromine com-pounds into the air. The study from Kaleschke et al. (2004) using back-trajectories 10
associated with a thermodynamic model to simulate areas potentially covered by frost flowers (PFF) revealed a strong correlation between PFF-impacted air and GOME BrO maps. This might indicate an implication of frost flowers (also seeJacobi et al.,2006). However, very recently,Simpson et al. (2007) measured that high levels of BrO were more correlated to first-year sea ice than PFF.
15
Rankin et al.(2000) calculated that frost flower aerosol production in a sea-ice zone dominates the sea salt aerosol production by the bubble bursting mechanism (e.g.
Pruppacher and Klett, 1997). In a further study, they mentioned a large FF total sur-face area which enhances exchange and chemical heterogeneous reactions with the ambient air (Rankin et al., 2002). In contrast, Domin ´e et al. (2005) showed by use 20
of a volumetric method and CH4 adsorption (see Legagneux et al., 2002) that FFs are unlikely to provide additional surface area relative to the ice surface. Thus, the uncertainties regarding the role of FFs remain large.
Frost flowers consist of multiple crystal needles and naturally grow on freshly-formed (sea) ice under very cold and calm weather conditions by addition of water vapor from 25
the ambient air. They start their growth in the vicinity of open cracks (T≃271 K) over ocean or fresh water when the forming ice reaches a thickness of 5–8 mm (Martin
et al.,1995). During sea ice formation, the thermodynamical upward transport of sea salt from the ice interior toward the surface, called “brine rejection”, leads to the
accu-ACPD
7, 4521–4595, 2007 The processes influencing ODEs M. Piot and R. von Glasow Title Page Abstract Introduction Conclusions References Tables Figures ◭ ◮ ◭ ◮ Back CloseFull Screen / Esc
Printer-friendly Version
Interactive Discussion
EGU
mulation of a brine layer on top of the new sea ice (Richardson and Keller,1966) on which frost flowers can grow (seeMartin et al.,1995). This brine layer has been ob-served to persist at temperatures as low as the required temperature of −10 to −20◦C for the FF formation (Cho et al.,2002). However, ionic fractionation occurs at such tem-perature (Richardson and Keller,1966). Ions contained in the brine migrate toward the 5
crystal branches of the frost flowers through the quasi-liquid layer due to concentration gradients and thermo-migration via the Ludwig-Soret effect (Kempers,1989;Hafskjold
et al.,1993;Zhang et al.,1996). FF salinities have been measured at up to 115 g/kg in the Arctic (Perovitch and Richter-Menge,1994;Rankin et al.,2002) compared to an average of 35 g/kg for sea water.
10
There is growing evidence from field measurements that the processes related to the formation of FFs could provide adequate surfaces for the liberation of particles from the quasi-liquid layers under wind stress. Wagenbach et al. (1998) observed low concentrations of sulfate in airborne particles at Neumayer. By comparing the ra-tio [SO2−4 ]:[Na+] in aerosols and in sea water, they found that the aerosols originated 15
from sea ice surfaces where mirabilite (Na2SO4) had to be precipitated. Daily aerosol samples commonly showed deficits in SO2−4 of about 60–80% during cold seasons. Laboratory experiments confirmed this fractionation on the ice pack and emphasized its rise with decreasing temperature (Koop et al.,2000). Similarly,Rankin et al.(2000) collected frost flowers and observed analogous depletions in sulfate and sodium rel-20
ative to sea water concentrations. These results suggest that particles observed by
Wagenbach et al.(1998) are likely to originate from the brine (including FF).Simpson
et al. (2005) found that frost flowers provide limited enhancements in direct hetero-geneous exchange compared to other Arctic surfaces. Also, they found that bromide release rather develops subsequent to production of aerosols from FFs. These studies 25
underline the obvious need to better understand the complete mechanisms releasing such particles.
In Sect.2we describe the model setup and sensitivity runs. In Sect.3, we assess the potential influence of FF aerosols by detailed model studies under different chemical
ACPD
7, 4521–4595, 2007 The processes influencing ODEs M. Piot and R. von Glasow Title Page Abstract Introduction Conclusions References Tables Figures ◭ ◮ ◭ ◮ Back CloseFull Screen / Esc
Printer-friendly Version
Interactive Discussion
EGU
and meteorological conditions. In particular, we studied the impact of different surface sequences of open lead and FF, meteorological parameters, the role of halogen recy-cling from snow as well as the influence of emissions that have been measured from snow. Direct heterogeneous reactions on frost flowers themselves are also discussed. A summary and some concluding remarks are given in the last section of this paper. 5
2 Model description and setup
We used the one-dimensional model MISTRA (von Glasow et al.,2002a,b;von Glasow
and Crutzen,2004) which was initially developed as a model of the marine boundary layer (MBL) and modified it to reproduce Arctic conditions. MISTRA describes mi-crophysical processes and focuses on the interaction of gas phase and particulate 10
phase (sea salt and sulfate aerosol) chemistry. The chemical mechanism contains the most important reactions of O, H, C, N, S, Cl, and Br both in the gas and par-ticulate phase, with a focus on halogen species. The initial gas phase mixing ratios (ξ) are based on observational data at Arctic sites, during spring (Table1). The gas phase chemistry mechanism has been updated fromvon Glasow and Crutzen(2004) 15
and extended by reactions including alkyl nitrate (RONO2) and biogenic alkyl bro-mide (CHBr3, CH3Br), based on the IUPAC compilation (February 2006, available from
http://www.iupac-kinetic.ch.cam.ac.uk/). The complete mechanism consists of 169 gas phase reactions and 150 aqueous phase reactions, 60 phase exchange reactions, 13 heterogeneous reactions and 21 equilibria for both sulfate and sea salt aerosols. It is 20
available as electronic attachment to this paper (http://www.atmos-chem-phys-discuss.
net/7/4521/2007/acpd-7-4521-2007-supplement.pdf).
We used MISTRA in a “Lagrangian mode” where a column of 2000 m height moves across a pre-defined sequence of surfaces: snow, FF, and open lead (see Fig. 1). In the remainder of this paper we only discuss the evolution of the chemistry in the 25
lowest 1000 m, subdivided into 100 equidistant layers. All presented model runs last 4 days which are preceded by a 2-day spin-up of the meteorology; temperature, relative
ACPD
7, 4521–4595, 2007 The processes influencing ODEs M. Piot and R. von Glasow Title Page Abstract Introduction Conclusions References Tables Figures ◭ ◮ ◭ ◮ Back CloseFull Screen / Esc
Printer-friendly Version
Interactive Discussion
EGU
humidity, particle size distribution, and inversion height are explicitely calculated. All runs start at midnight where the chemistry is initialized with the values given in Table1. The initial boundary layer height is 300 m as often observed in the Arctic at this period of the year (Hopper and Hart,1994;Hopper et al.,1998;Ridley et al.,2003).
Based on King and Turner (1997) we chose an albedo of 0.8 corresponding to a 5
typical snow-covered area of the Arctic spring. Photolysis rates are calculated online with the model ofLandgraf and Crutzen(1998).
We prescribe a temperature of 245 K for the snow surface which is typical for the Arctic in early spring (Jobson et al., 1994; Hopper et al., 1994, 1998; Ridley et al.,
2003). The resulting temperatures in the boundary layer remain above 240 K. Koop
10
et al. (2000) showed experimentally that sea salt aerosols stay aqueous down to about 240 K. Therefore, we assume the aerosol particles to be liquid in all layers of our model. All particles above their deliquescence humidity (70% and 75% of relative humidity for sulfate and sea salt aerosols, respectively) are treated as aqueous solutions. The same holds for particles that had been activated or have been released as droplets 15
above their crystallisation humidity (40% and 42%, respectively). For a detailed de-scription of the aerosol characteristics, seevon Glasow et al.(2002b). In a sensitivity study we investigated the importance of pollution levels (gas and aerosol particles) as observed under “Arctic Haze” conditions (Mitchell, 1957;Saw,1984; Barrie et al.,
1989). The initial size distribution of the haze particles is given in Table2. The haze 20
aerosol composition is based on the molar fraction fromHoff et al.(1983), calculated for a mean particle diameter of 0.22µm. Gas phase mixing ratios are modified according to ground-based measurements during a haze event (Table1).
2.1 Frost flowers
We assume that the particles released from the quasi-liquid layers present on the FF 25
branches constitute our “FF aerosols”. A particularly critical need is a parameterization for the FF aerosol production which so far is not available. As a rough approximation we used the expression fromMonahan et al. (1986) that was developed for the
pro-ACPD
7, 4521–4595, 2007 The processes influencing ODEs M. Piot and R. von Glasow Title Page Abstract Introduction Conclusions References Tables Figures ◭ ◮ ◭ ◮ Back CloseFull Screen / Esc
Printer-friendly Version
Interactive Discussion
EGU
duction of sea salt aerosols. We adjusted it with a scaling factorµ to reproduce typical measured Arctic atmospheric bromine loadings.
The structure of FFs depends on the wind strength. At wind speed of about 6– 7 m s−1, saltation of snow grains initiates (King and Turner,1997). One might think that FFs are fragile bodies and that they break apart at such wind speeds. However, ac-5
cording to observations on Spitzbergen (Norway) made by F. Domin ´e (personal com-munication), the major body of FFs can withstand moderate storms without radical modification of its structure. Therefore, when saltation occurs, snow might start accu-mulating on the FF crystals, altering their structure, composition or total surface area.
As evident from Reaction (14) the autocatalytic release of bromine from salt particles 10
depends on the acidity of the particles. Ocean water, which is the source of sea salt particles and the brine layer on top of new sea ice, is strongly buffered with HCO−
3 to a pH of about 8.1. Sander et al.(2006) suggested that the precipitation of CaCO3 out of the brine (nearly complete at temperatures below 265 K) would reduce this buffer in the brine which would facilitate the release of bromine according to Reaction (14) 15
under clean conditions with little available acidity. Papadimitriou et al. (2003) exper-imentally showed that calcium carbonate precipitates during new sea ice formation. CaCO3 starts to precipitate at a temperature of −2.2◦C (Anderson and Jones,1985;
Marion,2001). Below −6.7◦C, phosphate, known as inhibitor of the nucleation of cal-cium carbonate, prevents CaCO3precipitation (seeBischoff et al.,1993). We included 20
this process in the model by adjusting the initial HCO−3 concentration in FF aerosols from 0% to 100% of its concentration in sea water. After depletion of the alkalinity, subsequent uptake of gaseous acids such as HNO3, H2SO4 or HCl then causes an earlier start of the acidification of the particles and thus the bromine explosion. The temperature of the FFs is subject to vertical as well as horizontal temperature gradi-25
ents between open water and air. Its mean is estimated at 255 K (seeRankin et al.,
2002). Based on aerosol composition measurements from Wagenbach et al. (1998) and FF composition results fromRankin et al.(2000), we consider the FF aerosols and the QLL to be sulfate free for such a low prescribed temperature. Since there is very
ACPD
7, 4521–4595, 2007 The processes influencing ODEs M. Piot and R. von Glasow Title Page Abstract Introduction Conclusions References Tables Figures ◭ ◮ ◭ ◮ Back CloseFull Screen / Esc
Printer-friendly Version
Interactive Discussion
EGU
little information about the accurate multi-dimensional FF composition, we assumed an homogeneous concentration of halogen ions on FFs, three times higher than in stan-dard sea water (Drinkwater and Crocker,1988; Perovitch and Richter-Menge,1994;
Simpson et al.,2005).
In order to study the effect of FF aerosols specifically, all runs are initialized with 5
aged sulfate particles only (i.e. no salt aerosols present at the start of the runs). The only sources for salt aerosols in the model are the release of FF aerosols and sea salt aerosols from the open lead. For all presented runs, FF aerosols are released for a total period of two hours which corresponds in the Lagragian perspective to a FF field of 36-km extension (the typical horizontal wind speed is 5 m s−1in the model). 10
It is important to stress that even though we talk about aerosols produced from FFs throughout the paper, all effects would be the same if the source of salt aerosols were a different, brine-related source.
2.2 Open leads
Spring is a common period for the observation of open leads (OL) due to ocean cur-15
rents or wind stress on ice sheets. Leads and polynyas can occupy up to 12% of the Arctic ice area (Gloersen and Campbell, 1991) and provide a source region for sea salt aerosols. Water vapor over those leads exerts a major control on the regional en-ergy budget through cloud formation and radiative effects (Dethleff,1994;Leaitch et al.,
1994;Strunin et al.,1997;Morales Maqueda et al.,2004). Moisture fluxes over sea wa-20
ter induce significant growth of aerosol particles, changing the particle composition and the gas-particulate partitioning. We compared sensible and latent heat fluxes as well as the turbulent kinetic energy flux in our model with values from field data (Strunin
et al., 1997; Hartmann et al., 1999; Georgiadis et al., 2000; Argentini et al., 2003). The comparison showed satisfactory agreements (in MISTRAω′T′OL≃300 W m−2and 25
ω′q′OL≃45 W m−2; data from Hartmann et al. (1999): ω′T′
open water≃300−350 W m−2 and ω′q′
ver-ACPD
7, 4521–4595, 2007 The processes influencing ODEs M. Piot and R. von Glasow Title Page Abstract Introduction Conclusions References Tables Figures ◭ ◮ ◭ ◮ Back CloseFull Screen / Esc
Printer-friendly Version
Interactive Discussion
EGU
tical mixing over open cracks due to temperature and humidity differences between packed ice and open water. We prescribe a temperature of 271 K for the open water. This high surface temperature, compared to an air surface temperature of 245 K, in-duces a strong convection in the boundary layer. Due to increased evaporation, the specific humidity above such an open lead is about an order of magnitude higher than 5
over snow (2.5×10⁻³ compared to 2.2×10⁻⁴kg
aqkg−1air). A noticeable feature of open leads is that they are also a source for marine gases such as DMS and NH3. As FF occurrence is closely related to the presence of leads we investigated their importance on the chemistry and the aerosol composition (see Sect.3.2).
We performed a sensitivity study on the open lead extension from 5 min (1.5 km 10
with a wind speed of 5 m s−1) to 1 h (18 km). For low aerosol liquid water contents (LWCa), the particle radius and mass and therefore the deposition are low. If LWCa increases, aerosol deposition on the ground increases as well. This is in accordance with aerosol loss over open sea and cracked ice estimated by Strunin et al.(1997). When extending the size of the lead, the maximum LWCa increases and can lead to 15
cloud droplet formation. When a cloud forms, the change in uptake capacity of the aerosols and droplets greatly modifies the atmospheric chemical composition. This effect will be discussed in detail later. For an OL duration not exceeding 10 min, LWCa
in the boundary layer increases but no cloud forms in the model. For an OL of 15 min (4.5 km), the humidity flux is sufficient to result in the formation of a thin cloud on the top 20
of the BL. The maximum LWC reaches up to 5×10⁻³g m−3 but decreases after 30 min due to the decrease in relative humidity. The cloud droplets also evaporate within 30 min. Greater open lead extensions induce stronger growth of the cloud thickness and longer persistence of the activated particles. For most of our model runs, we chose an OL duration of 10 min leading to a large LWCa (and thus deposition) but no cloud 25
ACPD
7, 4521–4595, 2007 The processes influencing ODEs M. Piot and R. von Glasow Title Page Abstract Introduction Conclusions References Tables Figures ◭ ◮ ◭ ◮ Back CloseFull Screen / Esc
Printer-friendly Version
Interactive Discussion
EGU
2.3 Fluxes of gases from the snow
Observations in the Arctic have shown that with increasing availability of sunlight after the polar sunrise, the snowpack produces a series of reactive species in the gas phase, including HCHO (Fuhrer et al.,1996;Hutterli et al.,1999), HONO (Honrath et al.,1999;
Ridley et al.,2000;Zhou et al.,2001;Jacobi et al.,2004), and H2O2(Sumner and
Shep-5
son,1999;Hutterli et al.,2001). We include the reported values of surface fluxes in our model (see Table3), adjusted with a diurnal variation for observed light-dependent species (all but ethene). Fluxes are switched off when the solar zenith angle is greater than 88◦.
When no literature value is available for the Arctic spring, emission rates are es-10
timated by comparing photolysis rates (J) between the period of measurements and springtime. For NO and NO2 we used JNO−
3 as NO
−
3 is the precursor for NOx produc-tion in snow interstitial air (Honrath et al.,1999,2000a,b;Wolff et al.,2002). JH
2O2 and JHCHOare used to obtain spring values for hydrogen peroxide and formaldehyde fluxes. All prescribed fluxes from snow are included in all model simulations except for those 15
discussed in Sect.3.7.
Measurements made in the Arctic above the snowpack have shown the production of Br2 and BrCl (Foster et al.,2001;Spicer et al.,2002). Independently,Peterson and
Honrath (2001) speculated that recycling of bromine species in interstitial air is a rather fast process. In order to investigate the importance of this release, we performed model 20
runs where deposited bromine compounds (both gas and particulate phases) are re-released to the gas phase. A detailed investigation of reactions on the snow surface or in the snow interstitial air, however, is beyond the scope of this study. The amount of bromine in snow is the limiting factor in the liberation of both Br2 or BrCl as the availability of Cl atoms is considered unlimited. We assume the deposited bromine to 25
be stochiometrically converted in the snowpack to Br2/BrCl with a 40/60 branching ratio (Kirchner et al.,1997). The fraction of re-emitted bromine, νsnow, is varied between 0 (no recycling) and 100% (complete recycling), and stays constant during a whole
ACPD
7, 4521–4595, 2007 The processes influencing ODEs M. Piot and R. von Glasow Title Page Abstract Introduction Conclusions References Tables Figures ◭ ◮ ◭ ◮ Back CloseFull Screen / Esc
Printer-friendly Version
Interactive Discussion
EGU
run. Note that the re-emission of gaseous Br2/BrCl from the ground leads to a “leap-frogging” process, consisting of series of deposition/re-emission of bromine as the air moves away from the source of bromine.
This process is in accordance with observations from Simpson et al. (2005). Also notice that compounds deposited on sea water (OL) are not re-released.
5
2.4 Model sensitivity studies
The model runs discussed in this paper are summarized in Table4. In all runs (except for the assessment of FFs during night) the model column traverses the FF field four hours after the model start (day 0, 04:00 local time), approximately 30 min after sunrise in order to start the production of FF aerosols at daytime. All parameters in the sen-10
sitivity studies have the same values as in the base model run unless stated explicitly otherwise.
In run 1 (base run) we chose the most realistic values for all parameters. As we compare all other runs to this one, we discuss it in greatest detail (Sect.3.1). Runs 2 to 7 are discussed to assess the impact of the recycling on snow and the presence 15
of a lead in the model. In order to evaluate the effect of FF aerosols during nighttime, the FF field is crossed by the model column on day 0, 00:00 local time (runs 8 and 9). Meteorological parameters were also investigated: the frost flower and ambient air temperatures were varied by 5 K and 1 K, respectively (runs 10 and 11). We evaluated the impact of a change in wind speed in run 12. The precipitation of bicarbonate 20
from the brine layer was suggested to be a key process for the acceleration of the bromine explosion (seeSander et al.,2006). We investigated the importance of this by assuming that only 50% or 0% is precipitated (run 13 and 14) as opposed to 100% in the base run. The characteristics of an Arctic Haze event were also investigated (run 15). We assessed the impact of the potential recycling efficiency from snow with 25
the parameterνsnow which controls the fraction of deposited bromine re-emitted from the snow as Br2/BrCl. Our study comprises values for νsnow of 0% (run 3), 25% (run 16), 50% (run 17) and 75% (run 1). The impact of non-halogen gases released from
ACPD
7, 4521–4595, 2007 The processes influencing ODEs M. Piot and R. von Glasow Title Page Abstract Introduction Conclusions References Tables Figures ◭ ◮ ◭ ◮ Back CloseFull Screen / Esc
Printer-friendly Version
Interactive Discussion
EGU
the snow shown in Table3has also been investigated. Only the role of the HONO flux in the bromine explosion is discussed (run 18). Finally, we will discuss the differences between the FF aerosols as the source of bromine and a direct release of gaseous Br2 from that field of FFs (run 19). Further details to the model sensitivity studies are given in the respective result sections.
5
To facilitate the discussion in this paper, we used the classification ofRidley et al.
(2003) to define the ODE types depending on ozone mixing ratios: partial ODE as 4<ξOzone≤20 nmol mol−1(PODE) and major ODE asξOzone≤4 nmol mol−1(MODE). To distinguish ODEs developing within one day from ODEs developing in four days, we used the abbreviation MODE1/MODE4 and PODE1/PODE4.
10
To better show the partitioning of bromine between the different phases we define the following variables: TCg: 1000 m model column (renamed “Total Column”) concen-tration of gas phase species containing Br atoms, TCa: same for sea salt and sulfate aerosols, TCd same for cloud droplets, IDBr: the accumulated irreversible deposition of bromine atoms or ions, and TCBr: the sum of the four previous parameters. These 15
parameters will be displayed in mol m−2.
3 Results and discussions
The discussion of the results is subdivided into eight parts. In Sect. 3.1 we discuss the base run to reproduce an ODE with the frost flowers aerosols being the source for bromine. (see Fig.1for a schematic depiction of the model runs). Different sequences 20
of FF fields and open leads as surfaces are examined (Sect. 3.2) as well as the im-pact of temperature and wind speed on the production of FF aerosols (Sect.3.3). In Sect.3.4we examine the impact of 50 or 100% of HCO−3 remaining in aerosols. Also, the effects of Arctic Haze are discussed (Sect.3.5). In Sect.3.6, we present results on the importance of gaseous halogen re-emission from the snow of both particulate and 25
gas phase bromine depositions. This is followed by a sensitivity study on the impact of non-halogen outgassing from the snow (Sect.3.7). Finally, in Sect.3.8, we discuss
ACPD
7, 4521–4595, 2007 The processes influencing ODEs M. Piot and R. von Glasow Title Page Abstract Introduction Conclusions References Tables Figures ◭ ◮ ◭ ◮ Back CloseFull Screen / Esc
Printer-friendly Version
Interactive Discussion
EGU
differences between the production of FF aerosols and a direct release of Br2from FFs that could help differentiate among direct or indirect release of reactive bromine from FFs.
3.1 Base case
In this model run (starting on day 0, after the two-day spin-up), the model column be-5
gins to cross a field of FFs at 04:00 local time. Aerosols, with no bicarbonate, are released from the FFs. These constitute the major source of bromine in the model. The field of FFs is with 36 km (corresponding to two hours where the model column moves with a wind speed of 5 m s−1) rather large. In order to release enough bromine for a major ODE to develop within four days (MODE4), the scaling factor for the FF 10
aerosol emission (see Sect.2.1) was chosen asµ=90 (PODE4 is reached with µ=60). The FF field is followed by an open lead of 10 min duration (equivalent to 3 km). Af-ter the open lead the model column moves over snow from which deposited gas and particulate bromine is re-emitted as gas phase Br2and BrCl (see Sect.2.3). The effi-ciency for the recycling of bromine is assumed to beνsnow=75%, based on model-field 15
data comparisons (see Sect. 3.6). Furthermore, the release of non-halogen species from the snowpack is included (see Table 3). In the following we provide a detailed interpretation of the base model run and will analyse the importance of the various assumptions in the next sections.
Some important features of the base run are shown in Fig.2. The strong tempera-20
ture difference between the open water (271 K) and the overlying air (245 K) leads to convection that penetrates the temperature inversion at around 300 m and leads to an extension of the mixed layer up to 400 m (Figs.2h to j). The relative humidity displays highest values at the top of the BL due to the decrease of temperature with height. FF aerosols are well mixed throughout the BL due to vertical air motion caused by the 25
increase of the surface temperature over the FF field and the OL (Fig.2h).
Liberation of Br2/BrCl from the FF aerosols starts subsequent to uptake of acids in particles and is more efficient at the top of the boundary layer due to smaller particle
ACPD
7, 4521–4595, 2007 The processes influencing ODEs M. Piot and R. von Glasow Title Page Abstract Introduction Conclusions References Tables Figures ◭ ◮ ◭ ◮ Back CloseFull Screen / Esc
Printer-friendly Version
Interactive Discussion
EGU
pH values at the top of the BL (see von Glasow and Sander, 2001). However, this release is slow and ozone is weakly depleted by this process only, as will become clear in the next paragraphs.
The five parameters TCg, TCa, TCd, IDBr and TCBr introduced in Sect. 2.4 are displayed in Fig.2l. TCg has a positive starting value due to the presence of bromo-5
form and methyl bromide in the atmosphere. IDBr shows a monotonically increasing behavior as it represents the accumulated deposition over time. In our model runs, deposited aerosol bromide is instantaneously re-emitted as gas phase bromine. This particulate-to-gas-phase conversion is therefore, withνsnow=75%, faster than the bro-mide liberation via the bromine explosion cycle from particles. Thus, the way that 10
halogen re-emission from the snow is treated in the model is clearly more efficient than the release from aerosols in terms of bromide liberation: TCg is closely correlated to the aerosol deposition on snow. When the LWCaand the deposition increase, the re-emission from the ground and TCg increase as well (under cloud-free conditions, as explained in Sect.2.2). Note that the correlation between deposited bromine and its 15
re-emission is directly related to the way our model was set up. The possible delay between deposition and recycling that can occur in/on snow at the field does not affect, in our model representation, the values given toνsnow.
In Fig.2a we distingish two regions of ozone in the BL before day 2: we used the ozone mixing ratio isopleth of 25 nmol mol−1 as an approximate separation of these 20
two regions (see black curve). The difference between the regions comes from the influence of the re-emission of bromine from the snow. Note that the natural deposition of ozone on the ground also contributes (by 13% after four days of simulation) to the removal of O3molecules near the surface. On day 0, the lowest layers of the BL (up to 100 m) are greatly disturbed by the re-emission of halogens from the ground. Ozone 25
is quickly depleted: over the first 12 simulated hours, the deposition/re-emission of bromine is strongest and leads to a maximum value of the ozone destruction rate of 2.15 nmol mol−1h−1. This destruction rate agrees well with the rate 2.4 nmol mol−1h−1 calculated by Platt (1997) based on measurements. Notably, substantial ozone
de-ACPD
7, 4521–4595, 2007 The processes influencing ODEs M. Piot and R. von Glasow Title Page Abstract Introduction Conclusions References Tables Figures ◭ ◮ ◭ ◮ Back CloseFull Screen / Esc
Printer-friendly Version
Interactive Discussion
EGU
pletion is found only several tens of kilometers downwind of the FF field (Fig. 2a). The ozone destruction on the first day can be classified as a PODE and occurs within 10 h. In the upper layers, the much smaller ozone destruction is a consequence of the bromine explosion cycle in aerosols. The strength of this cycle for gas phase bromine concentrations is weak compared to the re-emission of bromine from the ground: a 5
substantial amount of bromide in layers above 100 m remains in FF aerosols up to day 1, 12:00 (see dash-dotted green line in Fig. 2l) whereas bromide in the lowest layers is entirely liberated after 9 h.
Figure2k shows that aerosol bromide accounts for 95–99% of the modeled deposi-tion flux between 04:00 and 06:00 on day 0 (later, gaseous HOBr accounts for approxi-10
mately half of the deposition during daytime: the major components depositing at night are Br2and CHBr3). As the deposition flux (mostly composed of bromide) is strongest near the region of particulate halogen production from the FF field, re-emissions of Br2 and BrCl from the snow reach maxima of 3.2×10⁸ and 9.5×10⁸molec cm−2s−1, respectively, shortly after moving across the OL. At this time, halogen re-emission from 15
the snow rapidly initiates the bromine explosion in the lowest 100 m of the BL. After pho-todissociation of Br2, free Br radicals destroy ozone via the cycles mentioned before. The reaction product BrO exhibits a maximum of 48 pmol mol−1in the lowest layers on the first day (Fig.2d). This maximum is a consequence of two different processes: the re-emission of Br2/BrCl from the snow followed by photolysis and reaction with avail-20
able O3, and the induced bromine explosion acceleration which liberates bromine from the aerosol phase. After day 0, BrO mixing ratio decreases to values similar to field data (up to 30 pmol mol−1, see Hausmann and Platt,1994;Tuckermann et al.,1997;
Martinez et al., 1999; H ¨onninger and Platt, 2002; H ¨onninger et al., 2004). Vertical transport within the BL extends the presence of high bromine mixing ratios (Brx) along 25
the simulated days in the whole BL. In the first night (i.e. night between day 0 and 1), gas phase Br2and BrCl are replenished by several mechanisms in the absence of pho-tolysis and display mixing ratios of about 28 and 6 pmol mol−1 in the first 100 meters of the BL (Fig. 2c). Such concentrations are in the range measured by Foster et al.
ACPD
7, 4521–4595, 2007 The processes influencing ODEs M. Piot and R. von Glasow Title Page Abstract Introduction Conclusions References Tables Figures ◭ ◮ ◭ ◮ Back CloseFull Screen / Esc
Printer-friendly Version
Interactive Discussion
EGU
(2001) andSpicer et al.(2002).
On day 1 at 22:00 local time, LWCashows a maximum of 2.1×10⁻⁴g m−3. No cloud forms under these conditions but perturbations in the radiative and heat fluxes induce a weak turbulent mixing resulting in downward O3transport. As a consequence, ozone is temporarily replenished down to the surface from day 1, 23:00 to day 2, 05:00 (Fig.2a). 5
After day 2, bromine is well mixed in the BL and until the end of day 3, ozone decreases to about 3 nmol mol−1(equivalent to MODE4) in the lowest 400 m.
These model results suggest that the deposition/re-emission of halogens on the snowpack, with characteristics as described in this paper, is a key process for the ozone depletion. Open leads modify the particle deposition velocities, so that the 10
whole chemical mechanisms are influenced by the presence of open leads. These open leads increase the aerosol sedimentation and thus the re-emission of halogens from the ground. Systematic and comprehensive measurements of snow composition in the vicinity of open leads in association with air mass composition are needed to verify this finding. Detailed studies on the influence of open leads are presented in the 15
following section. 3.2 Surface influence
We performed a model run, where the model column traverses a field of FFs only (fluxes from Table 3 also prescribed), to investigate the impact of FF aerosols only, and no open water; recycling of deposited bromine on snow is also ignored (called 20
NOL-noR for No Open Lead – no Recycling from snow; run 2 in Table4). All deposited bromine is definitely lost on snow. Such a case might occur if recycling processes in/on the snow are not important. In this run, the other parameters remain the same as in the base run.
In this sensitivity run, a similar plume of aerosols is generated from the field of FFs 25
as in our base run. Aerosols spread within the boundary layer (Fig.3c) due to the con-vection generated by the temperature difference between the FF field and the overlying air. As no halogen re-emission takes place from the snow after sedimentation, gaseous
ACPD
7, 4521–4595, 2007 The processes influencing ODEs M. Piot and R. von Glasow Title Page Abstract Introduction Conclusions References Tables Figures ◭ ◮ ◭ ◮ Back CloseFull Screen / Esc
Printer-friendly Version
Interactive Discussion
EGU
ξHOBris reduced to maximum values of 4.5 pmol mol−1compared to 9.7 pmol mol−1for the base run (in both cases, mostly confined to the lowest layers of the model due to highest concentrations of oxidants near the surface). As a consequence, the liberation of aerosol bromide via the bromine explosion mechanism (see Reaction14) between the surface and the altitude of 100 m on day 0 is delayed by two hours compared to 5
the base run. Nevertheless, all aerosols that remain suspended in air still undergo a debromination which is nearly completed after 32 h.
In this case, daytime deposition during the first day is mainly composed of aerosol bromide and HOBr (not shown) and is, during the rest of the simulation, dominated by HOBr and BrONO2. Under the conditions of this run, a large amount of aerosol 10
bromide (which is the only relevant source of bromine) deposits on snow before it can be activated to gas phase Br, i.e., it does not affect the atmospheric composition.
We calculate a ratio of 1.3 between IDBr and TCg after the four simulated days (Fig. 3d) compared to 0.2 for the base run. Due to these high values of IDBr, TCg undergoes a severe reduction: the absence of re-emission from the snow substantially 15
diminishes the presence of bromine radicals near the surface.
The ozone loss rate is small, with a minimum mixing ratio of 23.5 nmol mol−1, and cannot even be categorized as a PODE after four days of simulation (Fig. 3a). We calculated that the ozone decrease in this case is only 40% attributed to chemical re-actions; 60% of the total ozone removal is a consequence of its deposition on snow. 20
As a consequence, the O3 profile does not correlate with the BrO profile. The maxi-mum mixing ratio of BrO is with 17 pmol mol−1rather small compared to the base case (Fig.3b), and BrO develops down from the top of the BL. Under conditions of no recy-cling of bromine from the snow, the liberation of bromide from FF aerosols is too slow, and a large amount of bromide is deposited on snow; the strong bromine loss onto the 25
ground is the main characteristic of this run.
A similar model run (not shown), with the inclusion of a 3-km open lead (10 min) but still without recycling of deposited bromine on snow, only showed a greater sink of aerosol bromide due to greater particle mass with eventual ozone mixing ratio
ACPD
7, 4521–4595, 2007 The processes influencing ODEs M. Piot and R. von Glasow Title Page Abstract Introduction Conclusions References Tables Figures ◭ ◮ ◭ ◮ Back CloseFull Screen / Esc
Printer-friendly Version
Interactive Discussion
EGU
(24.5 nmol mol−1) also above the PODE threshold. Hence, the presence of the 10-min open lead does not drive the ozone destruction.
In order to assess the effects of the lead extension, we did a model run with a 1-h OL (equivalent to 18 km, called OL-1h-noR, Fig.4). As already mentioned, the presence of open water induces an increase in the humidity of the overlying airmass. The presence 5
of this large lead affects the BL height which grows from 300 to 500 m within a couple of hours (see Fig. 4c). This fast increase in the BL height after the OL is in good agreement with observations from dropsonde data made byHartmann et al. (1997) andHartmann et al.(1999).
On day 0 at 18:00, a cloud starts to form in the model at the top of the PBL. LWC 10
reaches a maximum of 7.7×10⁻²g m−3 compared to 2.1×10⁻⁴g m−3 for the base run. The radiative cooling induces an important temperature decrease (up to 9 K) within the cloud (Fig. 4d). The cloud depth increases to 400 m within 3.5 days (Fig. 4c). The observation of low-layer Arctic clouds have demonstrated the interactions between ra-diative fluxes, sensible, and latent heat fluxes and the BL structure.Herman and Goody
15
(1976) described the radiative and turbulent processes producing Arctic stratus clouds. Radiative cooling and diffusive cooling are in majority responsible for the turbulence be-low the cloud base and may contribute to the propagation of turbulence in our model. From his measurements,Curry (1986) found that the radiative cooling contributes to mixed-layer convection via turbulence generation. Altogether, these observations high-20
light the air motions from clouds which might significantly contribute to entrainment of air from aloft.
In the model, the turbulence generated by the presence of the cloud leads to an effec-tive downward transport. The turbulence is efficient, reaching the surface within a cou-ple hours. The vertical mixing related to the presence of such a turbulence can inhibit 25
the development of an ODE: shallow low-ozone layers are mixed with ozone-enriched air from above. This dynamical phenomenon has thus important consequences for the development of an ODE. Chemical observations associated with detailed description of the cloud presence are greatly needed to confirm this ODE dissipation by vertical air
ACPD
7, 4521–4595, 2007 The processes influencing ODEs M. Piot and R. von Glasow Title Page Abstract Introduction Conclusions References Tables Figures ◭ ◮ ◭ ◮ Back CloseFull Screen / Esc
Printer-friendly Version
Interactive Discussion
EGU
mixing.
Due to their growth in the more humid air and therefore increased sedimentation, the concentration of FF aerosols is rapidly reduced leading to a large amount of de-posited bromide. The deposition of FF aerosols is nearly complete 36 h earlier than in the base case. TCa, sum of integrated bromide concentration in sulfate and FF 5
aerosols, remains high due to increased bromide concentration in sulfate aerosols. When no recycling on snow is considered, deposited bromide from FF aerosols (50% of the total amount of FF aerosols after 3 h) is irreversibly lost on snow (blue line in Fig.4e). This results in small amounts of bromine in the air: BrO mixing ratios do not exceed 15 pmol mol−1 on day 0 (Fig.4b). On this day, the decrease in ozone down to 10
26.5 nmol mol−1 near the surface (Fig. 4a) is 60% due to deposition on snow. In this particular case, the smaller turbulent mixing close to the surface reduces the ozone vertical mixing and therefore accelerates the chemical destruction of ozone by about 2 nmol mol−1.
Furthermore, cloud droplets have a larger uptake capacity than dry aerosols as the 15
exchange with the gas phase depends on the LWC. In Fig. 4e, TCd (light blue line) shows the strong uptake of bromine to droplets after the cloud formation. Similarly, the uptake capacity of aerosols increases as well (higher water content): the rise in TCa starting on day 0 at 19:00 is largely (more than 75%) due to uptake in sulfate aerosols. A clear shift in gas-particle partitioning of bromine occurs (see also the strong decrease 20
of gas phase BrO after the first day in Fig.4b).
On day 2, 00:00 local time, the ratio TCa:TCg=0.6 whereas it is only about 0.06 before the cloud development. That means that, due to cloud formation, a major part of the gas phase bromine (TCg) is shifted to the particulate phase, leading to less O3 destruction in the PBL.
25
In addition, formaldehyde is taken up by droplets (seeLelieveld and Crutzen,1990) and decreases in our case by 20 pmol mol−1 in cloud layers. This uptake reduces the production of HOBr via several ways: 90% of the HOBr reduction is due to less pro-duction of HOx(mostly due to less photolysed HCHO or reaction with OH and halogen
ACPD
7, 4521–4595, 2007 The processes influencing ODEs M. Piot and R. von Glasow Title Page Abstract Introduction Conclusions References Tables Figures ◭ ◮ ◭ ◮ Back CloseFull Screen / Esc
Printer-friendly Version
Interactive Discussion
EGU
radicals) and 10% due to the reduced reaction rate of the following reaction:
BrO + HCHO O2
−→ HOBr + CO + HO2 (20)
In summary, the combination of bromide loss due to deposition, uptake of bromine and other species (e.g., HCHO) to cloud droplets and aerosols, and mixing with ozone-rich air from above prevents the development of an ODE (except for the first day,ξO3 stays 5
above 32 nmol mol−1 up to the end of the run).
In run 5 (not shown) the model run also traverses a 1-h open lead but recycling of deposited bromine on snow is included. All deposited matter is instantaneously re-emitted with the same recycling ratioνsnow(75%) as in the base case. Here, the re-emission contributes to an efficient conversion of diverse brominated compounds into 10
Br2and BrCl. Several hours after the start of the FF aerosol production, ozone drops to 13 nmol mol−1 (equivalent to a PODE1) with a maximum ozone destruction rate of 2.3 nmol mol−1h−1. Therefore, as long as no cloud layer forms in the BL the association of open water with recycling from snow releases more reactive bromine in the air than without OL and depletes more O3molecules. As soon as the cloud develops (starting 15
on day 0, 18:00, same as in run 4), the induced strong mixing ends the PODE.
The presented results of runs 2 to 4 indicate that the ODE as modeled in our base case requires the bromine re-emission from the snowpack.
Moreover, as mentioned in Sect. 2.3, studies on snow surfaces and interstitial air have demonstrated the importance of the snowpack for chemical exchanges with the 20
atmosphere, including the conversion of deposited bromine into photolabile reactive species.
All subsequent runs will include this process in the form of a Br2/BrCl outgassing as described in Sect.2.3.
These model studies showed that, first, recycling on the snowpack is an important 25
process for the development of an ODE, and second, an ODE can quickly vanish due to vertical mixing induced by the presence of a cloud. Third, open leads increase
ACPD
7, 4521–4595, 2007 The processes influencing ODEs M. Piot and R. von Glasow Title Page Abstract Introduction Conclusions References Tables Figures ◭ ◮ ◭ ◮ Back CloseFull Screen / Esc
Printer-friendly Version
Interactive Discussion
EGU
the deposition/re-emission process on snow but their presence for an ozone depletion does not seem to be necessary.
In order to further investigate the impact of OL, we examine in run 6 the effects of a 10-min open lead prior to the field of FFs (OLFFS: Open Lead – Frost Flowers – Snow; not shown). Under such OL/FF configuration no brominated matter from the 5
FF field is irreversibly deposited on sea water as the FF aerosol production starts only subsequent to the OL passage. In this run the relative humidity at the start of the FF aerosol production is 6–8% higher than in the base run. Aerosols released from the FF field grow more rapidly in size in the humid air and consequently deposit more rapidly. The amount of deposited bromine, which is dominated by particulate bromide, is about 10
20% higher than in the base case for the first 3 h after the FF field. In our simple parameterization, deposited bromine is immediately re-released into the gas phase. As a result, TCgOLFFSincreased by 4% compared to TCgbase caseat the end of the run. Therefore, in our model run, the increase in deposition leads to a speed-up in activation of bromine, i.e. the conversion of bromide from FF aerosols to reactive bromine gases. 15
In run OLFFS this results in a lower minimum in O3mixing ratio with a MODE reached 20 h earlier than in the base case (equivalent to 12% increase in ozone destruction rate). This result underlines the importance of different spatial FF/OL combinations for aerosol compositions and deposition velocities.
As already mentioned, frost flowers are found close to irregular cracks, which can 20
be as small as several meters. These regions of cracks can extend over large areas. In order to simulate such an area but still ensuring that the total time that the model column spends over FF fields (two hours) and open leads (10 min) is the same as in the other model runs, we did a run where ten FF fields (12 min each, 3.6 km) are each followed by an open lead (1 min, 300 m) and a region covered with snow (47 min, 25
14.1 km). This simulation is called “separated-FF” (run 7, see Fig.5). The presence of small OLs among the field of FFs sporadically injects humidity in the model over a longer time period of 10 h (Fig.6c). The induced convection is weaker than in the base case, with a lower LWCmaxof 1.8×10⁻⁴g m−3 (Fig.6d).
ACPD
7, 4521–4595, 2007 The processes influencing ODEs M. Piot and R. von Glasow Title Page Abstract Introduction Conclusions References Tables Figures ◭ ◮ ◭ ◮ Back CloseFull Screen / Esc
Printer-friendly Version
Interactive Discussion
EGU
The emissions from FFs produce the same amount of aerosols (see black line in Fig.6e) but within 10 h instead of 2 h.
The initial development of the ODE is slower and maximum BrO mixing ratios, with only 38 pmol mol−1 (Fig. 6b), are closer to observed numbers than in the base case. The final total deposition IDBr is 5% lower in this case. This run can be categorized as 5
a MODE4 with a minimum of 4 nmol mol−1 of ozone at the end of the four simulated days (Fig.6a), compared to 3 nmol mol−1 for the base case. These results show that in a model run with this FF representation as much ozone can be depleted as one unique/large FF area.
Finally, we investigated the changes caused by the emission of aerosols at night 10
instead of at daytime as in previous runs.
In these runs the model column passes the FF field on day 0, from 00:00 to 02:00 local time. Particulate bromide mostly remains in FF aerosols as long as no photo-chemical reactions take place. At night, as no halogen radical forms in the air, neither gas phase HOBr nor XONO2(with X,Y=Br, Cl) can build up. HOBr is then the limiting 15
factor for Reaction (14). Similarly, the heterogeneous Reactions (18) and (19) cannot proceed efficiently.
Aerosol debromination cannot take place if neither HOBr nor XONO2 is present. Therefore, the sedimentation of bromine at night is quasi entirely bromide-controlled (about 99%). We investigated two different scenarios, one where Br2 and BrCl are 20
produced from deposited bromine also in the absence of light (run 8) and another without recycling at night (run 9). In run 8 Br2 (Fig. 7b) and BrCl get vertically well mixed at night so that the bromine explosion mechanism starts over the whole depth of the BL at sunrise and O3gets destroyed rapidly (Fig.7a). In this run the threshold for a MODE4 is reached approximately 18 h more rapidly than in the case where FFs are 25
prescribed during daytime. ξBrO has a maximum value of 57 pmol mol−1 in the lowest 150 m (Fig.7c), corresponding to an increase of 17% compared to the base case.
If no re-release of bromine takes place from snow at night, the presence of FFs under these conditions leads to a large deposition of aerosols without affecting the gas phase
ACPD
7, 4521–4595, 2007 The processes influencing ODEs M. Piot and R. von Glasow Title Page Abstract Introduction Conclusions References Tables Figures ◭ ◮ ◭ ◮ Back CloseFull Screen / Esc
Printer-friendly Version
Interactive Discussion
EGU
concentrations at night (run 9, see right hand side of Fig.7). At sunrise, 24% of TCBr is constituted by IDBr (Fig.7d∗) compared to 8% for the run with re-emission at night (run 8). Ozone mixing ratios do not fall below 14 nmol mol−1(Fig.7a∗) and Br
2remains low, beneath 23 pmol mol−1(Fig.7c∗).
In both cases the presence of FFs at night has considerable consequences for the 5
bromine concentration in the individual phases: depending on the capability of snow to recycle deposited matter at night, deposited bromide is either converted to gas phase bromine (recycling at night) or stored in/on snow (no recycling at night). As our model runs are Lagrangian runs the bromine stored in the snow is not taken into account as additional bromine source in the model (see also Sect.3.6where we compare our re-10
sults to field measurements). We therefore encourage experimentalists monitoring the concentration of halogenated species near a frost flower area during day-to-night and night-to-day transitions in order to better understand the effects of FFs during nighttime. The results in this section showed us that multiple surface conditions can influence the ozone level in the BL. In order to better characterize these ODEs, laboratory and field 15
studies with accurate Arctic surface descriptions are needed to understand the criteria leading to a major ODE.
3.3 Meteorological parameters 3.3.1 Temperature
The mean temperature of frost flowers is subject to horizontal/vertical temperature gra-20
dients (in particular due to the presence of open water).
By specifying the area of FFs five degrees warmer than our standard value for the surface of 255 K (run 10), the specific humidity at the surface increases by about 40%. When the model column crosses the FFs, the rise in humidity in the overlying air (Fig.8e) compared to the base case leads to particle growth, faster deposition (Fig.8f) 25
and consequently to an increase in the recycling of bromine from the surface. On the first day, the greater concentration of Br atoms at lower altitudes (0–150 m) leads to
ACPD
7, 4521–4595, 2007 The processes influencing ODEs M. Piot and R. von Glasow Title Page Abstract Introduction Conclusions References Tables Figures ◭ ◮ ◭ ◮ Back CloseFull Screen / Esc
Printer-friendly Version
Interactive Discussion
EGU
more ozone molecules destroyed via the catalytic cycles mentioned in Sect.1. There, ξBrO reaches values up to 49 pmol mol−1 (Fig.8b). O3 mixing ratios approach a mini-mum of 8 nmol mol−1 before the formation of a cloud in the afternoon of day 1, 15:00 local time (Fig.8a). The presence of cloud droplets lasts for only 5 h (Fig.8c). The in-duced air mixing caused by the variation in radiative and heat fluxes affects the whole 5
BL within three hours. Ozone at lower altitudes is replenished with ozone-rich air from above. Overall in this model run we note a stronger ODE (equivalent to a PODE) in the vicinity of the surface than in the base case, caused by the change in recycling on snow before the afternoon of day 1. After dispersion of the cloud, ozone mixing ratios decrease again and reach a minimum of about 4 nmol mol−1 (MODE) at the end of the 10
model run.
In conclusion, the prescribed change in temperature associated to the FF area ap-pears to be important in our model results: it modifies the particle deposition velocity and therefore the amount of available bromine radicals released via the snow. Thermal characteristics of frost flowers must be carefully considered to better understand their 15
potential importance.
In addition to the studies above, we also ran the model under colder ambient con-ditions (Fig. 9 – run 11). By adequately cooling the surface temperature during the spin-up, we obtained a BL with approximately 1 K colder compared to the base run. Using this colder initial spin-up, we tested the effects of such an airmass on chem-20
istry. In this run we kept the temperature and specific humidity profiles constant to conserve the airmass characteristics up to the presence of FFs at 04:00 local time, day 0 (Fig.9e). Snowpack, frost flowers and open lead temperatures remain unvaried (245 K, 255 K and 271 K resp.).
Due to a lower water vapor saturation pressure under colder conditions, the relative 25
humidity rises by about 7% in the model. Particles grow more rapidly in the humid air. The accomodation coefficient (α) and the Henry’s constants are, for a large variety of chemical species in MISTRA, according to the literature values directly functions of temperature: for a decrease of 1 K,
ACPD
7, 4521–4595, 2007 The processes influencing ODEs M. Piot and R. von Glasow Title Page Abstract Introduction Conclusions References Tables Figures ◭ ◮ ◭ ◮ Back CloseFull Screen / Esc
Printer-friendly Version
Interactive Discussion
EGU
α increases by about 3–5% (largest increase for HBr, ROOH, HCl), while Henry’s constants rise up to 15% with highest values for acids (HBr, HCl, HNO3).
These changes lead to an increase in uptake of acids affecting the pH of particles. Figure9d shows the FF aerosol pH at an altitude of 50 m for the base run (solid black line) and for run 11 (dashed red line). In this case, after the aerosol release and 5
equilibrium with the ambient air, the pH of FF aerosols decreases from 4.8 to 1.5 within four days, whereas it only decreases to a minimum of 2.5 in the base run. Note the pH increase after day 0, 06:00 local time due to rise in humidity after the OL.
The bromine explosion cycle is more efficient in more acidic particles: FF aerosols are debrominated earlier than in the base run. On day 0, 22:00, the short formation of 10
cloud droplets temporarily modifies the bromine concentration in the gas and particu-late phases (see Figs.9c and f).
The total amount of bromine TCBr is here higher than in the base run due to the increase of temperature-related fluxes at the surface. It is also important to note that the rise in humidity is small. The deposition IDBr increases by less than 10%. Thus, the 15
acceleration in the bromine explosion is essentially caused by the change in particle pH, not by the modification of the re-emission from the ground. Importantly (Fig.9c), this acceleration in the liberation of aerosol bromide to gas phase bromine occurs in the whole BL: on the first day, BrO in the upper part of the BL exhibits mixing ratios up to 33 pmol mol−1 compared to 25 for the base run (Fig.9b). As a consequence, O3 20
molecules are destroyed more rapidly and more uniformly within the BL. In this run the ODE corresponds to a MODE3.
These results are in good agreement with observations of air depleted in ozone simultaneously with low temperatures (Bottenheim et al., 1990; Beine et al., 1997). However, we have to stress that these unexpectedly large differences are based on es-25
timates of the temperature dependency which might not be valid for those low temper-atures. As the potential impact is very large, as shown, the temperature dependencies should be revised in laboratory.