HAL Id: hal-01872550
https://hal.uca.fr/hal-01872550
Submitted on 15 Oct 2018
HAL is a multi-disciplinary open access
archive for the deposit and dissemination of sci-entific research documents, whether they are pub-lished or not. The documents may come from teaching and research institutions in France or abroad, or from public or private research centers.
L’archive ouverte pluridisciplinaire HAL, est destinée au dépôt et à la diffusion de documents scientifiques de niveau recherche, publiés ou non, émanant des établissements d’enseignement et de recherche français ou étrangers, des laboratoires publics ou privés.
Retrieval of complex refractive index and size
distribution of spherical particles from Dual-Polarization
Polar Nephelometer data
Christophe Verhaege, Valery Shcherbakov, Pascal Personne
To cite this version:
Christophe Verhaege, Valery Shcherbakov, Pascal Personne. Retrieval of complex refractive index and size distribution of spherical particles from Dual-Polarization Polar Nephelometer data. Jour-nal of Quantitative Spectroscopy and Radiative Transfer, Elsevier, 2009, 110 (14-16), pp.1690-1697. �10.1016/j.jqsrt.2009.01.004�. �hal-01872550�
Retrieval of complex refractive index and size distribution of spherical
particles from Dual-Polarization Polar Nephelometer data
Christophe Verhaegea,b*, Valery Shcherbakova,b, Pascal Personnea,b
a Laboratoire de Météorologie Physique, UMR/CNRS 6016, Université Blaise Pascal, 24
Avenue des Landais, 63177 Aubière Cedex, France
b LaMP - Institut Universitaire de Technologie de Montluçon, Avenue A. Briand-BP 2235,
03101 Montluçon Cedex, France
*Corresponding author: Christophe VERHAEGE, LaMP - IUT de Montluçon, Avenue A.
Briand - BP 2235, 03101 MONTLUCON Cedex, FRANCE. Tel.: +33 4 70 02 20 73; fax: +33 4 70 02 20 94.
E-mail addresses: [email protected] (C. Verhaege), [email protected] (V. Shcherbakov),
[email protected] (P. Personne).
Abstract. An algorithm to retrieve the complex refractive index and size distribution of spherical particles from Dual-Polarization Polar Nephelometer data is presented. The assessment of the refractive index is based on the lookup-table approach, which is safe against converging to a local minimum, i.e. false solutions. The results of tests of the algorithm against real experimental data are outlined. The retrieved characteristics are in the expected ranges and in good agreement with the nature of particles and the specifications of the aerosol generators. It is demonstrated that, when a population of small particles, e.g., atmospheric aerosols, is dealt with and a gradient algorithm is employed to estimate the complex refractive index, either the algorithm must be able to overcome the problem of local minima or one should have some a priori information about credible ranges of the real and imaginary parts. Keywords: Light scattering, Inverse problem, Complex refractive index, Size distribution.
1. Introduction
Aerosols have been identified as a major uncertainty in predicting the global energy budget [1, section 2.4]. The knowledge of microphysical and optical characteristics of aerosols is of importance for modelling the radiative balance of Earth’s atmosphere, understanding the cloud life cycle, and remote sensing of tropospheric aerosols.
The knowledge of aerosol properties is extended first of all by means of in situ and laboratory measurements. And, nephelometers contribute significantly to that extension. For example, a considerable amount of experimental single scattering matrices as functions of the scattering angle (from about 3 to 174 degrees) have been obtained with the light scattering facility in Amsterdam. The measured data are available at the Amsterdam Light Scattering Database [2].
The long term objective of the Dual-Polarization Polar Nephelometer (D2PN) [3], designed at Laboratoire de Météorologie Physique, is to develop a database of optical and microphysical characteristics of aerosols and to test inverse codes against it. The D2PN is a device to measure the parallel and perpendicular polarized components of light scattered by an ensemble of aerosol particles. Measurements are carried out at the single wavelength 800 nm in the interval of scattering angles from 10° to 169° with the step of 1°.
On the base of sensitivity tests of D2PN data to optical and microphysical parameters of ensembles of spherical particles, we showed [3] that D2PN data enable to retrieve some microphysical parameters along with the assessment of the complex refractive index. At the same time, there are limitations on retrieval of complex refractive index that are related to the degree of absorption of particles [3]. It is of importance to test those conclusions and our retrieval approach against real experimental data. The aim of this paper is to present results of
tests we performed. Our retrieval approach is outlined first. Thereafter the experimental data and retrieval results are presented. Section 4 is devoted to the discussion.
2. Retrieval approach
As for atmospheric aerosols, most of the retrieval methods are based on the Lorenz-Mie theory (see, e.g., [4]), that is, aerosols are modelled as spherical particles. Due to the progress in modelling of optical properties of single particles with diverse geometrical shapes, spheroid models come into play to account for aerosol particle nonsphericity. For example, the Version 2 AERONET (AErosol RObotic NETwork) retrieval [5] provides a number of aerosol parameters (i.e., size distribution, complex refractive index and partition of spherical/non-spherical particles). Nevertheless, homogeneous spherical particles remain the dominant model for aerosol inverse problems. And, our retrieval approach is also based on that model.
Broadly speaking, the retrieval of the complex refractive index mni and the size
distribution of particles consists of two tasks: (i) the retrieval of the size distribution when values of
n
and are preassigned, and (ii) the assessment of the complex refractive index. When a value of the refractive index is preassigned, we employ a code that relies on the method developed by Dubovik and colleagues (see, e.g., [6, 7]), hereafter D&C’s method. There are several reasons to prefer that method. The most important reasons are discussed in the following.First of all, D&C’s method provides non-negative solutions. The problem of positivity of a retrieved particle size distribution is known for a long time (see, e.g., [8 – 9]). It concerns not only the contradiction that negative values are allowed as a solution for fundamentally positive parameters. Usually, negative values appear at the size range of large particles.
Compared to the total number concentration their percentage can be sufficiently small. But, the contribution of the negative values to optical characteristics cannot be neglected because it is proportional to the cross section of a particle [4]. A number of algorithms, which employ the negativity constraint, were proposed (see, e.g., [8 – 12]). As it concerns the non-negativity constraint, we prefer D&C’s method because, in our opinion, retrieval of logarithms of physical characteristics is the most natural and smart way to avoid negative values.
The second reason is the flexibility of D&C’s method, i.e., there are a number of alternatives for implementing the inversion so that the scheme can be easily used with other applications [6 – 7]. The last but not least reason is that the AERONET operational code is based on that method. In other words, its high quality is proven through successful processing of huge sets of real experimental data. We note in passing that we performed a large number of simulations, including multimodal size distributions and different levels of measurement errors. Our simulations confirmed high quality of D&C’s method when applied to D2PN data.
The details of D&C’s method are beyond the scope of the present work; interested readers are referred to the papers [6 – 7]. For clarity sake, we point out that retrieval of particle size distribution from D2PN data is related to a system of Fredholm integral equations (or an equation) of the first kind (see, e.g., [7, 13]):
max min ) ( ) , , , , ( ) ( //, ,0 0 , //, r r K n r f r dr I , (1)where I//() and I() are the parallel and perpendicular polarized scattered components
when the sampling volume is illuminated by the unpolarized light; I0() is the unnormalized phase function; is the scattering angle; K//,,0(,n,,r,) denote the corresponding cross sections;
r
is the radius of a particle; f(r) is the number size distribution of particles.The total number N(rmin,rmax) of particles with radii between rmin and rmax per unit of volume is:
max min ) ( ) , ( min max r r f r dr r r N . (2)The components I//() and I() can be expressed as follows:
( ) ( )
8 ) ( 11 12 // C F F I sc ,
( ) ( )
8 ) ( 11 12 C F F I sc , (3) where C [m1]sc is the scattering coefficient, F11() and F12() [ ]
1
sr are the elements
of the scattering matrix (see, e.g., [14, 15, section 4.2]). The element F11() is called the scattering phase function and satisfies the following normalization condition:
1 ) sin( ) ( 2 1 ) ( 4 1 0 11 4 11
F d F d . (4)The values of the unnormalized phase function can be deduced from the D2PN data by means of the formula: ) ( 4 ) ( ) ( ) ( // F11 C I I I sc . (5) The parameter ( ) (( )) 11 12 F F
P is called the degree of linear polarization for incident unpolarized light (see, e.g., [16]) and can be computed as follows:
) ( ) ( ) ( ) ( ) ( // // I I I I P . (6)
The parallel polarized component I//() is measured by D2PN for the scattering angles ranging from 10° to 160°; and the perpendicular polarized component I() is
The discretization by quadrature approximates Eqs (1) by the linear systems, i.e., by the matrix equations [7, 13]: i k k k i i r d r dV r n K I
ln ) ( ) , , , ( ) ( //, ,0 0 , //, , (7)where K//,,0(i,n,,rk) are kernel matrices; dV(r) dlnrrv(r) f(r); v(r) is the volume of particle with the radius
r
; i are measurement errors. Thus, D&C’s method isused to solve Eq. (7) when the complex refractive index mni is preassigned.
The approach we employed to estimate the complex refractive index of particles is discussed in the following. The dependence of the kernel matrices on the real
n
and imaginary parts of the refractive index is considered through the lookup-table, that is, the kernel matrices were precomputed in grid points of mni, which cover for sure thewhole range of expected values. In D2PN retrieval code, the lookup table covers the intervals from 1.1 to 1.9 for
n
and from 1E-10 to 1E+1 for .In the main grid of the lookup-table, the real-part range is divided into 40 intervals with the linear steps of 0.02; the imaginary-part range is divided into 50 intervals with a logarithmic step. For each value of the refractive-index grid, a size distribution is retrieved. The intermediate value mI nI iI of the refractive index is derived using the condition of
minimum of the root mean squared relative errors (RMS). Thereafter, the grid of
n
and
is refined around mI nI iI. For each value of the refined grid, a size distribution is retrieved.The final value mF nFiF is derived using the condition of minimum of the RMS. The
corresponding size distribution is considered as the retrieved one.
The lookup-table approach (LTA) is time-consuming because an inverse problem must be solved at each point of the refractive-index grid. For example, the LTA is about 104 times
more time-consuming compared to the code developed by Dubovik and colleagues [6, 7] where an iterative algorithm (successive approximations) is employed to estimate mni.
At the same time, the LTA has the following advantages. It does not depend on an initial guess and is safe against converging to a local minimum, which can lead to a false solution. The LTA provides possibility to show root mean squared relative errors as a function of
n
and
, i.e., as a 3D plot. This is especially convenient when graphics software enables image rotation. All minima can be seen and analyzed at the one time.3. Experimental data and retrieval results
3.1 Measured characteristics
Our measurements were carried out for several populations (ensembles) of liquid droplets. First of all, the populations differ in the size distribution. For the first set of data, a liquid aerosol generator (PLG-2000, Pallas GmbH) produced small droplets; and for the second one, large droplets were generated (VOAG 3050, TSI Inc.). The populations of liquid droplets differ in the complex refractive index as well. They were generated from (i) water, (ii) ethanol, (iii) Di-Ethyl-Hexyl-Sebacate (DEHS), (iv) the DEHS-ethanol mixture of 50% ethanol, and (v) the DEHS-ethanol mixture of 95% ethanol.
The optical scheme and the technical parameters of D2PN are described in details by Verhaege et al. [3]. The D2PN sampling volume is illuminated by the unpolarized light at the wavelength 800 nm. The polarized components parallel I//() and perpendicular I()
to the scattering plane were measured. The accuracy of the measurements is estimated to be better than 5% when the single scattering conditions are assured and the concentration of particles is sufficiently high. The quantities I//() and I() are proportional to scattered
intensities (see, e.g., [17], p. 1), but are not real ones. Their relationships with the scattering coefficient, the elements of the scattering matrix and the degree of linear polarization are done in Section 2.
Our retrieval code were tested against four following cases of the measured data: (i) the perpendicular I() and (ii) the parallel I//() components taken individually, (iii) the
unnormalized phase function I()I()I//(), and (iv) the components I and I// taken
together. The D2PN measurements are carried out with the step of one degree for the scattering angles ranging from 10° to 160° for I//() and from 19° to 169° for I(), that
is, the perpendicular and parallel components are recorded at 151 values of . Consequently, the unnormalized phase function I() and the degree of linear polarization P() are deduced for N 142 values of in the scattering angles range from 19° to 160°. The D2PN data appeared to be highly redundant with respect to the size distribution of homogeneous spheres [3]. That is why it is reasonable that we obtained the very close results for all four cases. Therefore, only results for the unnormalized phase function I() are presented below.
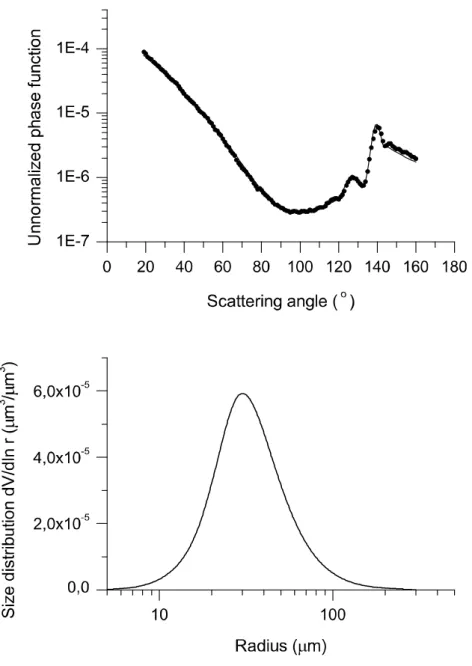
Four representative examples of measured phase functions I() are shown by points in Figs. 1(a) and 2(a). (Because of the small step of
, the points merge together. Points are seen separated in the zooming rectangle.) The cases 1(a) correspond to populations of small droplets. The symbols “w”, “e” and “d” stand for water, ethanol, and DEHS particles, respectively. The functions are shifted along the vertical axis due to the fact that I() is unnormalized and depends on the total number concentration of droplets. All three functions are quite smooth; and, as might appear at first sight, nothing indicates that they are related to droplet-populations having different values of the refractive index. The phase function 2(a) corresponds to a population of water droplets. It has two pronounced peaks that correspond to the primary and secondary rainbows. That indicates that we deal with a population of large droplets.It should be pointed out that the retrieval approach, outlined in Section 2, was applied to the experimental data under blind conditions. That is, the operator was provided only by the measured characteristics; he had had no any additional information. The retrieved particle size distributions are shown in Figs. 1(b) and 2(b). There is a pairwise correspondence between Figs. 1(a) and 1(b), i.e., the distribution “w” is the inversion of the phase function “w” and so on. It is seen that the small-particles generator produced droplets with a size distribution having maximum at the particle radius of 1
m. The width of the DEHS size distribution is higher compared to those one of the water and of the ethanol. That may be due to the fact that the DEHS viscosity is more than 10 times higher. According to manufacturer's specifications, the generated particle sizes as well as the concentration depend substantially on the type of liquid. As it is seen in Fig. 2(b), the large-particles generator produced droplets with a monomodal size distribution having maximum at particle radius of 28
m. The size distribution is quite narrow; that is why the rainbow peaks of the phase function 2(a) are well pronounced.The assessed values of the complex refractive index and the “true values” of the real part are shown in Table. The “true values” were measured using an Abbe refractometer. All data correspond to low absorbing liquids. For low absorbing particles, only the range (
<1.E-4) of the imaginary part of the refractive index can be estimated from D2PN data [3]. That is why, the true values of
are not given. In Table, seven examples are given. The cases, shown in Figs. 1 and 2, are highlighted in bold. The retrieved values of are less than or close to 1.E-4, which is in agreement with the conclusions of the paper [3].The complex refractive index of water is of 1.329 + i 1.25E-7 for the wavelength of 800 nm [18]. In the case of large droplets, the retrieved value of the real part is perfect. For small particles, the estimated value is 1.311. This value is within the error bars that correspond to the D2PN measurement errors. In the both cases, the imaginary part of the
refractive index is within the expected range of values (less than 1.E-4) of low absorbing particles. For small particles, the assessed values of the real part of ethanol and of DEHS are close to the “true” one. They are well distinguished despite the fact that the phase functions of Fig. 1(a) might appear similar.
The assessed values of two integral parameters of the size distributions, i.e., the mean diameter and the volume median diameter DVM, are given in Table as well. We have only the
manufacturer's specifications on the particle generators as the “true information”. Thus, the generated populations are referenced as small, mean, and large in Table. It is seen that the estimated values of DVM are in good agreement with each other and with the “true
information”.
The phase functions computed from the retrieved distributions, i.e., the retrieved phase functions, are plotted by lines in Figs. 1(a) and 2(a). The careful examination of zoomed plots reviled a good fit of the measured data.
4. Discussion
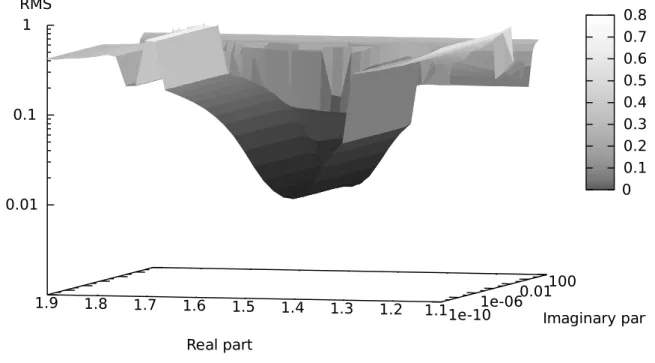
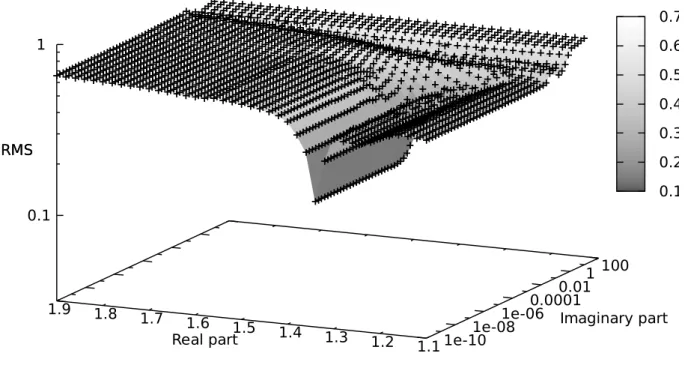
As it was mentioned above, the lookup-table approach is time-consuming. On the other hand, the advantage of the LTA is that it provides possibility to obtain a 3D plot of root mean squared relative errors (RMS). Figs. 3 and 4 show two representative examples of the RMS as a function of
n
and . The first one is the DEHS small particles. It corresponds to the phase function “d” of Fig. 1(a). The second example is the large water droplets (the phase function of Fig. 2(a)).As it is seen in Fig. 3, one deals with a nonlinear inverse problem when the value of the complex refractive index mni is to be retrieved. The valley of local, i.e., secondary,
minima is at the real part n1.73. Thus, if a gradient algorithm was employed and an initial guess was chosen, for example, at n1.7, a false solution would be obtained. Consequently, when one deals with a population of small particles, e.g., atmospheric aerosols, and the complex refractive index is retrieved along with the size distribution, either a gradient algorithm must be able to overcome the problem of local minima or one should have some a
priori information about credible intervals of
n
and
. The second valley of minima is at 455. 1
n . Compared to the “true value” of n1.450, that value is within the error bars, which correspond to the D2PN measurement errors.
As it is seen in Fig. 4, there are no secondary minima within a reasonable range of the complex refractive index. The sharp valley of minima is at n1.329, i.e., in perfect agreement with the complex refractive index of water. And, the valley is much sharper compared to that one of Fig. 3. Thus, when droplets are large, any gradient algorithm is able to provide a reasonable value of
n
. That is due to fact that the angular location of the rainbow peak strongly depends on the real part of the refractive index (see, e.g., [14, section 13.2]).From the above reasoning it follows that, when large sets of D2PN experimental data are involved, an automated code based on the method of Dubovik et al. (see, e.g., [6, 7]) can be employed not only to retrieve particle size distributions, but to estimate values of the complex refractive index. At the same time, it is preferable to exercise a spot check of assessed data using the lookup-table approach.
In both cases, the valley of minima is involved. At the assessed value of the real part, the variations of the RMS value are very small, i.e., negligible, if the imaginary part
is less than 1.E-4. That confirms the conclusion of the paper [3] that only the range of the imaginary part of the refractive index can be estimated from D2PN data if particles are low absorbing.As it was mentioned in Section 3.1, D2PN data are redundant with respect to the size distribution and refractive index of homogeneous spheres. On the other hand, this is not the case when other types of particles, e.g., aspheric, or irregular, or inhomogeneous, or having rough surface and so on, are concerned. For example, the degree of linear polarization P() exhibits a different angular behaviour for different populations of mineral particles (see, e.g., [19, Fig. 10]).
5. Conclusions
The accuracy of D2PN experimental data and of the employed inversion algorithm is sufficient to estimate the complex refractive index and to retrieve the size distribution of ensembles of spherical particles. All assessed parameters are in the expected ranges and in good agreement with the nature of particles and the specifications of the generators.
It is confirmed that, in the case of the low absorbing particles, measurement errors substantially reduce the sensitivity to the imaginary part of the refractive index and only the range (<1.E-4) of the imaginary part can be estimated.
The lookup-table approach does not depend on an initial guess for the real and imaginary parts of the refractive index. It is safe against converging to a local minimum, i.e. false solutions. The LTA provides the general view of the nonlinear properties of the inverse problem by way of 3D plots.
When a population of small particles, e.g., atmospheric aerosols, is dealt with and a gradient algorithm is employed to estimate the complex refractive index, either the algorithm must be able to overcome the problem of local minima or one should have some a priori information about credible ranges of
n
and . It is preferable to exercise a spot check of assessed by the gradient algorithm data using the lookup-table approach.References
[1] International Panel on Climate Change (IPCC), Climate Change 2007: The Physical Science Basis, Contribution of Working Group I to the Fourth Assessment Report of the IPCC, (ISBN:978-0521-88009-1), 2007.
[2] http://www.astro.uva.nl/scatter/
[3] Verhaege Ch, Shcherbakov V, Personne P. Limitations on retrieval of complex refractive index of spherical particles from scattering measurements. JQSRT 2008;109:2338-2348. [4] Bohren CF, Huffman DR. Absorption and scattering of light by small particles. 3rd ed.,
Wiley-Interscience, 1983.
[5] Dubovik O, Sinyuk A, Lapyonok T, Holben BN, Mishchenko M, Yang P, Eck TF, Volten H, Muñoz O, Veihelmann B, van der Zande WJ, Leon J-F, Sorokin M, Slutsker I. Application of spheroid models to account for aerosol particle nonsphericity in remote sensing of desert dust. J Geophys Res 2006; 111:D11208.
[6] Dubovik O. Optimization of Numerical Inversion in Photopolarimetric Remote Sensing. In: Videen G, Yatskiv Y, Mishchenko M, editors. Photopolarimetry in Remote Sensing. Dordrecht, Netherlands: Kluwer Academic Publishers, 2004. p. 65-106.
[7] Dubovik O and King MD. A flexible inversion algorithm for retrieval of aerosol optical properties from sun and sky radiance measurements. J Geophys Res 2000; 105:20673-20696.
[8] King MD. Sensitivity of constrained linear inversions to the selection of the Lagrange multiplier. J Atmos Sci 1982; 39:1356–1369.
[9] Shcherbakov VN, Ivanov AP and Chaikovskii AP. Peculiarities of the reconstruction of the microstructure of atmospheric aerosol from multifrequency sounding data. J Appl Spectroscopy 1983; 39:126–129.
[10] Müller D, Wandinger U and Ansmann A. Microphysical particle parameters from extinction and backscatter lidar data by inversion with regularization: Theory. Appl Opt 1999; 38:2346-2357.
[11] Böckmann C. Hybrid regularization method for the ill-posed inversion of multiwavelength lidar data to determine aerosol size distribution. Appl Opt 2001; 40:1329-1342.
[12] Veselovskii I, Kolgotin A, Griaznov V, Müller D, Wandinger U and Whiteman D. Inversion with regularization for the retrieval of tropospheric aerosol parameters from multiwavelength lidar sounding. Appl Opt 2002; 41:3685-3699.
[13] Dubovik O, Sinyuk A, Lapyonok T, Holben BN, Mishchenko M, Yang P, Eck TF, Volten H, Muñoz O, Veihelmann B, van der Zande WJ, Leon J-F, Sorokin M, Slutsker I. Application of spheroid models to account for aerosol particle nonsphericity in remote sensing of desert dust. J. Geophys. Res. 2006; 111:D11208.
[14] van de Hulst HC. Light Scattering by Small Particles. N.-Y.: John Wiley, Hoboken, 1957. [15] Mishchenko MI, Travis LD, Lacis AA. Scattering, Absorption, and Emission of Light by
Small Particles. New-York, Cambridge: Univ. Press, 2002. (Available at http://www.giss.nasa.gov/~crmim/books.html)
[16] Hovenier JW. Measuring scattering matrices of small particles at optical wavelengths. In: Mishchenko MI, Hovenier JW, Travis LD, editors. Light scattering by nonspherical particles. San Diego: Academic Press, 355–365, 2000.
[17] Hovenier JW, Van der Mee C, Domke H. Transfer of polarized light in planetary atmospheres, Kluwer Academic Publishers, 2004.
[18] D’Almedia GA, Koepke P, Shettle EP. Atmospheric aerosols. Global climatology and radiative characteristics. Hampton Virginia: A. Deepak publishing, 1991.
[19] Hovenier JW, Volten H, Muñoz O, van der Zande WJ, Waters LBFM. Laboratory studies of scattering matrices for randomly oriented particles: potentials, problems, and perspectives. JQSRT 2003; 79-80:741-755.
Figure Captions
Figure 1. Unnormalized phase functions (a) and retrieved size distributions (b) of small droplets. The symbols “w”, “e” and “d” stand for water, ethanol, and DEHS particles, respectively.
Figure 2. Unnormalized phase function (a) and retrieved size distribution (b) of large water droplets.
Figure 3. 3D plot of RMS errors vs the imaginary and the real parts of the refractive index of small DEHS droplets.
Figure 4. 3D plot of RMS errors vs the imaginary and the real parts of the refractive index of large water droplets.
Tables
Table. True values of the real part of the refractive index, estimated values of the complex refractive index and assessed values of integral parameters. DVM stands for the volume
median diameter. 5%+95% and 50%+50% are the DEHS-ethanol mixture of 95% and 50% of ethanol, respectively. The cases, shown in Figs. 1 and 2, are highlighted in bold.
Complex refractive index Size
True value Retrieved values Retrieved values
Real part Real part Imaginary part Generated particles Mean diameter, m
VM D , m
Water 1,329 1,311 < 1E-04 small 1,57 2,00Water 1,329 1,324 < 1E-04 mean 2,88 10,89
Water 1,329 1,329 < 1E-04 large 26,3 79,34
DEHS 1,450 1,455 < 1E-04 small 0,41 1,68
Ethanol 1,360 1,350 < 1E-04 small 1,51 2,62
5%+95% 1,370 1,375 < 1E-04 large 1,83 54,39
Figure 1. Unnormalized phase functions (a) and retrieved size distributions (b) of small droplets. The symbols “w”, “e” and “d” stand for water, ethanol, and DEHS particles, respectively.
Figure 2. Unnormalized phase function (a) and retrieved size distribution (b) of large water droplets.
1e-10 1e-06 0.01 100 1.1 1.2 1.3 1.4 1.5 1.6 1.7 1.8 1.9 0.01 0.1 1 Imaginary part Real part RMS 0 0.1 0.2 0.3 0.4 0.5 0.6 0.7 0.8
Figure 3. 3D plot of RMS errors vs the imaginary and the real parts of the refractive index of small DEHS droplets.
1e-10 1e-08 1e-06 0.0001 0.011 100 1.1 1.2 1.3 1.4 1.5 1.6 1.7 1.8 1.9 0.1 1 RMS Imaginary part Real part RMS 0.1 0.2 0.3 0.4 0.5 0.6 0.7
Figure 4. 3D plot of RMS errors vs the imaginary and the real parts of the refractive index of large water droplets.