Development of a Graphical Approach to
Software Requirements Analysis
by
Xinhui Chen
B.E., M.E., Engineering Physics (1989, 1991) Tsinghua University, Beijing
M.S., Nuclear Engineering (1996)
Massachusetts Institute of Technology
Submitted to the Department of Nuclear Engineering in Partial Fulfillment of the Requirements for the Degree of
Doctor of Philosophy at the
Massachusetts Institute of Technology May 1998
© Massachusetts Institute of Technology, 1998. All rights reserved.
Signature of Author... . ... i . . .... oo A .. ..... o .. o o o o . o o . o o o o o o o ... o. Department of Nuclear Engineering
May 1, 1998
C ;P
Certified by ... '""... ... Prof. GeorgeE. Apostolakis, Nuclear Engineering
Thesis Supervisor Certified by..
Pro<f7l W olay, Nuclear Engineering Thesis Reader
Accepted by ... ... ... . . .... ce id Prof. Lawrence M. Lidsky Chairman, Department Committee on Graduate Students
Development of a Graphical Approach to
Software Requirements Analysis
by
Xinhui Chen
Submitted to the Department of Nuclear Engineering on May 1, 1998 in Partial Fulfillment of the
Requirements for the Degree of Doctor of Philosophy
Abstract
A user-friendly graphical approach has been developed in the requirements analysis of mission-critical digital systems, especially in assuring the consistency of software requirements. This approach contains three distinct steps. Step One is software requirements collection which collects all the requirements from the customer. Step Two is requirements grouping which divides the set of requirements collected from Step One into smaller groups (or subsets), the union of which is the original set of requirements. Requirements on a specific aspect of software functionality are grouped together so that only logical operations exist within each group. The requirements between the groups (or subsets) may be linked by physical relations. Step Three is the actual analysis procedure for achieving unambiguous, consistent (and more complete) requirements. The procedure contains two sub-step analyses: the within-group analysis and the between-group analysis. A Tree-Based Graphical Approach (TBGA) is developed for the within-group analysis to ensure that the requirements are consistent within individual groups. Compared with the Purely Analytical Approach, the Tree-Based Graphical Approach is more mechanical since the analytical approach is sequential or one-dimensional while the graphical approach works in parallel or two-dimensional. As a byproduct, it can also be used to prove logic identity. In addition, two other approaches are identified for the within-group analysis in requirements: the Truth-Table Approach and the Dynamic Flowgraph Methodology (DFM). These methods can be used independently as well as used as a double check of the Tree-Based Graphical Approach. The between-group analysis is performed using dependency diagram in which each group of the requirements is represented by a node. If the groups are related physically, they are linked by an arc. The between-group analysis makes use of physical laws to check consistency in requirements between the groups as well as helps make individual group of requirements more complete. The between-group analysis indicates that, in requirements analysis, physics laws should be taken into account in addition to pure logic operations. If the within-group analysis shows that the requirements are consistent within each group and the between-group analysis show that the they are consistent between all linked groups, the customer's original set of requirements is consistent. Otherwise, it is inconsistent. In either case, the result of the analysis should be fedback to and shared with the customer.
Thesis Supervisor: George E. Apostolakis Title: Professor of Nuclear Engineering
Acknowledgments
I wish to thank Professor George Apostolakis for his consistent support and regular discussions during the course of my dissertation. His quick grasp of both technical and personal issues has made my dissertation possible.
I acknowledge and thank Dr. John Bernard and Professor Michael Golay for serving on my Doctoral Thesis Committee in the past two years. The case study provided by Dr. Bernard is especially invaluable in testing the usability and effectiveness of the proposed methodology. I thank them for their continuous involvement and suggestions. I appreciate Christopher Garrett for many technical discussions, as well as his help of English in Chapters 4 and 5 of the dissertation.
My, appreciation goes to Idaho National Engineering and Environmental Laboratory (INEEL)
for sponsoring the cutting-edge research. I especially acknowledge Steven Novack for valuable discussions during the course of the project.
Deepest of all, I thank my wife Shuying for her consistent support and encouragement (without which I would not have made it) before and while I fulfilled my dream of a Ph.D. in the world's most prestigious institution. I thank my son Kevin for his understanding of my balance as a father and a Ph.D. candidate, and the joy he has brought to my entire family. I feel owing a debt to my parents, parents-in-law for taking care of Kevin as well as supporting my wife and myself. I thank my only brother, Xinjun, for his filial support to my parents during the years I was absent and his continuous encouragement to me. The sacrifices of my family are gratefully acknowledged.
Table of Contents
Abstract...
3
Acknowledgments ...
5
Table of Contents ...
7
List of Figures...
15
List of Tables ...
17
List of Acronyms ...
19
Chapter 1 Introduction ...
21
1.1 A B roader Picture ... ... 211.1.1 Moving towards Risk-Informed, Performance-Based Regulation... 23
1.1.1.1 Deterministic-Based Regulation ... ... 23
1.1.1.2 Risk-Informed, Deterministic-Based Regulation... 23
1.1.1.3 Performance-Based Regulation... ... 24
1.1.1.4 Risk-Informed, Performance-Based Regulation ... 25
1.1.2 Importance of RIPBR ... 25
1.2 Statement of the Problem... 27
1.3 The Waterfall Model and Software Requirements Analysis ... 29
1.3.1 The Waterfall Model... 29
1.3.2 Requirements Analysis ... 29
1.3.3 Importance of Requirements Analysis ... ... 31
1.3.4 Inadequacy of Natural Languages in Documenting Software Requirements ... 31
1.3.5 Attributes of Software Requirements Specification... .... 33
2.1 Form al M ethods ... ... 35
2.1.1 D efinition ... .... 35
2.1.2 Categorization of Formal Methods ... 36
2.1.3 Taxonomy of Degrees of Rigor in Formal Methods... 37
2.1.4 Formal Methods and the Industry ... ... 41
2.1.4.1 Advantages of Formal Methods... ... 41
2.1.4.2 Disadvantages of Formal Methods ... 41
2.2 Finite State M achine ... 43
2.3 An Overview of Methodologies on Software Requirements Analysis ... . 47
2.3.1 Software Cost Reduction (SCR) ... ... 47
2.3.1.1 SCR Tabular N otation ... 47
2.3.1.2 An Example in SCR Notation... ... 47
2.3.1.3 Tool Support for SCR Notation ... ... 51
2.3.1.4 A Counterexample for SCR Notation ... 51
2.3.2 Requirements State Machine Language (RSML) ... 54
2.3.2.1 RSML and Its Tool Support... ... 54
2.3.2.2 R SM L and SCR ... 56
2.3.3 PVS Verification System ... ... 58
2.3.4 Quasi-Classical (QC) Logic ... ... 59
2.3.5 Fuzzy Logic and Utility Function... ... 59
2.3.6 Structured Analysis and Design Technique (SADT) ... 59
2.3.7 Systematic Activity Modeling Method (SAMM)... 60
2.3.8 Higher Order Software (HOS) ... ... 60
2.3.9 Requirements Statement Language (RSL)... 60
2 .4 Sum m ary ... 6 1
Chapter 3 Fundamentals of Discrete Mathematics ...
63
3.1 Definitions and Terminology ... 63
3.2 Propositional Calculus ... 66
3.2.1 Basic Propositional Operations... 66
3.2.1.1 N egation... 66
3.2.1.2 Conjunction... 66
3.2.1.3 D isjunction ... 67
3.2.1.4 Im plication ... 67
3.2.1.5 Equivalence... 69
3.2.2 Derived Propositional Operations... ... 69
3.2.2.1 Exclusive OR ... 69
3.2.2.2 N A N D ... 69
3.2.2.3 N O R ... ... 70
3.2.3 Important Logic Laws ... 70
3.2.4 Important Inference Rules... 70
3.2.5 Some Important Theorems... 70
3.3 Predicate C alculus... ... 76
Chapter 4 The Proposed Methodology ... ... 79
4.1 Introduction ... ... 79
4.2 Graphical Representation of Logic Operations... ... 81
4.3 Procedure in the Proposed Graphical Approach... . 83
4.4 The Proposed Graphical Approach and An Example ... 85
4.4.1 Requirements Grouping and Its Benefits ... 85
4.4.2 W ithin-Group A nalysis ... 88
4.4.2.1 Inspection... 89
4.4.2.2 V ariable D efinitions ... 89
4.4.2.3 Translation of Requirements from English to Logic Expressions... 90
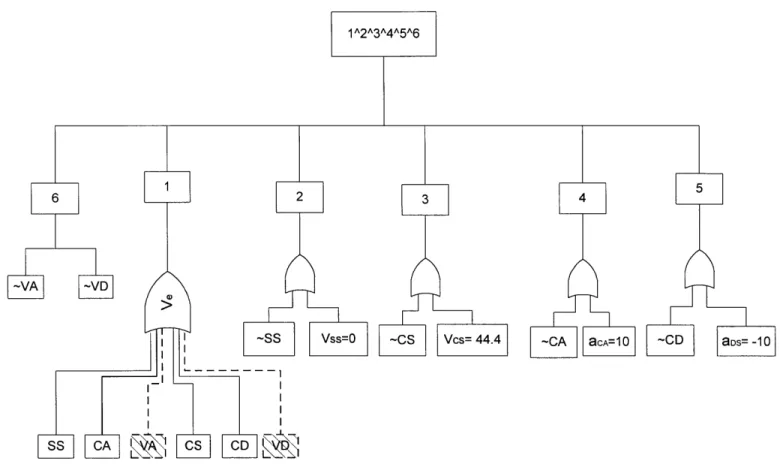
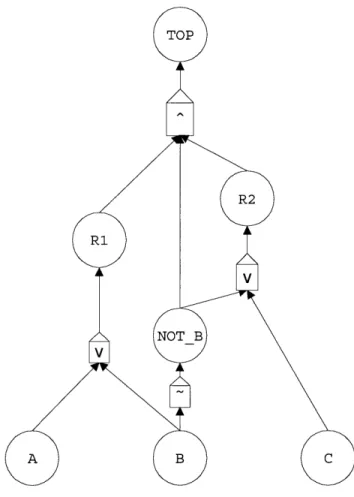
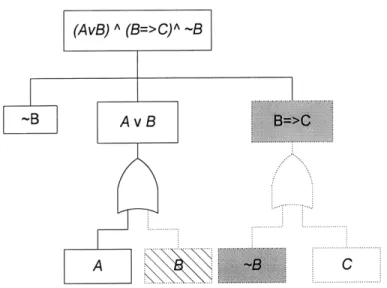
4.4.2.4 Tree-Based Graphical Approach... ... 90
4.4.2.5 Tree-Based Graphical Approach vs. Fault Tree Analysis... 93
4.4.3 Between-Group Analysis ... 96
4.5 Four Approaches Applicable to Within-Group Analysis... . 99
4.5.1 A Sim ple Exam ple ... 99
4.5.3 The Truth-Table Approach ... 102
4.5.4 The Dynamic Flowgraph Methodology (DFM) Approach... 105
4.5.4.1 Features of DFM ... 105
4.5.4.2 Automated Tool ... 106
4.5.4.3 Previous Applications of DFM ... 109
4.5.4.4 Use of DFM to Find Prime Implicants of Logic Expressions ... 109
4.5.4.5 Application of DFM to Requirements Analysis ... 110
4.5.5 The Tree-Based Graphical Approach... 115
4.5.6 Sum m ary... 115
Chapter 5 Application of the Proposed Approach to a Case Study... 119
5.1 Description of the Case Study... 119
5.1.1 MIT-SNL Period-Generated Minimum Time Control Laws ... 119
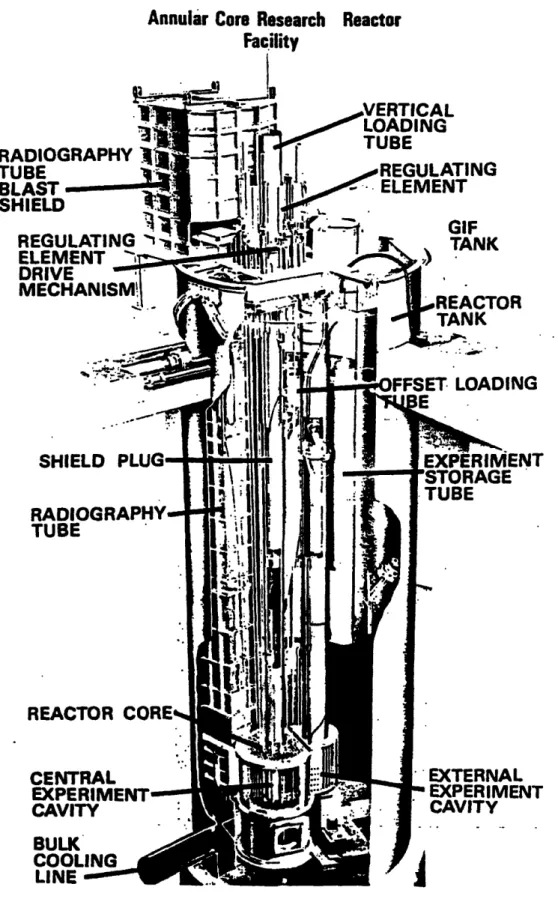
5.1.2 Annular Core Research Reactor... 122
5.2 Requirements Collection... 124
5.3 Requirements Grouping ... 130
5.3.1 G eneral Inform ation ... 130
5.3.2 Power Multiplication Group ... 130
5.3.3 Operational Mode Group ... 131
5.3.4 Fuel Temperature Group ... 131
5.3.5 Reactor Period Group ... 132
5.3.6 Reactivity Group ... 132
5.3.7 Motor Frequency Group ... 133
5.3.8 Rod Velocity Group ... 134
5.3.9 Hardware and Other non-Software Group ... 135
5.4 Within-Group Analysis ... 137
5.4.1 G eneral Inform ation ... 137
5.4.2 Power Multiplication Group ... 137
5.4.2.1 Analysis by Inspection ... 138
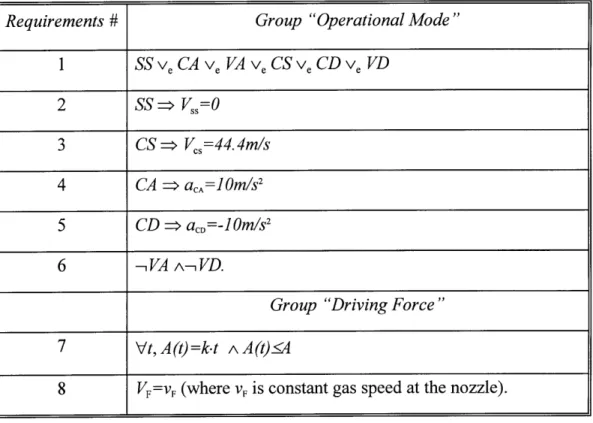
5.4.3 Operational Mode Group ... 139
5.4.3.1 The Analytical Approach ... 143
5.4.3.2 The Truth-Table Approach ... 144
5.4.3.3 The DFM Approach ... 149
5.4.3.4 The Tree-Based Graphical Approach... 155
5.4.3.5 Order Analysis in the Tree-Based Graphical Approach ... 159
5.4.3.6 L essons L earned... 160
5.4.4 Fuel Temperature Group... 167
5.4.4.1 Analysis by Inspection ... 167
5.4.4.2 L essons L earned... 167
5.4.5 Reactor Period Group ... 167
5.4.6 R eactivity G roup ... ... 168
5.4.6.1 Analysis by Inspection ... 169
5.4.6.2 Analysis by Tree-Based Graphical Approach... 169
5.4.6.3 Lessons Learned... 172
5.4.7 Motor Frequency Group ... 172
5.4.7.1 Analysis by Inspection ... 173
5.4.8 Rod Velocity Group ... 174
5.4.9 Hardware and Other non-Software Group ... 175
5.4.10 Revised Requirements after Within-Group Analysis... 176
5.5 Between-Group Analysis ... 180
5.5.1 Power Multiplication-Reactor Period... 180
5.5.2 Power Multiplication-Operatioal Mode ... 186
5.5.3 Reactor Period-Rod Velocity ... 190
5.5.3.1 Reactor Period-Rate of Reactivity... 190
5.5.3.2 Rate of Reactivity-Rod Velocity ... 191
5.5.4 Rod Velocity-Motor Frequency ... 193
5.5.5 Operational Mode-Fuel Temperature ... 195
5.5.6 Reactor Period-Reactivty ... 195
Chapter 6 Conclusions and Future Work... 201
6.1 Conclusions and Findings ... 201
6.2 Future Work ... 203
R eferences ... ... 205
Appendix 1 Differences between Digital Systems and Analog/Mechanical Systems ... 227
Al.1 Different Complexities... 227
Al.1.1 Software Complexity Measures ... 227
Al.1.2 Software Maintainability Index ... 228
A1.2 Different Behaviors and Mathematical Modeling... 229
A1.3 Different Data Manipulation Processes ... 230
A1.4 Different Production Processes ... 230
Al.5 Different Failure Modes ... 232
A1.6 Different Failure Manifestation Patterns... 232
A1.7 Different Consequences ... 233
A1.8 Different Weightings in Cost Structure ... 233
A1.9 Different Destinies ... 234
Appendix 2 A Survey on Software Development Cycle Models ... 237
A2.1 The Code-and-Fix Model ... 237
A 2.2 The W aterfall M odel ... ... 238
A2.2.1 Planning Activities... 238
A2.2.2 Software Requirements Analysis ... 239
A2.2.3 Software Design... 239
A2.2.4 Software Implementation... 239
A2.2.5 Software Testing ... 239
A2.2.6 Software Installation ... 240
A2.2.7 Operation and Maintenance ... 240
A2.3 The Evolutionary Development Model... 240
A2.4 The Transform Model ... 241
A2.5 The Spiral Model ... 242
A2.5.1 A Typical Cycle of the Spiral ... 242
A2.5.2 Initiating and Terminating the Spiral ... 242
A2.5.3 Advantages and Disadvantages of the Spiral Model... 243
Appendix 3 Recommended Practices to Improved Software Quality ... 245
A 3 .1 T estin g ... 24 5 A3.1.1 Black Box Testing and White Box Testing ... 245
A3.1.2 Unit Testing, Integration Testing, System Testing and Acceptance Testing ... 247
A3.1.3 Boundary Condition Testing ... 247
A3.1.4 Drawbacks of Testing ... 248
A3.2 Design Diversity ... 250
A3.3 Commercial Off-the-Shelf (COTS) Software ... 251
A3.4 Reusable Software Modules ... 252
A3.4.1 Benefits from Reusable Modules ... 252
A3.4.2 Guidelines on Software Modularization ... 253
A3.5 Object-Oriented Programming (OOP) ... 255
A3.5.1 Characteristics of Object-Oriented Paradigm ... 255
A 3.5.2 Benefits of O OP ... ... ... ... 256
A3.6 Fault Avoidance ... 257
Appendix 4 A Survey on Formal Methods ... 259
A4.1 Vienna Development Method (VDM) ... 259
A4. 1.1 Components of a VDM Specification ... 259
A4.1.2 The Weakest Pre-Condition ... 260
A4.1.3 An Example in VDM ... 262
A 4 .2 Z ... 2 6 5
A 4.2.1 The Z N otation ... ... 265
A4.2.2 Z and VDM ... 266
A4.2.3 An Example in Z ... 266
A4.3 Development Before the Fact (DBTF) and the 001 System ... 270
A4.4 Symbolic M odel Verifier (SM V) ... 273
A4.4.1 The SMV Notation... 273
A4.4.2 An Example in SMV ... 274
Appendix 5 Software Safety Analysis Methodologies ... 277
A5.1 Software Fault Tree Analysis (SFTA) ... 277
A5.1.1 An Upper Bound of the Probability of Top Event ... 279
A5.1.2 Applications of SFTA and Tool Support ... 282
A5.2 The Dynamic Flowgraph Methodology (DFM)... 284
A5.3 HAZards and OPerability Analysis (HAZOP)... 287
Appendix 6 Application of TBGA to Prove Logic Identity ... 291
Appendix 7 Another Graphical Method Developed to Document Software Requirements Specification ... 295
A7.1 An M-ary Tree-Based Graphical Method and An Example... 296
A7.2 Advantages of the Graphical Method ... 298
A 7.3 F indings... 299
Appendix 8 Application of Flowchart in Code Analysis ... 303
A8.1 The Flowchart ... 303
A8.2 Application of Flowchart ... 303
A8.3 Code Listing of Function REACTR(P)... 309
Appendix 9 Proofs of Theorems in Section 3.2.5 ... ... 313
List of Figures
Figure 1.3-1 Figure 2.1-1 Figure 2.2-1 Figure 2.3-1 Figure 2.3-2 Figure 2.3-3 Figure 4.3-1 Figure 4.4-1 Figure 4.4-2 Figure 4.5-1 Figure 4.5-2 Figure 4.5-3 Figure 4.5-4 Figure 5.1-1 Figure 5.2-1 Figure 5.4-1 Figure 5.4-2 Figure 5.4-3 Figure 5.4-4 Figure 5.4-5 Figure 5.4-6 Figure 5.4-7 Figure 5.4-8 Figure 5.4-9The W aterfall M odel... Formal Methods and the Hierarchical Components ... A Graphical FSM Equivalent to Table 2.2-1 ... Code Segment from [Viol96]... The M-ary Tree-Based Graphical Method ... RSML Specification of the Example in Table 2.3-1 ... Schematic of the Proposed Graphical Approach ... Within-Group Analysis for Group "Driving Force" in the Example ... Between-Group Analysis for the Example ... DFM Model for the Example... DFM Result for the Example (Screen Dump) ... Tree-Based Graphical Approach for the Example ... Order-Independence of the Tree-Based Graphical Approach... Isometric View of Annual Core Research Reactor ... Transient Rod Worth... DFM Model for the Case Study... ...
DFM Results for the Case Study (Screen Dump)... Within-Group Analysis Using the Tree-Based Graphical Approach
(Operational Mode Group) (A) SO= true (B) PO= true... Order Analysis for the Within-Group Analysis
(Operational Mode Group, PO = true, 1/6) ... Order Analysis for the Within-Group Analysis
(Operational Mode Group, PO = true, 2/6) ... Order Analysis for the Within-Group Analysis
(Operational Mode Group, PO = true, 3/6) ... Order Analysis for the Within-Group Analysis
(Operational Mode Group, PO = true, 4/6) ... Order Analysis for the Within-Group Analysis
(Operational Mode Group, PO = true, 5/6) ... Order Analysis for the Within-Group Analysis
30 38 46 49 55 57 84 95 98 114 114 116 116 123 133 150 154 157 161 162 163 164 165
Figure 5.4-10 Figure Figure Figure Figure Figure Figure Figure Figure Figure Figure Figure Figure Figure Figure Figure Figure Figure Figure Figure Figure Figure Figure Figure Figure Figure 5.4-11 5.5-1 5.5-2 5.5-3 5.5-4 5.5-5 5.5-6 5.5-7 5.5-8 5.5-9 Al-1 A1-2 A4-1 A4-2 A4-3 A5-1 A5-2 A6-1 A6-2 A7-1 A7-2 A7-3 A8-1 A8-2 A8-2
(Operational Mode Group, PO = true, 6/6)... Within-Group Analysis Using the Tree-Based Graphical Approach
(Reactivity Group) ... ... Transient Rod Worth (same as Figure 5.2-1) ... Dependency Diagram for Between-Group Analysis of the Case Study ... Possible Power Trajectories ... Possible Reactor Period Trajectory ... ... A New Requirement on the Initial Power Levels ... Rate of Change of Reactivity (in $/sec) ... ...
Dynamic Rod Velocity with Initial Rod Position at 4062 Units ... Maximum rod Velocity vs. Initial Rod Position... A New Requirement on the Initial Power Levels
(same as Figure 5.5-4)... Transient Rod Worth (same as Figure 5.2-1) ... Relationship between SMI and Maintainability ... Failure Rates in Analog and Digital Systems
(A) An Analog System (B) A Digital System ... Implicit Function Specification... An Example of Specification in Z ... ... SMV Specification for a Thermostat ... ... Union of Sets A and B-Cardinality ... ... An Overview of the SDA Procedure... Application of the Proposed Graphical Approach to Example A6-1 ... Application of the Proposed Graphical Approach to Example A6-2... M-ary Tree Developed at Step 3 of the Example ... M-ary Tree Developed at Step 4 of the Example ... M-ary Tree Developed at Step 5 of the Example ... At "check" Point, x is confined to [a, b] if a < b ...
Code Analysis Using Flowchart (1/2)... ...
Code Analysis Using Flowchart (2/2) ...
166 171 179 181 183 183 189 192 192 194 198 200 231 235 261 269 275 280 289 293 293 300 301 302 306 307 308
List of Tables
Table Table 2.2-1 2.3-1 Table 2.3-2 Table 3.2-1 Table 3.2-2 Table 3.2-3 Table 3.2-4 Table 3.2-5 Table 3.2-6 Table 3.2-7 Table 3.3-8 Table 3.2-9 Table 3.2-10 Table 3.2-11 Table 3.3-1 Table 3.3-2 Table 4.2-1 Table 4.4-1 Table 4.4-2 Table 4.4-3 Table 4.5-1 Table 4.5-2 Table 4.5-3 Table 4.5-4An Example of Mealy Machine ... ...
The SCR Notation of a Trip Meter
(A) Tabular Notation for the Last Section in Figure 2.3-1
(B) An Equivalent of (A) ... ... (A) Corresponding Super-Table of the Code Segment
(B) An Equivalent of (A) ... ... Truth Table for Negation (-P) ... ... Truth Table for Conjunction (PAQ) ...
Truth Table for Disjunction (PvQ) ... ... Truth Table for Implication (PoQ)... ...
Truth Table for Equivalence (P>Q) ... ...
Truth Table for Exclusive OR (Pv, Q)... ...
Truth Table for NAND (PIQ)...
Truth Table for NOR (P Q) ... ...
Important Logic Laws... Important Inference Rules... Some Important Theorems in Propositional Calculus ... Universal Quantification and Existential Quantification ... Some Important Theorems in Predicate Calculus... Graphical Representation of Basic Propositional Operations... Example: Requirements on an Auto Controller... ... Example: Mathematical Representation of
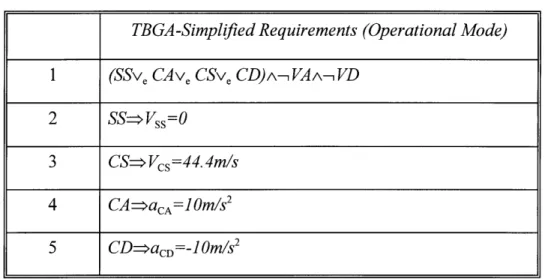
Requirements for an Auto Controller ... Example: Simplified but Equivalent Representation of Requirements Using the Tree-Based Graphical Approach ... Simple Example: Requirements for a Computer System ... Simple Example: the Purely Analytical Approach ... Simple Example: the Truth Table Approach ... Building Blocks of a DFM Model ... ...
45 50 53 71 71 71 71 72 72 72 72 73 74 75 77 77 82 86 91 94 100 100 104 107
Table 4.5-5 Prime Implicants Generated by DFM for Four Test Cases... 111
Table 4.5-6 Simple Example: Decision Table for Transfer Box 1 ... 113
Table 4.5-7 Simple Example: Decision Table for Transfer Box 2... 113
Table 4.5-8 Simple Example: Decision Table for Transfer Box 3... 113
Table 4.5-9 Simple Example: Decision Table for Transfer Box 4... 113
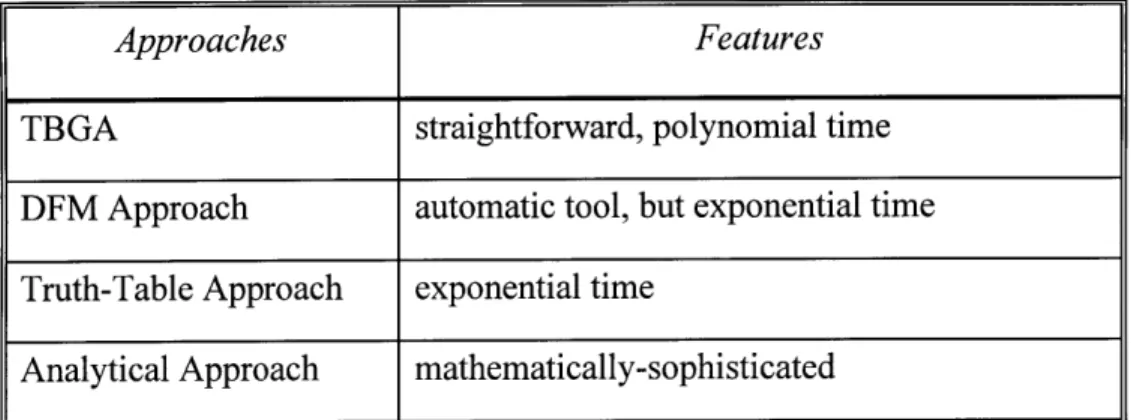
Table 4.5-10 Comparison of the Four Approaches in Within-Group Analysis ... 117
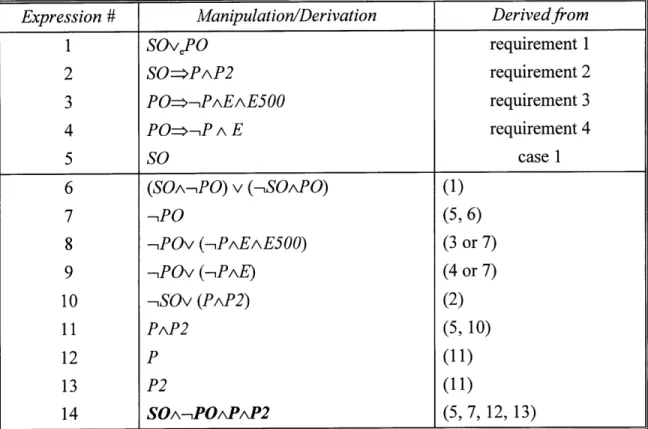
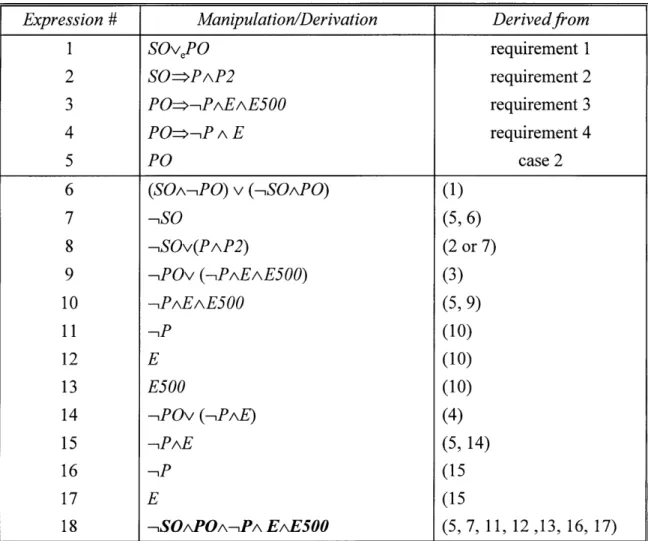
Table 5.4-1 Case Study: the Purely Analytical Approach (Operational Mode Group) (A) Case 1: SO = true ... 145
(B) Case 2: PO = true ... 146
Table 5.4-2 Case Study: the Truth-Table Approach (Operational Mode Group) ... 147
Table 5.4-3 Case Study: Intermediate Nodes and Logic Expressions in Figure 5.4-1... 151
Table 5.4-4 Case Study: Decision Table in the DFM Model ... 152
Table A3-1 Cost of Software Testing ... 249
Table A3-2 Coupling and Software Maintenance ... 254
List of Acronyms
ABB-CE ABWR ACRR AECB ANS CANDU CFR CNF COTS DBTF DFM DNF DOD ETA FSM FTA GE HAZOP IAEA I&C IEC IEEE INEEL/INEL IPE IPEEE LOC MCSAsea Brown Boveri/Combustion Engineering Advanced Boiling Water Reactor
Annular Core Research Reactor
Atomic Energy Control Board (of Canada) American Nuclear Society
CANada Deuterium Uranium (Reactor) Code of Federal Regulations
Conjunctive Normal Form Commercial-Off-The-Shelf Design Before The Fact
Dynamic Flowgraph Methodology Disjunctive Normal Form
Department of Defense Event Tree Analysis Finite State Machine Fault Tree Analysis General Electric
HAZard and OPerability (Analysis) International Atomic Energy Agency Instrumentation and Control
International Electrotechnical Commission Institute of Electrical and Electronics Engineers
Idaho National Engineering and Environmental Laboratory Individual Plant Examination
Individual Plant Examination-External Events Lines of Code
MIT Massachusetts Institute of Technology
MITR Massachusetts Institute of Technology Research Reactor MTTF Mean-Time-To-Failure
NPP Nuclear Power Plant NRC National Research Council OOD Object-Oriented Design OOP Object-Oriented Programming PRA Probabilistic Risk Assessment QA Quality Assurance
RIPBR Risk-Informed Performance-Based Regulations RSML Requirements State Machine Language
RML Requirements Statement Language SBWR Simplified Boiling Water Reactor SCR Software Cost Reduction
SDD Software Design Document SNL Sandia National Laboratories SRA Software Requirements Analysis SRS Software Requirements Specification TMI Three Mile Island
TBGA Tree-Based Graphical Approach
USNRC United States Nuclear Regulatory Commission V&V Verification and Validation
Chapter 1
Introduction
1.1 A Broader Picture
Since the early 1970s, the United States Nuclear Regulatory Commission (USNRC) spent significant amount of resources in the development and application of Probabilistic Risk Assessment (PRA) technology including the ground-breaking work of the Reactor Safety Study-WASH-1400 in 1975. In 1979, the USNRC issued a policy statement entitled "(US) NRC Statement of Risk Assessment and the Reactor Safety Study Report (WASH-1400) in Light of the Risk Assessment Review Group Report" (Risk Assessment Review Group Report, NUREG/CR-0400). In addition to addressing specific criticisms of WASH-1400, the 1979 policy statement articulated limitations in the use of PRA in the regulatory arena. Many of these limitations have been addressed; however, some still remain pertinent today. Primary among these limitations is the characterization of uncertainties associated with calculated probabilities of reactor accidents. PRA methodologies have, however, provided a better means for identifying and characterizing the range of uncertainty.
The Three Mile Island (TMI) accident in 1979 substantially changed the character of the analysis of severe accidents worldwide. It led to a substantial research program on severe accident phenomenology. In addition, two major investigations of the accident (the Kemeny and Rogovin studies) recommended that PRA techniques be used more widely to augment the traditional deterministic methods of analyzing nuclear plant safety. In 1984, the USNRC completed a study (NUREG-1050) that addressed the state-of-the-art risk analysis techniques. In early 1991, the USNRC published NUREG-1150, "Severe Accident Risks: An Assessment for Five U.S. Nuclear Power Plants". In NUREG-1150, the USNRC used improved PRA techniques to assess the risk associated with five nuclear power plants. This study was a significant turning point in the use of risk concepts in the regulatory process and
enabled USNRC to greatly improve its methods for assessing containment performance given core damage initiation and subsequent accident progression. The methods developed for, and results from, these studies provided a valuable foundation in quantitative risk techniques.
PRA methods have been applied successfully in several regulatory activities and have proved to be a valuable complement to traditional deterministic engineering approaches. This application of PRA represents an extension and enhancement of traditional regulation rather than a separate and different technology. Several recent USNRC policies or regulations have been based, in part, on PRA methods and insights. These include the Backfit Rule (10 CFR 50.109, "Backfitting"), the Policy Statement on "Safety Goals for the Operation of Nuclear Power Plants" (51 FR 30028; August 21, 1986), the USNRC's "Policy Statement on Severe Reactor Accidents Regarding Future Designs and Existing Plants" (50 FR 32138; August 8, 1985), and the USNRC's "Final Policy Statement on Technical Specifications Improvement for Nuclear Power Reactors" (58 FR 39132; July 22, 1993). PRA methods also were used effectively during the anticipated transient without scram (ATWS) and station blackout (SBO) rulemakings, and have been used extensively in the generic issue prioritization and resolution process. Additional benefits have been found in the use of "Risk-Based Inspection Guides" to focus USNRC reactor inspector efforts and make more efficient use of USNRC inspection resources. Probabilistic analyses were extensively used in the development of the recently proposed rule change to reactor siting criteria in 10 CFR Part 100 (59 FR 52255; October 17, 1994), especially in the area of estimating the Safe Shutdown Earthquake ground motion for a nuclear reactor site.
Currently, the USNRC is using PRA techniques to assess the safety importance of operating reactor events and as an integral part of the design certification review process for advanced reactor designs. In addition, the Individual Plant Examination (IPE) program and the Individual Plant Examination - External Events (IPEEE) program have resulted in commercial reactor licensees using risk-assessment methods to identify any vulnerabilities.
1.1.1 Moving towards Risk-Informed, Performance-Based Regulation (RIPBR)
The purpose of applying risk-informed, performance-based approaches is to deal with uncertainties in regulatory decision-making, and to strategically consider how to ensure regulatory coherence during the transition from deterministic-based regulations to RIPBR.
1.1.1.1 Deterministic-Based Regulation
The USNRC has generally regulated the use of nuclear facilities (including nuclear materials and reactors) based on deterministic approaches. Deterministic approaches to regulation consider a set of challenges to safety and specify how those challenges should be mitigated. In other words, the deterministic approach establishes requirements for use of nuclear facilities and for engineering margin and quality assurance in design, manufacture, construction, and operation of nuclear facilities.
USNRC established its regulatory requirements to ensure that a facility is designed,
constructed, and licensed to operate without undue risk to the health and safety of the public. These requirements are largely based on deterministic engineering criteria. In addition, this approach assumes that adverse conditions can exist (e.g., equipment failures and human errors) and establishes a set of design basis events. It then requires that the licensed facility design include safety systems capable of preventing and/or mitigating the consequences of those design basis events to protect the public health and safety. As a matter, even the deterministic approach contains implied elements of probability. For example, reactor vessel rupture is considered too improbable to be included as an accident to be analyzed. However, the likelihood that a single emergency core cooling system or system train would not function was considered so high that safety train redundancy and protection against single failure were required.
1.1.1.2 Risk-Informed, Deterministic-Based Regulation
A risk-informed, deterministic approach to regulation enhances and extends this traditional,
* allowing consideration of a broader set of potential challenges to safety;
* providing a logical means for prioritizing these challenges based on likelihood and risk significance, and
* allowing consideration of a broader set of resources to defend against these challenges.
A risk-informed approach can be used to focus deterministic regulations by considering risk in a more coherent and comprehensive manner. By considering risk insights, operating experience, and engineering judgment, the USNRC and its licensees can focus regulatory approaches and licensee activities on those items most important to public health and safety. Where appropriate, a risk-informed regulatory approach can be used to reduce unnecessary conservatism in deterministic approaches or can be used to identify areas with insufficient conservatism and provide the bases for additional requirements. Deterministic-based regulations have been successful in protecting the public health and safety and risk insights are most valuable when they serve to focus the deterministic-based regulations and support the defense-in-depth philosophy.
1.1.1.3 Performance-Based Regulation
A performance-based regulatory approach requires at least four key elements:
* There are measurable parameters to monitor acceptable plant and licensee performance;
* Objective performance criteria are established to assess performance;
* There is licensee flexibility to determine how to meet established performance criteria;
* Failure to meet a performance criterion must not result in unacceptable consequences.
In theory, a performance-based approach can be implemented without the use of risk insights. This type of performance-based approach would require that objective performance criteria be based on deterministic analysis and performance history. This approach would provide
additional flexibility to the licensee to determine how to meet performance criteria. However, the net impact on public health and safety would be difficult to determine.
1.1.1.4 Risk-Informed, Performance-Based Regulation (RIPBR)
RIPBR uses risk insights, together with deterministic analyses and performance history, to develop measurable parameters for monitoring plant and licensee performance, as well as for developing criteria for performance assessment, and focuses on the results as the primary means of regulatory oversight. Similar to a risk-informed, deterministic-based approach, an approach based on RIPBR can be used to reduce unnecessary conservatism in deterministic approaches or can be used to support additional regulatory requirements. In addition, the approach can further focus performance-based approaches by defining the goal or purpose of the approach in terms of performance characteristics and safety significance and permitting the licensee additional flexibility in meeting the regulation. Performance-based initiatives can be considered for activities where objective performance criteria can be established for performance monitoring. Additional evaluation of performance-based approaches may result in a determination that a number of functional areas are not amenable to performance-based treatment.
1.1.2 Importance of RIPBR
The treatment of uncertainties is an important issue for regulatory decisions. Uncertainties exist in any regulatory approach and these uncertainties are the direct result of limitations in knowledge. These uncertainties and limitations existed during the development of deterministic regulations and attempts were made to accommodate these limitations by imposing prescriptive and overly conservative regulatory requirements. A probabilistic approach has exposed some of these limitations and provided a framework to assess their significance and assist in developing a strategy to accommodate them in the regulatory process.
RIPBR is widely recognized as an important step towards the elimination of the burden of the current deterministic-based, prescriptive regulatory structure and the restoration of the economic competitiveness of the nuclear power industry. Moving to a RIPBR approach will help develop more efficient and effective regulatory measures that focus directly on public safety and will provide a basis for optimizing the regulations. RIPBR will play an especially important role in the upcoming utility deregulation.
1.2 Statement of the Problem
Nuclear Power Plants (NPPs) rely on Instrumentation and Control (I&C) systems to support plant display, monitoring, control, and protection. Traditional I&C systems are analog systems based on hard-wired electromechanical and solid-state technology. Many of these analog systems are still in operation and proven to be effective. However, analog systems experience aging, e.g., drift in readings, random mechanical failures, environmental degradation. These issues inevitably increase the workload on plant surveillance and maintenance, and will lead to decreasing the overall availability of the NPPs, which, in return, will affect the competitiveness of the NPPs. On the other hand, as other industries are shifting towards digital systems, analog replacement parts are becoming more and more difficult to obtain in the market.
The new digital I&C systems have many advantages over the existing analog ones. Digital devices are essentially free of drift that afflicts analog devices, digital devices maintain their calibration better, thus reduce calibration and maintenance. Digital systems have improved system performance in terms of accuracy and computational capabilities, and they have higher data manipulation and storage capacities. As a result, the plant operational conditions will be better measured, monitored, and displayed. Digital systems can be easier to use and upgrade. A detailed comparison between digital and analog systems is provided in Appendix 1. The Canadians have extensive experiences in digital I&C in NPPs. About twenty-five years ago, their first digital system was implemented because of its better provision of on-line control of the CANDU reactors, specifically in controlling power level and xenon oscillations. In Europe, the N4 plant at the Chooz-B site in France and the Sizewell B plant in the United Kingdom have employed integrated digital I&C systems. The U.S. electric industry is approaching deregulation which allows the customers to have the option of selecting their utilities freely as they are doing in the telecommunication business. As a result, the energy utilities (including nuclear power industry) are facing fierce competition. It is under these circumstances that the U.S. nuclear power industry expects that analog I&C systems will be replaced by digital ones both in the existing NPPs and the advanced designs
which are currently under review by the USNRC. These new designs, including GE's Advanced Boiling Water Reactor (ABWR) and Simplified Boiling Water Reactor (SBWR), ABB-CE's System 80+, and Westinghouse's AP600, embody fully integrated digital I&C
systems[Chap9 5]
However, with the advent of the advanced digital technology, USNRC is very concerned about the potential new failure modes inherent in software. Among them are software design errors, common-cause errors, and other possible failure modes different from the hardware counterpart ([Thad93], [NRC97], [NRC95]).
Funded by Idaho National Engineering and Environmental Laboratory, this study is one prong of the three-pronged approach to the development of a methodology that would allow a regulator to use RIPBR in the licensing of software used in safety-critical nuclear power plant applications. The three throngs are
1. Identification of Issues and Selection of Case Studies; 2. Formal Method Development and Integration;
3. Formulation of Guidelines for Developing Performance Requirements.
The author's research was focused on software requirements analysis since, at this stage of the software development cycle, that is where
* the largest amount of error in software is found,
* these errors are the most expensive ones to correct, and * few methodologies exist.
1.3 The Waterfall Model and Software Requirements Analysis 1.3.1 The Waterfall Model
As the most widely used model in software standards, the Waterfall Model of software development process is comprised of seven distinct stages/phases: planning activities, software requirements analysis, software design, software implementation, software verification and validation (e.g., testing), software installation, and operation and maintenance (Figure 1.3-1). Feedback exists between stages. Once errors are detected stemming from a previous stage, it must be fed back to that stage such that modifications can be made. A detailed description of the Waterfall Model is provided in Appendix 2.
1.3.2 Requirements Analysis
Requirements Analysis is "a process of discovery and refinement" of customer
requirements[Pr
es8 7], of "removing errors in the statement of requirements"['Ices8]. The input to the analysis is the customer statement of requirements and the end product is a Software Requirements Specification (SRS) containing both functional and non-functional requirements. Functional requirements are statements of what a software system is supposed to do. Non-functional requirements are statements which are concerned with practical constraints upon the software developer (e.g., programming languages). The analysis requires both the developer and the customer take active roles. The customer attempts to reformulate his nebulous concept of software functions and performance into concrete details while the developer acts as interrogator, consultant, and problem solver.
1.3.3 Importance of Requirements Analysis
Studies have shown that about 50% of software faults can be traced back to faulty requirements or specification. Rushby reports that[Rush 96, of 197 critical faults found during integration and system testing of the Voyager and Galileo spacecraft, only 3 were coding errors (, 1.5%), the majority were in the requirements ( 49.2%, mostly of which is omission in the requirements), interfaces ( 24.6%), and design ( 24.6%). While working on project to develop a safety-critical system, Sayet found that, of all faults detected, 46% were in the specification phase, 46% in coding, and 8% during integration test[saye90]. Basili reports that 48% of the errors were due to incorrect or misinterpreted functional specification or requirements[Basi84]. Viola indicated that, in order to allow greater resolution for smaller error bars (e.g., representing number of coding errors), histogram of error diagram has to be rescaled by removing 160 errors identified from Software Requirements Specification review
process[Viol95]
More severely, these errors, if not detected and corrected early, can survive until later in the software development cycle when correcting them would be up to two orders of magnitude more expensive, or lead to project cancellation eventually. According to data presented by Fairley ([Fair85, pp.48-50]), it is 5 times more expensively to correct a requirement fault at the design phase than at requirements analysis phase, 10 times more expensively to correct at implementation phase, 20 to 50 times more expensive to correct at acceptance testing, 100 to 200 times more expensive to correct once the system is operating. According to [Zave95], requirements engineering is probably the most informal and subjective of all the areas in
computer science.
1.3.4 Inadequacy of Natural Languages in Documenting Software Requirements
Some of the reason as to why more errors tend to occur in the requirements or specification phase are as follows. First, the customer usually can not describe precisely what the software is supposed to do. Second, inadequate communication between the customer and the software
developer may result in a misunderstanding or misinterpretation of the requirements. Third, the customer's requirements are constantly evolving as the project progresses. Fourth, the software requirements written in natural language by the customer may be ambiguous, inconsistent, and/or incomplete. For example, Parnas presents four different interpretations of a requirement expressed in English concerning water levellPam91]. The original requirement is
"Shut off the pumps if the water level remains above l00m for more than 4s. "
Four interpretations of this requirement are
* "Shut off the pumps if the mean water level remains above 100m for more than
4s."
* "Shut off the pumps if the median water level remains above 100m for more than 4s."
* "Shut off the pumps if the root-mean-square water level remains above 100m for more than 4s."
* "Shut off the pumps if the minimum water level remains above 100m for more than 4s."
The second example describes the requirements of software to store, retrieve, add and delete telephone numbers from the telephone directory of a city. Citing this example, Butler shows the inadequacy of natural languages as a medium of recording formal specification[Butl93
] in
terms of addressing completeness and consistency issues. He concludes that "the process of translating the requirements into mathematics has forced us to enumerate many things that are usually left out of English specifications" and "the formal process exposes ambiguity and deficiencies in the requirements" of natural languages.
These examples and other experiences have demonstrated the inadequacy of natural languages in documenting precise requirements specification (due to their inherent ambiguity), especially in safety- and mission- critical applications such as nuclear reactor control and protection systems, airplane flight controller, crucial financial system.
1.3.5 Attributes of Software Requirements Specification
As the output of software requirements analysis, software requirements specification (SRS) is the highest-level specification of a software component in a system. An SRS specifies what a
software component must do and what it must not do (e.g., completeness). Seven attributes are identified in [USNRC95] for the SRS and are summarized here.
* Consistency-the requirements do not conflict with each other within an SRS; * Completeness-an SRS should include all necessary requirements, define
software response to all realizable classes of input data in all realizable class of situations, specify response to both valid and invalid input values;
* Unambiguity-the requirements are interpreted the same way by all readers,
that is, every requirement has one and only one interpretation;
* Verifiability-a practical method or process exists (inspection, demonstration,
analysis, or testing) to verify that an implementation fulfills the requirements;
* Readability--a reader can easily read and understand all the requirements, i.e.,
formality should not compromise readability and understand-ability;
* Modifiability--the requirements are easy to modify correctly, and
* Traceability-the origin of each of its requirements is clear and it facilitates
the referencing of each requirement in future development or enhancement documentation. Both forward and backward traceability should be provided.
The work in this dissertation will be focused on requirements analysis, especially on consistency, ambiguity and completeness of software requirements. The research leads to the development of a Tree-Based Graphical Approach in software requirements analysis.
Chapter 2
Current State of the Art and Practice
2.1 Formal Methods
2.1.1 Definition
The function of mathematical logic in digital systems is analogous to that of calculus in the traditional, continuous systems: as an analytical tool calculating and predicating the behavior of the systems as well as being a notation describing the systems. Rushby defines Formal
Methods as "methods that use ideas and techniques from mathematical or formal logic to
specify and reason about computation systems (both hardware and software)"[Rush95]. The term "formal" in the terminology refers to the idea that a proof can be known to be valid based on its "form" of reasoning, that is, the validity of a proof can be established by simply checking the syntax of an argument regardless of its semantics[Btl93, HoI95]. By contrast to fault removal
and fault tolerance, formal methods are fault avoidance techniques that will increase dependability of software by avoiding errors throughout the software development cycle.
In the 1970s, formal methods were focused on proofs of program correctness[Hoar69, Hoar71, Lond75] which turned out to be not only an expensive exercise, but a very difficult one. Since the 1980s, emphasis of formal methods has been shifting from program correctness to the use of formalism in specifications. It is realized that the majority of errors in the software can be traced back to the early phases of software development process, and the conventional techniques such as code review and testing are very effective removing coding errors[Rush93b
More recently, with the development of efficient techniques for model checking, attention of formal methods is being paid to large-scale mechanized model checking. However, due to limited expressiveness of temporal logic, model checking is prevented from fully characterizing the functionality required of a system. By contrast, emphasis is focused on the
important properties that the system should possess. Due to its excellent diagnostic ability in the form of counterexamples, model checking is usually focused on incorrectness of a program, e.g., finding errors, rather than proving its correctness.
Since no single tool or method is universal enough to support all the diverse applications of formal methods to software, a spectrum of them have been developed (see Section 2.3 and Appendix 4).
2.1.2 Categorization of Formal Methods
The definition of formal methods implies that the two primary components of formal methods are Formal Specification (e.g., "to specify") and Formal Verification (e.g., to "reason about"). Miner defines formal specification as "use of notations derived from logic to describe assumptions about the world in which a system will operate, requirements that the system is to achieve, and the intended behavior of the system"[Mne9 5
]. He also defines formal
verification as "use of formal logic to analyze specifications for certain forms of consistency, completeness, to prove that specified behavior will satisfy the requirements given the assumptions, to prove that a more detailed design implements a more abstract one."
Formal specification languages can be divided in to four categories (refer to Figure 2.1-1). The first two categories are suitable for the sequential systems while the next two categories are proper for the concurrent systems.
* Model-Oriented Specification Language The category models a system's desired behavior in terms of abstract mathematical objects such as sets, sequences (or lists), functions. Specification languages VDM and Z belongs to this category;
* Property-Oriented Specification Language The category can further be subdivided into axiomatic methods which use first-order predicate logic to express pre- and post-conditions of operations over abstract data types, and
algebraic methods based on multi-sorted algebra and relate properties of the system to equations over the entities of the algebra;
* Process Algebra Specification Language This category is applicable to the concurrent system through describing their algebra of communication processes. According to Rushby, this is the model-oriented counterpart for the
concurrent system[Rush93b];
* Temporal Logic Specification Language This category makes use of logic
designed to reason about timeLadk87,
Whit90, Alle83, Bouz95, Kaut91]. According to Rushby, this is the property-oriented counterpart for the concurrent system [Rush93b]
2.1.3 Taxonomy of Degrees of Rigor in Formal Methods
Rushby classifies formal methods into four levels of different rigor1 according to how and what formal methods are used[Rush93b]. This taxonomy is cited by [USNRC95].
* Level 0- No Use of Formal Methods
Level 0 corresponds to the mainstream of the current industrial practice in which verification is a manual process of review and inspection applied to documents written in natural languages, pseudocodes, or programming languages. Validation is based on testing driven either by software requirements specification or the structure of the program.
1 Butler seems to have a different taxonomy. In [Butl93], he defines * Level 1 as "Formal Specification of All or Part of the System",
* Level 2 as "Paper and Pencil Proof of Correctness" (which is consistent with Miner's definition, "specification using a formal specification language with manual proofs"[Mine95]), * Level 3 as "Formal Proof Checked by Mechanical Theorem Prover".
Model-oriented (e.g. VDM, Z)
Algebraic Method (e.g., Act One, OBJ)
Process Algebras
(e.g., CSP, CCS)
Formal Methods and the Hierarchical Components (based on [Hinc93], page 29 of [Rush93b])
38 Figure 2.1-1
eLevel 1 - Use of Concepts and Notation from Discrete Mathematics
The idea of Level 1 rigor of formal methods is to replace some of the natural language used in the software requirements specification with notations from logic and discrete mathematics. This level of rigor matches the way mathematics is used in most other engineering disciplines. Hence, this level of rigor is most liable to be accepted by the practitioners. Use of discrete mathematics at this level provides several benefits. First, the versatile collection of building blocks introduced in discrete mathematics can help in the development of clear, precise, and systematic statements of requirements, specifications, and designs. Second, discrete mathematics provides a compact set of notations that allows descriptions of requirements, specification, and design to be recorded and communicated with much less ambiguity than natural language such that the recorder and the reader can share the unique understanding of the notations. Third, axioms, theorems, and inference rules can systematically guide the elaboration of the specification or design from one level to another. Software Cost Reduction (SCR) introduced in Section 2.3.1 is an example of Level 1 formal method. Level 1 formal method is what this dissertation is intended to address. The purpose choosing this level of rigor is two fold. First, the proposed methodology should rely on minimal knowledge of formal logic and notations. Second, such a process helps analyst gain more insight than running a commercial package as a black box. If software requirements are proved inconsistent by a commercial package, a message will be displayed. However, no hint will be given as where the inconsistency is, nor will suggestions be given as how to remove the inconsistency through modifying the requirements.
* Level 2 - Use of Formalized Specification Languages with Some Mechanized Support Tools
In addition to retaining the benefits obtained from Level 1 applications of formal methods, Level 2 applications of formal methods may contain additional benefits. First, specification languages not only provide a standard
set of notations from discrete mathematics, but also address software engineering concerns and allow specifications to be structured into units (e.g., modules, abstract data types) with explicitly specified interface. Second, mechanized tools such as syntax checkers or type checkers allow more efficient detection of certain types of faults or make it easier to be the "living" documentation. Third, it is possible to generate a prototype implementation from a specification to explore certain properties of the specification.
However, Level 2 specification languages may be optimized for a specific domain of applications and cumbersome or inapplicable in other domains. As a result, they may lead to implementation bias as means of specification.
*Level 3 - Use of Fully Formal Specification Languages with Comprehensive Support Environments, Including Mechanized Theorem Prover or Proof Checker Using a specification language with formal proof techniques, this level of rigor has the highest level of rigor. Once the model is completely formalized, i.e., reduced to symbol manipulation, it is possible to mechanize proofs in terms of proof checker2, theorem prover3 or, most commonly, something in
between[Grov94
]. The advantages of this approach are that requirements, specification, and designs can be subjected to searching examination, and that mechanization eliminates faulty reasoning with higher certainty than the paper-and-pencil approach. But the fully formal specifications and automatic proofs are expensive to develop, usually with rather impoverished notation based on restricted logic for the sake of mechanized support. Therefore, one of the barriers of Level 3 methods is the readability and understandability associated with level of rigor. In general, the higher the level of rigor, the higher the cost. Depending on the benefits desired from the formal methods, the criticality of the application, and the resources available, higher levels of rigor of formal methods are not necessarily superior to lower level ones.
2 Proof checker is a computer program that checks the steps of a proof proposed by a human being. 3 Theorem prover is a computer program that attempts to discover proofs without the help of human being.
2.1.4 Formal Methods and the Industry
Most of the formal methods have been developed by computer scientists and are aimed at computer scientists or others with very strong background in discrete mathematics. As a result, when formal methods are developed by computer science community, they are usually difficult to be accepted by the practicing engineers due to the poor readability inherent in the methods. There is still a long way before formal methods are universally accepted by the industry.
2.1.4.1 Advantages of Formal Methods
* Experience gained from projects such as IBM's CICS shows that formal methods do not necessarily increase the development cost, nor do they necessarily cause delay[H mc9 3,
Bowe951. It is true that cost does increase in the initial
phases of the development process. However, benefit pays off later as coding and maintenance costs are reduced significantly. As a result, the overall development of software costs will be decreased.
* Even though complete formal development (i.e., including proof and refinement) requires a strong mathematical background, understanding and writing formal specification requires relatively less knowledge of mathematics. * Formal methods are not only beneficial to the safety-critical systems. In fact,
formal specifications help with any system[Hal90]
2.1.4.2 Disadvantages of Formal Methods
* Obstacles exist to getting started with formal methods. These obstacles include - lack of readability and understandability and insufficient education; - immaturity of tools and difficulty in choosing the proper tool. Many
tools in existence are domain specific, research prototypes not mature enough for industry application;
* Formal methods can not guarantee error-free software. Although formal methods enable us to check rigorously for consistency in requirements and reason about the properties of the requirement, human-generated specifications or proofs are error-prone and formal methods do not check if requirements
themselves are correct[Hnc9 3,
Hall90]
* Formal methods do not replace traditional software engineering methods such
as testing[ incc93, Bowe95]
* Errors may exist in the formal verification tools themselves.
For more information, interested readers in this topic should refer to [Hall90], [Bowe95], [Saie96], [Rose96], [Knig97], [Webe93], [Crai93], [Crai95].
2.2 Finite State Machine (FSM)
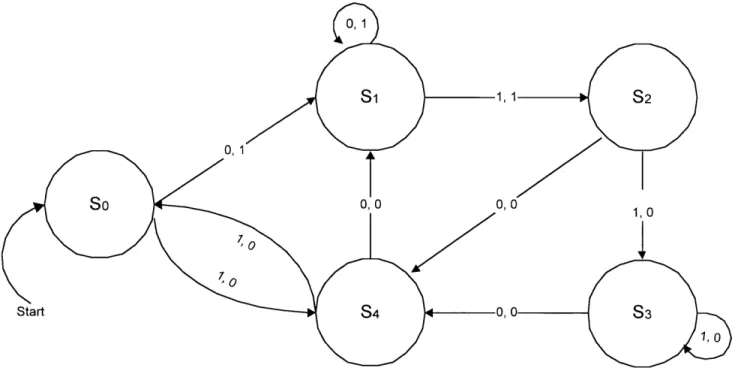
Used in many branches of computer science, a Finite-State Machine (FSM)[Rose9 5] is formally defined as a six-tuple4: M= (S, I, O, f g, so) comprised of a finite set of states S, a finite input ser I, a finite output set 0, a transition function
f
that assigns a new state to each state and input pair, an output function g that assigns an output to each state and input pair, and an initial state so. Two basic types of FSM are the Mealy machine and the Moore machine. For a Mealy machine, output is determined by both current inputs and current state. For a Moore machine, on the other hand, output is solely determined by the current state. The behavior of such a machine can be specified by giving rules of transitions between states and the set of output values corresponding to each state.FSM can be expressed using State Table to represent the transition function and output function for all pairs of states and input. FSM can also be represented by State Diagram, i.e., directed graph with edges labeled as (input, output) pairs and arrows indicating respective state transition. The advantage of the State Diagram is that the state transition and output functions are expressed clearly on the graph, but the clarity vanishes when the FSM has many states (e.g., 10 or more) since the state transition curves will inevitably overlap with each other, making it difficult to keep track of. For a deterministic FSM with n states, there could be as many as n2 state transition edges. On the other hand, the State Table is advantageous
when there are many states for an FSM. For each additional state, we can simply increase the size of the table (e.g., number of rows or columns). The disadvantage of the State Table is that, it is not as informative as the State Diagram in terms of state transition and output
functions. Hence, the State Table and State Diagram are complementary of each other.
It should be noted that the State Diagram looks very similar to the diagram of discrete Markov model [Rama93] in stochastic analysis, e.g., probability and reliability theory. But the
4 In [Lync96], a State Machine is defined to be a triple (Q, Q0, 8), where
* Q is non-empty (finite or infinite) set of states,
* Q0 is a non-empty subset of the states known as start states,
two diagrams have fundamental differences. In Markov model, edges are labeled with the probability of transitions from one state to another. The probability (or rate) is usually not unity, so transition from one state to others is random. Markov model usually doesn't touch upon input and output functions. In State Diagram, however, edges are labeled with ordered
(input, output) pair, indicating that the transition occurs from one state to another with the input and generates the output. For a deterministic FSM, the transition will occur with
probability of unity.
An example of Mealy machine with S= {so, s1, s2,, s3, s4 }, I= {0,1} and O = {0, 1} is shown
in Table 2.2-1 (State Table of the FSM). To read the table, the first row means that, if the FSM is in state so with input 0 at time to, the FSM will be in state s, with output g=l1 at time
tn+,; if the FSM is in state so with input 1 at time tn, the FSM will be in state s4 with output
g=0 at time tn+,. Figure 2.2-1 shows an equivalent FSM expressed in State Diagram. In the
diagram, states are labeled inside the circles with (input, output) pairs labeled on the edges whose directions represent state transitions.
An Example of Mealy Machine Input State 0 1 f g f g so S, 1 s4 0 S, S, 1 s2 S2 S4 0 S3 0 S3 S4 0 S3 0 S4 S, O so 0 Table 2.2-1
Figure 2.2-1 A Graphical FSM Equivalent to Table 2.2-1
2.3 An Overview of Methodologies on Software Requirements Analysis
2.3.1 Software Cost Reduction (SCR) 2.3.1.1 SCR Tabular Notation
SCR is the abbreviation for Software Cost Reduction, a formal notation developed by Parnas and others at the US Naval Research Laboratory between the late 1980s and the early
19 9 0s[Parn90a, Pa91, Pa95]. The concept of the methodology can be traced back to as early as the
1 9 70sTaus77]. The technique was tested and improved in a project involving an experimental redesign of the Onboard Operational Flight Program for the United States Navy's A-7E
aircraft[W'1 94].
Realizing that the conventional formal methods were mathematically too sophisticated, Parnas and his colleagues decided to seek a "middle road" to bridge the gap between the theorists and the practitioners. The SCR specification language they developed makes use of tabular notation based on finite-state machine model, e.g., via modes (states), condition statements, and action statements. It classifies all data items and identifiers according to type (e.g., input variable, mode, mode class) and uses special bracketing symbols to denote the type associated with an identifier although one does not have to use the brackets as in [McDo]. Besides, SCR can represent concurrency and temporal characteristics of a
systemlWil94]
2.3.1.2 An Example in SCR Notation
SCR has been successfully employed in a variety of practical systems, including avionics systems (e.g., a Shuttle CR for the "Heading Alignment Cylinder", in which SCR reveals that several rows in one table have inconsistent or incomplete conditions[Rush97]), the A-7 Operational Flight Program, a submarine communications system[Heit83], and safety-critical
systems of two Nuclear Power Plants: the Darlington plant in Canada[Joan,
Joan92, Vio195, Vio196] and
one in BelgiumCour93]. More recently, a version of the SCR method called CoRE was used to document the requirements of Lockheed's C-130J Operational Flight Program[Heit9 5a]