HAL Id: hal-00089713
https://hal-insu.archives-ouvertes.fr/hal-00089713
Submitted on 18 Feb 2010
HAL is a multi-disciplinary open access
archive for the deposit and dissemination of sci-entific research documents, whether they are pub-lished or not. The documents may come from teaching and research institutions in France or abroad, or from public or private research centers.
L’archive ouverte pluridisciplinaire HAL, est destinée au dépôt et à la diffusion de documents scientifiques de niveau recherche, publiés ou non, émanant des établissements d’enseignement et de recherche français ou étrangers, des laboratoires publics ou privés.
Increase in the bulk density of a Grey Clay subsoil by
infilling of cracks by topsoil
Ary Bruand, H. Cochrane, P. Fisher, Robert J. Gilkes
To cite this version:
Ary Bruand, H. Cochrane, P. Fisher, Robert J. Gilkes. Increase in the bulk density of a Grey Clay subsoil by infilling of cracks by topsoil. European Journal of Soil Science, Wiley, 2001, 52, pp.37-47. �hal-00089713�
Running heading: Bulk density of a clayey subsoil
Increase in the bulk density of a Grey Clay subsoil by
infillings of cracks by topsoil
A. BRUANDab, H. COCHRANEa, P. FISHERc & R.J. GILKESa a
Soil Science and Plant Nutrition, Faculty of Agriculture, The University of Western Australia, Nedlands, WA 6907, Australia, bUnité de Science du Sol, INRA-Orléans, BP 20619, 44166 Olivet Cedex, France, and bAgriculture Western Australia, Katanning, WA 6317, Australia
Summary
Increases in soil bulk density beyond the optimum reduce land productivity and, where soil is affected, may be difficult to remedy. Elucidating the mechanisms causing compaction is a prerequisite to sustainable management of fragile soils. We examined a dense grey soil in Western Australia in which the dominant physical feature of the subsoil was coarse prismatic structure. The prisms were approximately hexagonal in horizontal section with an average side length of 0.66 m. The top of the prisms reached to within approximately 0.07 m of the soil surface, their sides becoming indistinguishable below approximately 0.9 m. The vertical faces of the prisms were coated by material similar in composition to the topsoil and separated from it by a transition material of intermediate composition. Soil within the prisms had a bulk density at maximum swelling which reached a maximum of 1.86 g cm-3 in the upper subsoil. We investigate the hypothesis that such a high bulk density could have developed as a result of a simple three stage process: (1) soil shrinkage as the profile dries over summer leading to widening of cracks between prismatic peds, (2) infilling of cracks by detached topsoil which adds to coating thickness and (3) swelling during the winter, now partially restricted by coating material, leading to compression of the prismatic peds. We present a model which accounts quantitatively for this process and explain how soil physical characteristics might facilitate it. The dense upper subsoil (7–60 cm) limits root penetration and prolongs the period of transient waterlogging of the topsoil during winter, adversely affecting subsequent crop performance. Our work suggests that stabilizing surface soil to
minimize soil detachment could be a relevant management objective on these structurally unstable soils in order to prevent subsoil compaction.
Correspondence: A. Bruand, Institut des Sciences de la Terre d'Orléans, Université d'Orléans, Bâtiment Géosciences, rue de St Amand BP 6759, 45067 Orléans Cedex 2, France. E-mail: [email protected]
Accroissement de la densité apparente de l'horizon B d'un sol de type 'argile grise' à la suite d'un remplissage des fissures par des matériaux issus de l'horizon A.
Résumé
L'augmentation de la densité apparente au delà d'un optimum limite la fertilité du sol et il peut être difficile d'y remédier quand les horizons B sont affectés. Identifier les mécanismes qui sont à l'origine de cette augmentation de densité apparente est préalable nécessaire à une gestion durable des sols. Nous avons étudié un sol de type 'argile grise' en Australie Occidentale dans lequel la caractéristique physique dominante est la présence d'une structure prismatique de grande taille dans l'horizon B. Les prismes ont une section horizontale approximativement hexagonale et la longueur moyenne du côté est de 0,66 m. Le sommet des prismes se situe à environ 0,07 m en dessous de la surface et ils ne sont plus observables à partir d'environ 0,90 m de profondeur. Les faces verticales des prismes sont revêtues d'un matériau dont la composition est similaire à celle de l'horizon A. Entre ces revêtements et le prisme, un matériau de composition intermédiaire entre celle de l'horizon A et celle du prisme est présent. Le sol du prisme présente une densité apparente qui atteint sa valeur maximale de 1,86 g cm-3 dans la partie supérieure des prismes. Nous avons analysé l'hypothèse selon laquelle ces valeurs élevées de densité apparente pourraient résulter d'un processus en trois étapes : (1) dessèchement du sol durant l'été entraînant l'ouverture des fissures entre les prismes, (2) comblement des fissures par du matériau provenant de l'horizon A qui accroît ainsi l'épaisseur des revêtements et (3) gonflement durant l'hiver, cette fois partiellement restreint suite à l'addition de matériau sous la forme de revêtement, entraînant une compression des prismes. Nous présentons un modèle qui traduit quantitativement ce processus et explique comment de telles valeurs de densité apparente pourraient avoir été obtenues. La densité apparente dans la partie supérieure de l'horizon B (7–60 cm) limite la pénétration des racines et prolonge la période d'excès d'eau en surface durant l'hiver, restreignant les performances des cultures. Notre étude suggère qu'une stabilisation du sol en
surface afin de minimiser la détachabilité pourrait être un objectif de gestion de ces sols à structure instable.
Introduction
The bulk density (Db) of a soil is related to both particle density and porosity. As the particle
density of mineral soils varies little from 2.65 g cm-3, variation in Db between soils is due
mainly to differences in porosity. Soil porosity derives from the packing of primary particles and peds which varies according to soil formation processes, from cracking and as a result of biological activity. Together these features determine the soil's porosity and thus its bulk density. Relative to sands, clayey subsoils usually have low to medium Db at maximum
swelling because of the fairly loose packing of primary clay particles. Rawls (1983) plotted the bulk density of the mineral portion fraction from 2721 horizons stored in the US Department of Agriculture's soil database against their sand and clay content and found that the bulk density of soils with small organic carbon content and for clay, silty clay and sandy clay texture classes was 1.35 < Db < 1.65 g cm-3. Manrique & Jones (1991), using an updated
version of the data base, containing information approximately 12 000 pedons, showed that Db at maximum swelling was not so much closely related to texture because of the influence
of (i) large pores created by biological activity and tillage, and (ii) the stone and gravel content. Bulk density varies more with water content in clays than in soils of coarser texture because of swelling and shrinkage (Fredlund & Rahardjo, 1993). For highly swelling clay soils, swelling and shrinkage can be intense, causing surface heaving and subsidence as the soil wets and dries (Voltz & Cabidoche, 1995; Cabidoche & Voltz, 1995). In less highly swelling soils the swell-shrink behaviour of peds may be accommodated within a stable crack network leading to no variation of Db for the whole soil.
In the Western Australian wheatbelt, the soils are predominantly strongly weathered and have poor physical properties for crop growth (Moore, 1998). Many of the fine textured subsoils have undesirable structural characteristics, the majority are sodic, highly dispersive and poorly permeable (Cochrane & Aylmore, 1991; Cochrane et al., 1994), and bulk densities greater than 1.7 g cm-3 are common at maximum swelling. Root growth is restricted by mechanical impedance and by poor aeration, so that crops yield well below their potential for the climate (Gregory et al., 1992). As the reason for the compact nature of these soils is
unclear we aimed to show that the high bulk densities in a clayey subsoil could have resulted from a process involving cycles of shrinking and swelling and the infilling of the vertical crack network of the subsoil with topsoil.
Soil and samples
The soil studied lies 15 km East of Katanning (33° 45' S; 117° 40' E) on an experimental site which was being used at the time to investigate various approaches to soil management (Fisher et al., 1997). The soil is known locally as a Grey Clay, a term covering several soil series typified by their hardsetting topsoils and the very narrow range of moisture contents within which soil cultivation is possible. In the current Western Australian soil classification the soil is an Alkaline grey shallow loamy Duplex soil (Schoknecht, 1997). In the current Australian soil classification (Isbell, 1996) it is a Sodosol, and according to the descriptions given by Stoneman (1991) the soil is related to the Solonized Brown and Gleyed Podzolic soils of the Australian Great Soil Groups (Stace et al., 1968). McArthur (1991) considers grey clay soils to be Typic Chromudert (Soil Survey Staff, 1994) or chromic Vertisols (FAO-UNESCO, 1988). The parent material of most grey clay soils is alluvium, possibly deposited under lacustrine conditions upon lateritic saprolite (McArthur, 1991). In the classification adopted for the recent soil survey of the area this soil would belong to the Tieline 2 Subsystem of the Soil–Landscape map of the Katanning–Nyabing area (Percy et al., 1999). Grey Clays cover an estimated 1.5 million hectares of the central and southern wheatbelt of Western Australia (Fisher et al., 1997) and are notoriously difficult to manage because the subsoil is so dense (1.8 to 1.9 g cm-3 typically reading) (Moore, 1998). Grey Clays are a subset of the common Duplex soils which occupy approximately 60 % of the Western Australian wheatbelt (Tennant et al., 1992).
The dominant physical characteristic of the clay subsoil is large prismatic peds. The upper surfaces of these prisms lie immediately below the tilled sandy clay loam horizon at approximately 0.07 m depth. Prism height (the distance from the top surface of the prism to the point in the subsoil where the form of the prism becomes indistinct) varies from 0.7 to 1 m; the length of the sides of the polygons corresponding to horizontal section of the prisms is typically 0.4 to 0.8 m. The vertical faces of the prisms have a sandy clay loam to sandy clay coating rich in organic carbon. In situ observations show that two layers of coating can be distinguished: (i) an outer coating typically 8 to 12 mm thick in the 0.1–0.2 m subsoil and 1 to
4 mm thick in the 0.6–0.7 m subsoil. The outer coating is readily seen from its homogeneous dark colour and its large sand content (relative to surrounding subsoil) and (ii) a transitional material between the external coating and the bulk soil prism. This varies from approximately 30 mm thickness in the upper subsoil to 10 mm in the lower subsoil. This material is more heterogeneous than the outer coating and probably results from mixing of subsoil with material derived from the topsoil. The prisms break down to angular blocky peds. In the centres of the prisms these are moderately developed and are typically 40 to 80 mm across. In the outer zones of the prisms peds are 100 to 150 mm across and well developed with curved faces. These peds are closely packed and have a distinct clay coating about 100 µm in thickness. There are numerous tubular pores 200 to 400 µm in diameter between the peds. There are fewer tubular pores within the angular blocky peds, and the frequency of tubular pores decreases with depth.
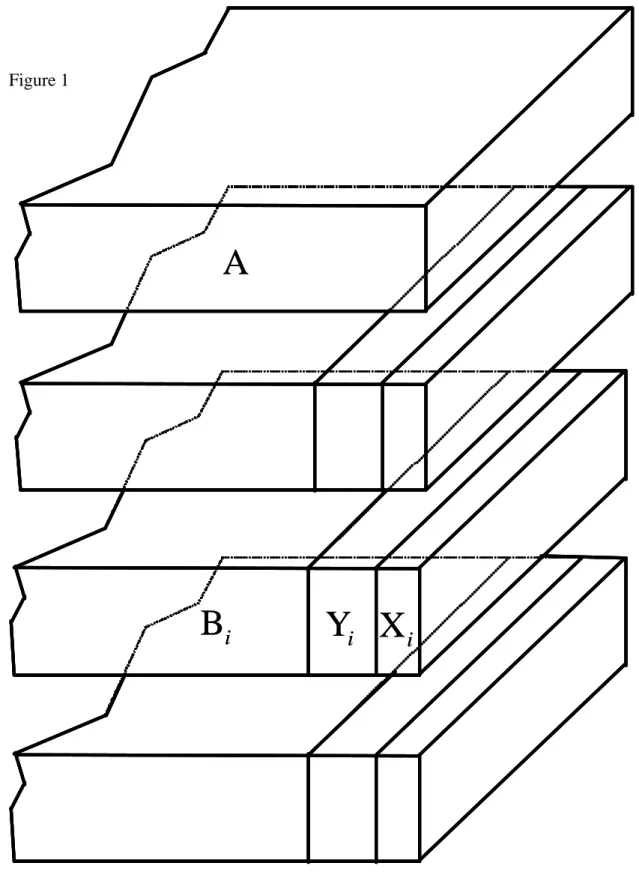
We collected undisturbed samples 200 to 500 cm3 from the subsoil in October 1998 when the subsoil was almost fully swollen and the cracks were still closed. At each sampling depth (namely, 14 to 38 cm, 45 to 65 cm, 67 to 72 cm and 78 to 98 cm depth) samples were taken from the coatings, the transition zones, and the interiors of the prisms (Figure 1). Undisturbed samples were also collected in the tilled horizon (0–7 cm) and between 100 and 110 cm depth where there was no prismatic structure. The samples were stored at 4–5 °C in plastic containers to restrict biological activity and minimize water loss. Observations were also made in March 1999 when the soil had shrunk to its maximum and the cracks network was open to the soil surface.
Methods
A portion of each stored sample was air dried, gently ground and sieved to < 2 mm prior to determination of soil properties. Particle size distribution was measured using the method described by Day (1965) except that dispersion was carried out in a shaker using alkaline sodium hexametaphosphate solution. The N2-BET surface area was measured on soil < 2 mm
after drying at 180°C using the Micromeritics ASAP 2000 apparatus. The results were expressed on an oven–dry gravimetric basis. We measured the cation exchange capacity and exchangeable cations using the cobalt-hexamine trichloride method (Ciesielski et al., 1997). The pH and electrical conductivity were measured at 25°C in a 1:5 soil:water suspension. Organic carbon was determined by combustion in a LECO induction furnace after samples
had been washed with 0.2 M HCl to remove carbonates. The <2 µm fraction was extracted
from the 45–60 cm horizon by sedimentation from suspension after shaking. A drop of <2 µm suspension was deposited on a carbon film supported on a Cu grid and examined using a Philips EM430 electron microscope operated at 300 kV. The proportion of kaolinite and 2:1 clays was determined using the mass loss between 180°C and 1100°C (Wiegman et al., 1982; Bruand & Prost, 1988). Because of the very small content of iron hydroxides in Grey Clays, we attributed mass loss to the H2O produced by dehydroxylation of clays. Calculated values
were based on 15.8 and 4.8 g of H2O per kg of calcined material for kaolinite and 2:1 clays
respectively. The bulk density and water content of soil in field-sampled condition were measured by the kerosene immersion method on clod samples 10 to 20 cm3 in volume (Monnier et al., 1973). These samples were obtained by breaking the large undisturbed 200- to 500-cm3 samples by hand. Twelve samples 10 to 20 cm3 in volume were used at each sampling depth, and results were calculated after oven-drying at 105°C for 24 hours. Large undisturbed samples 200 to 500 cm3 in volume were slowly wetted on a suction table set at a matric potential of –2 kPa. Four weeks were required to reach equilibrium. The samples were broken by hand to produce samples 10 to 20 cm3 in volume. Their bulk densities and water contents were measured as for the samples at field conditions.
Results and Discussion
Soil composition
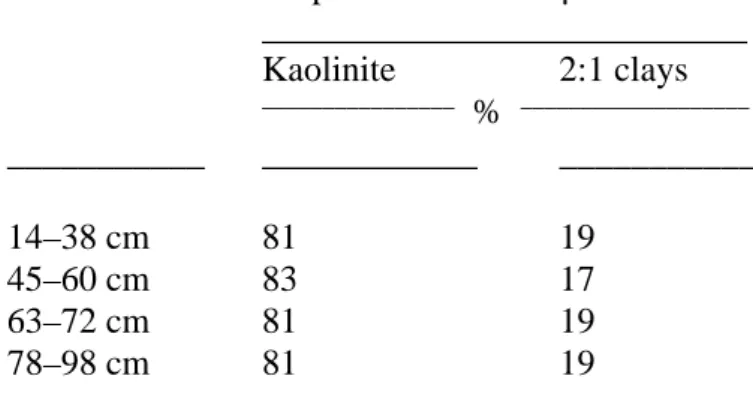
For soil from the interior of the prisms, both clay and silt contents increased from top to bottom of the prism structure; clay from 44.1 to 61.8 % and silt from 5.6 to 10.9 % (Table 1). Fan Liu et al. (1999) found the mineralogical composition of the clay fraction from this profile to be mainly kaolinite with some 2:1 clay minerals (illite and smectite) present. Our calculation of the mineral composition showed approximately 80 % kaolinite and 20 % 2:1 clay minerals. This proportion varied little with depth in the profile (Table 2). We computed the N2-BET-specific surface of the material <2 µm (in m2 per g of <2-µm fraction) by
reporting the value measured to the <2-µm fraction content. The N2-BET-specific surface of
the <2-µm fraction was greater than would be expected for clays of this mineralogical composition, ranging from 88.9 m2 g-1 in the 14–38-cm layer to 76.1 m2 g-1 in the 78–98-cm horizon. Singh & Gilkes (1992) measured properties of 35 soil kaolinites from south-western Australia and found that their N2-BET-specific surfaces ranged from 18 to 62 m2 g-1
(median = 35 m2 g-1), much greater than for standard kaolinite (median = 10 m2 g-1). The decrease in N2-BET-specific surface of the <2-µm fraction with depth, given a roughly
constant ratio of kaolinite to 2:1 clays indicates increasing size of elementary clay crystals with depth. Most of the soil kaolinite crystals studied by Singh & Gilkes (1992) were smaller than 0.1 µm. Even if the large N2-BET-specific surfaces recorded from the Katanning profile
can be partly explained by the presence of 2:1 clay minerals, the kaolinite crystals must be very small. This is confirmed by TEM measurements which show subrounded to rounded platy crystals 0.05 to 0.10 µm across (Figure 2). Assuming that the entire soil cation exchange capacity derives from the <2-µm fraction, we computed the cation exchange capacity of this fraction (in cmol+ per kg of <2-µm fraction) by reporting the value measured to content of the
<2-µm fraction. We find a decrease with depth ranging from 38.3 cmol+ kg-1 at 14–38 cm to
30.3 cmol+ kg-1 in the 78–98 cm horizon. This decrease in the cation exchange capacity with
depth accords with the results of the N2-BET-specific surface for the <2-µm fraction. The
cation exchange capacity values of the <2-µm fraction are greater than those measured by Singh & Gilkes (1992) on organic-matter free clays but similar to those quoted by McArthur (1991) for Grey Clay soils.
Crack network and coating composition
During late summer, when shrinkage was greatest, all cracks which were visible at the soil surface extended into the upper subsoil where they formed the boundaries of large prismatic structures. In horizontal cross section the prisms were approximately hexagonal. Based on a sample of 75 prism sides measured at the soil surface, mean side length (a, see Figure 3) was 0.66 m (standard error = 0.02 m). Crack width between adjacent prisms faces was up to 0.01 m at 0.10 m depth with cracks effectively closed at 0.9 m depth in the profile. At the spring sampling when the cracks between prisms were closed (prisms in close packing) bulk density varied from 1.80–1.90 g cm-3 at 0.15 m depth decreasing to 1.60–1.65 g cm-3 at 0.90 m.
The origin of the coating and transition materials may be inferred from their composition. The clay and silt contents of the coating were similar to or slightly greater than that of the surface soil (0–0.05 m). The transition material had a particle-size composition intermediate between that of the coating and the bulk of the soil in the prism at each depth. The organic carbon content of the coating was similar in the 0.14–0.38 m sample to that of the surface soil but decreased with depth in the profile. Thus it seems likely that the coating is derived
primarily from surface soil and that the transitional material results from incorporation of coating material into the soil of the vertical prism faces, perhaps effected by the concentration of biological activity in this zone. It is likely that most soil enters the cracks dry, causing little particle segregation, and that most of the soil entering cracks will lodge in the upper subsoil (cracks here remain open for longer). Topsoil material that had accumulated in the upper subsoil will restrict swelling during winter resulting in a progressive increase in bulk density for as long as the seasonal sequence of crack opening, infilling and swelling continues.
Relationship between crack thickness and bulk density increase.
To analyse the effect of the thickness of the coating on the bulk density of soil within the prisms it is first necessary to clarify the effect of crack width on bulk density from a consideration of basic geometry. The bulk density Diof a regular hexagonal prism at a water
content θi is given by the following relationship (Figure 3)
D m
a h
i = °
3cos30 ( 2 ), (1)
where m is the mass of solid phase within the prism, and a is the length of the side of the prism. After partial drying and isotropic shrinkage, the bulk density of the hexagonal prism at a water content θj with θj < is (Figure 1a) θi
(
) (
)
D m a a h h j = ° − − 3cos30 Δ 2 Δ , (2) with Δh h Δ a a =⎛⎝⎜ ⎞⎠⎟ ,since shrinkage is isotropic. Thus Equation (2) becomes
(
)
D m a a h h a a j = ° − ⎡ −⎛⎝⎜ ⎞⎠⎟ ⎣ ⎢ ⎤⎦⎥ 3cos30 Δ 2 Δ , (3) and(
)
( )
D D m a a h h a a m a h j i = ° − ⎛⎝⎜ − ⎞⎠⎟ ° 3 30 3 30 2 2 cos cos Δ Δ , (4) which givesD D a a a j i = − ⎛ ⎝⎜ Δ ⎞⎠⎟ 3 . (5)
If shrinkage is anisotropic and expressed in the horizontal plane only (Figure 3) then Δh = 0 .
Thus Equation (2) becomes
(
)
D m h a a j = ° − 3 cos30 Δ 2 , (6) and D D a a a j i = − ⎛ ⎝⎜ Δ ⎞⎠⎟ 2 . (7)For isotropic and anisotropic swelling respectively, Figures 4 and 5 show that an increase in the bulk of the prism from (1.60–1.65) to (1.80–1.90) is possible with a small increase in the width of the cracks between prism faces.
Relationship between crack width and coating thickness
If we assume that the topsoil material deposited in cracks has the same composition as the current topsoil (i.e. no particle segregation has taken place during translocation) then we can calculate the equivalent width of crack that would be completely filled with topsoil material based on the proportion of topsoil in each of the coating layers, the thickness of the coatings and their bulk density. If we consider a layer, see Figure 6, with two coatings X and Y at one of its ends comprising different mixtures of materials A (surface soil) and B a given horizon in the subsoil then
A B X tC uC C = + , (8) A B Y vC wC C = + , (9) with t+ = 1, u (10) v+ = 1, w (11)
where CA, CB, CXand CY are the clay contents of the materials A, B, X and Y respectively, t and u are the ratios of material B and A respectively in material X, and v and w are the ratios of material B and A respectively in material Y. Then by combining Equations (8) and (9) then Equations (10) and (11) we obtain the following relationships:
A X C C C C t − − = , (12)
A B X B C C C C u − − = , (13) A B A Y C C C C v − − = , (14) A B Y B C C C C w − − = . (15)
The thickness of material X is TX and it results from the mixture of a thickness ' B
T of material
B with a certain amount of material A. Thus
X * B * X ' B T D D t T = , (16)
with DB* and DX* the field bulk density of the material B and coating X at maximum swelling, respectively. Following the same reasoning, we can write
Y * B * Y '' B T D D v T = , (17)
with TY the thickness of material Y, " B
T the thickness of material B which has been mixed
with material A to give the coating Y and DY, the bulk density of the coating Y. Thus the
width of the crack (Wcrack) which has been filled by pure material A is given by the following
relationship
(
) (
")
B Y ' B X crack 2T T 2T T W = − + − , (18)and by using Equations (12), (14), (16) and (17) we obtain
⎥ ⎥ ⎦ ⎤ ⎢ ⎢ ⎣ ⎡ ⎟⎟ ⎠ ⎞ ⎜⎜ ⎝ ⎛ − − − + ⎥ ⎥ ⎦ ⎤ ⎢ ⎢ ⎣ ⎡ ⎟⎟ ⎠ ⎞ ⎜⎜ ⎝ ⎛ − − − = A B A Y * B * Y Y A B A X * B * X X crack 2 1 2 1 C C C C D D T C C C C D D T W . (19)
Validation of the model and possible evolution of the bulk density
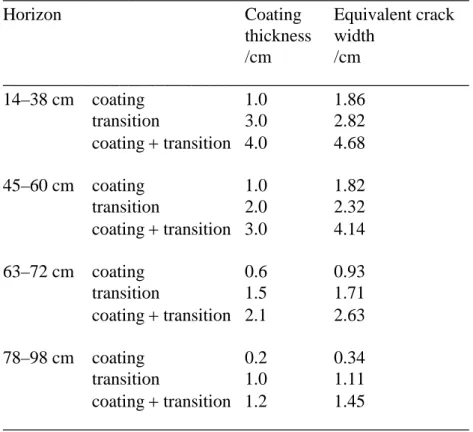
Using Equation (19) and the values of D , B* D , X* D , Y* TX, TY, C , A C , B C and X C (Table 1), Y we calculated Wcrack for the different subsoil horizons (Table 3). Then, since
crack
W a=
Δ , (20)
we calculated the bulk density Dj for the different subsoil horizons on the basis of the calculated Wcrackand using either Equation (5) or Equation (7) corresponding to isotropic and
anisotropic shrinkage respectively. For Di , that is the bulk density of the prism prior the
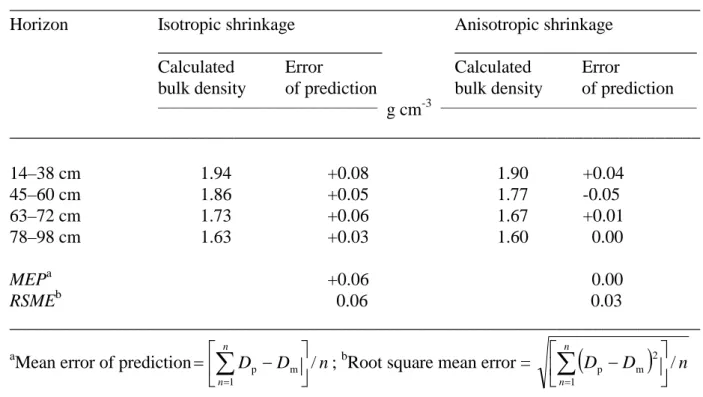
matric potential (Table 1). Indeed, our rewetting experiments in the laboratory showed that under unconfined conditions the subsoil swells more than under confined field conditions. So, we decided that the bulk density at –20 cm water potential could approximate the initial bulk density of the subsoil. We used the value a = 0.66 m, as measured in the field. A comparison between calculated and measured bulk densities is given in Table 4. The good correspondence between the measured and calculated bulk densities assuming either an isotropic shrinkage or an anisotropic shrinkage shows that the model developed can account for the values of bulk density that were recorded in the field. The better correspondence between the measured and calculated bulk densities on the assumption of anisotropic shrinkage indicates that shrinkage is closer to anisotropic than to isotropic in every horizon.
Conclusion
The development of the very dense upper subsoil of the profile examined can be explained on the basis of the geometry of the peds and the shrinking and swelling properties of the clay component. External compactive forces are not necessarily implicated.
The compaction involves shrinkage of peds during the dry summer, followed by infilling of vertical cracks between peds by detached topsoil and subsequent ped swelling during the wet winter. Compression of soil within peds occurs on wetting where an accumulation of translocated topsoil between ped faces restricts swelling. The translocated topsoil occurs as a two layer coating on ped faces. Where coating thickness is greatest, in the upper subsoil, the peds are the most dense. The distinctive shrinking and swelling properties of the subsoil peds can be attributed to the dominance in their clay fraction of kaolinite with very small crystals.
If we assume a regular hexagonal arrangement of subsoil peds and an initial bulk density equivalent to that in soil below the depth where coatings occur then our model indicates that the effect of increasing coating thickness on compression of subsoil peds adequately accounts for the great bulk densities we observed in the upper subsoil. Model predictions of bulk density increase with increasing coating thickness is best where swelling is confined predominantly in the horizontal plane. Large bulk densities such as those we have measured at this site are common on similar soils throughout the region. The soil affected suffer transient waterlogging, plant roots grow poorly in them, productivity is low, and if the process of compaction continues, agricultural use of these soils may become unsustainable.
Our work indicates that stabilization of topsoil to reduce the rate of topsoil detachment and crack infilling should be an important consideration in managing such soils.
Acknowledgements
We thank the Institut National de la Recherche Agronomique and the University of Western Australia for their financial support of A. Bruand’s work in Australia. We also thank Ms Melissa Narbey, Dr Brenda Rohl and Dr Robert Hart of the Department of Soil Science and Plant Nutrition, The University of Western Australia, for their advice and analysis, Matt Braimbridge, Agriculture Western Australia, Katanning, for his help in the field, and Ted Griffin, Phil Goulding and Noel Schoknecht, Agriculture Western Australia, Perth, for providing information about the soil distribution in Katanning area.
References
Bruand, A. & Prost, R. 1988. Analyse minéralogique quantitative d'un échantillon de sol : utilisation des données concernant la composition chimique de l'échantillon. Agronomie, 8, 15-22.
Cabidoche, Y.M. & Voltz, M. 1995. Non-uniform volume and water content changes in swelling clay soil: II. A field study on a Vertisol. European Journal of Soil Science, 46, 345–355.
Ciesielski, H. & Sterckeman, T. 1997. Determination of cation exchange capacity and exchangeable cations in soils by means of cobalt hexamine trichloride. Effects of experimental conditions. Agronomie, 17, 1–7.
Cochrane, H.R., Scholz, G. & vanVreeswyk, A.M.E. 1994. Sodic soils in Western Australia. Australian Journal of Soil Research, 32, 359–388.
Cochrane, H.R. & Aylmore, L.A.G. 1991. Assessing management-induced changes in the structural stability of hardsetting soils. Soil and Tillage Research, 20, 123–132.
Day, P.R. 1965. Particle fractionation and particle-size distribution. In: Methods of Soil Analysis. Part 1 (eds C.A. Black et al.), pp. 545–567, The American Society of Agronomy, Madison, WI.
Fan Liu, Gilkes, R.J., Bruand, A. & Hart, R.D. 2000. A study of potassium forms in cutans in Katanning Grey Clay Soil using XRD and analytical electron microscopy. In: Proceedings
of the Joint Conference of the Western Australian Society for Electron Microscopy and Australian X-Ray Analytical Association, Freemantle, 1999 (ed. B.J. Griffin), pp. 51-56, The Western
Australian Society for Electron Microscopy and The Western Australian branch of The Australian X-Ray Analytical Association, Perth.
FAO-UNESCO 1988. Soil Map of the World. Volume 1. Revised Legend. Unesco, Paris.
Fisher, P., Bignell, J.M., Brainbridge, M.F. & Hamilton, G.J. 1997. Soil Structural Constraints to Plant Growth on Hardsetting Shallow Duplex Soils. Department of Agriculture, Katanning.
Fredlund, D.G. & Rahardjo, H. 1993. Soil Mechanics for Unsaturated Soils. John Wiley and Sons, New york.
Gregory, P.J., Tennant, D. & Belford, R.K. 1992. Root and shoot growth, and water and light use efficiency of barley and wheat crops grown on a shallow Duplex soil in a mediterranean-type environment. Australian Journal of Agricultural Research, 43, 555– 573.
Manrique, L.A. & Jones, C.A. 1991. Bulk density of soils in relation to soil physical and chemical properties. Soil Science Society of America Journal, 55, 476–481.
McArthur, W.M. 1991. Reference Soils of South-Western Australia. The Australian Society of Soil Science (WA Branch), Perth.
Monnier, G., Stengel, P. & Fiès, J. C. 1973. Une méthode de mesure de la densité apparente de petits agglomérats terreux. Application a l'analyse des systèmes de porosité du sol. Annales Agronomiques, 24, 533–545.
Moore, G. 1998. Soil Guide. A Handbook for Understanding and Managing Agricultural Soils. Bulletin No 4343, Agriculture Western Australia, South Perth.
Isbell, R.F. 1996. The Australian Soil Classification. CSIRO Publishing, Collingwood, Australia.
Percy, H.M., Richardson, J. & Roberts, M. 1999. Soil-Landscape Map of the Katanning-Nyabing area (1/125 000). Agriculture Western Australia, Perth.
Rawls, W.J. 1983. Estimating soil bulk density from particle size analysis and organic matter content. Soil Science, 135, 123–125.
Schoknecht, N. 1997. Soil Groups of Western Australia. Resource Management Technical Report No 171, Agriculture Western Australia, Perth.
Singh, B. & Gilkes, R.J. 1992. Properties of soil kaolinites from south-western Australia. Journal of Soil Science, 43, 645–667.
Soil Survey Staff, 1994. Keys to Soil Taxonomy. 6th edition, US Government Printing Office, Washington DC.
Stace, H.C.T., Hubble, G.D., Brewer, R., Northcote, K.H., Sleeman, J.R., Mulcahy M.J. & Hallsworth, E.G. 1968. A Handbook of Australian Soils. Rellim Technical Publications, Adelaide.
Stoneman, T.C. 1991. An Introduction to the Soils of the Katanning Advisory District. Bulletin No 4202, Western Australian Department of Agriculture, Perth.
Tennant, D., Scholz, G., Dixon, J. & Purdie, B. 1992. Physical and chemical characteristics of duplex soils and their distribution in the south-west of Western Australia. Australian Journal of Experimental Agriculture 32, 827–843
Voltz, M. & Cabidoche Y.M. 1995. Non-uniform volume and water content changes in swelling clay soil: I. Theoretical analysis. European Journal of Soil Science, 46, 333–343. Wiegmann, J., Horte, C.H. & Kranz, G. 1982. Determination of the complete mineral
composition of clays. In: Proceedings of the VII International Clay Conference, Bologna & Pavia, 1981 (eds H. van Olphen & F. Veniale), pp. 365–372, Developments in Sedimentology 35, Elsevier, Amsterdam.
List of figures
Figure 1 Sampling design showing the location of samples in the tilled topsoil A, the coating Xi, the transitional zone Yi and bulk soil Bi at every depth i in the subsoil.
Figure 2 Transmission electron micrograph (TEM) of the <2 µm fraction from the 45-60 cm bulk soil (scale bar: 0.2µm).
Figure 3 Isotropic and anisotropic (horizontal) shrinkage of a regular hexagonal prism.
Figure 4 Theoretical variation of the bulk density for isotropic shrinkage according to the crack width between regular hexagonal prisms with hexagon side length of 25, 50, 75 and 100 cm.
Figure 5 Theoretical variation of the bulk density for anisotropic (horizontal) shrinkage according to the crack width between regular hexagonal prisms with hexagon side length of 25, 50, 75 and 100 cm.
Figure 6 Model used to calculate the equivalent crack width corresponding to its fully filling by a mixture of topsoil material A and subsoil B which form the coating X and transitional zone Y. The thickness of the coating and intermediate zone are TX and TY respectively.
Figure 1
i
Y
A
i
X
i
B
Y
i
A
i
X
i
B
Figure 3
h
a
a
h -
Δh
a -
Δa
a - Δ
a
a -
Δa
a - Δ
a
h
h
h
a
a
h -
Δh
a -
Δa
a - Δ
a
a -
Δa
a - Δ
a
a -
Δa
a - Δ
a
h
h
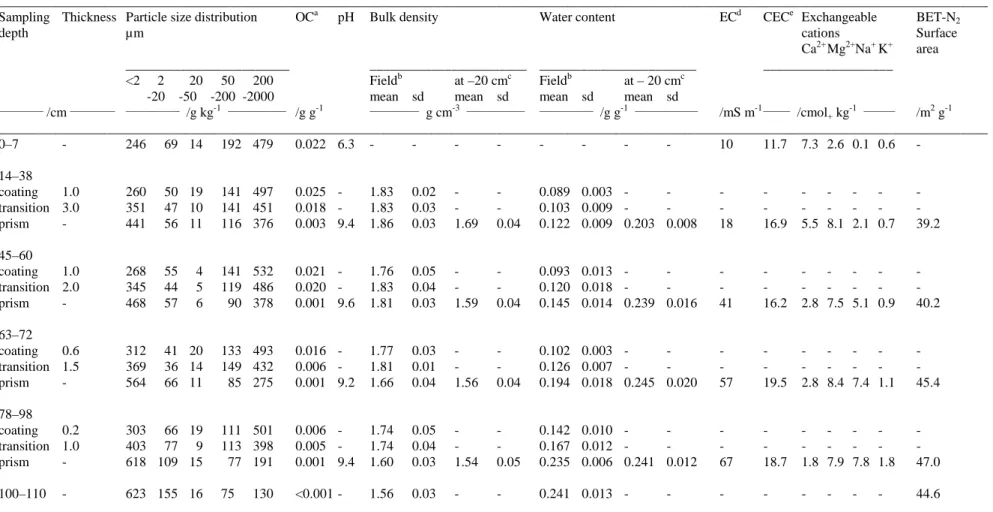
Table 1 Physical and chemical elementary characteristics, bulk density and water content at field sampling date and after rewetting at –20 cm water potential
under unconfined conditions in the laboratory and BET-N2 surface area of the soil studied.
_________________________________________________________________________________________________________________________________________________ Sampling Thickness Particle size distribution OCa pH Bulk density Water content ECd CECe Exchangeable BET-N2
depth µm cations Surface Ca2+ Mg2+Na+ K+ area ________________________ _______________________ _______________________ ___________________ <2 2 20 50 200 Fieldb at –20 cmc Fieldb at – 20 cmc
-20 -50 -200 -2000 mean sd mean sd mean sd mean sd
__________ /cm __________ ____________ /g kg-1 _____________ /g g-1 ___________ g cm-3 _____________ ____________ /g g-1 ______________ /mS m-1______ /cmol+ kg -1 _______ /m2 g-1 _________________________________________________________________________________________________________________________________________________ 0–7 - 246 69 14 192 479 0.022 6.3 - - - 10 11.7 7.3 2.6 0.1 0.6 - 14–38 coating 1.0 260 50 19 141 497 0.025 - 1.83 0.02 - - 0.089 0.003 - - - - - - - - - transition 3.0 351 47 10 141 451 0.018 - 1.83 0.03 - - 0.103 0.009 - - - - - - - - - prism - 441 56 11 116 376 0.003 9.4 1.86 0.03 1.69 0.04 0.122 0.009 0.203 0.008 18 16.9 5.5 8.1 2.1 0.7 39.2 45–60 coating 1.0 268 55 4 141 532 0.021 - 1.76 0.05 - - 0.093 0.013 - - - - - - - - - transition 2.0 345 44 5 119 486 0.020 - 1.83 0.04 - - 0.120 0.018 - - - - - - - - - prism - 468 57 6 90 378 0.001 9.6 1.81 0.03 1.59 0.04 0.145 0.014 0.239 0.016 41 16.2 2.8 7.5 5.1 0.9 40.2 63–72 coating 0.6 312 41 20 133 493 0.016 - 1.77 0.03 - - 0.102 0.003 - - - - - - - - - transition 1.5 369 36 14 149 432 0.006 - 1.81 0.01 - - 0.126 0.007 - - - - - - - - - prism - 564 66 11 85 275 0.001 9.2 1.66 0.04 1.56 0.04 0.194 0.018 0.245 0.020 57 19.5 2.8 8.4 7.4 1.1 45.4 78–98 coating 0.2 303 66 19 111 501 0.006 - 1.74 0.05 - - 0.142 0.010 - - - - - - - - - transition 1.0 403 77 9 113 398 0.005 - 1.74 0.04 - - 0.167 0.012 - - - - - - - - - prism - 618 109 15 77 191 0.001 9.4 1.60 0.03 1.54 0.05 0.235 0.006 0.241 0.012 67 18.7 1.8 7.9 7.8 1.8 47.0 100–110 - 623 155 16 75 130 <0.001 - 1.56 0.03 - - 0.241 0.013 - - - - - - - - 44.6 _________________________________________________________________________________________________________________________________________________ a
Tableau 2 Proportions of kaolinite and 2:1 clays in the <2 µm fraction. _________________________________________________
Horizon Proportion in the <2 µm fraction ___________________________ Kaolinite 2:1 clays ________________ % ___________________ ___________ ____________ ___________ 14–38 cm 81 19 45–60 cm 83 17 63–72 cm 81 19 78–98 cm 81 19 __________________________________________
Table 3 Thickness of the coating and transition material
and calculated equivalent crack width (Wcrack).
____________________________________________________ Horizon Coating Equivalent crack thickness width /cm /cm ____________________________________________________ 14–38 cm coating 1.0 1.86 transition 3.0 2.82 coating + transition 4.0 4.68 45–60 cm coating 1.0 1.82 transition 2.0 2.32 coating + transition 3.0 4.14 63–72 cm coating 0.6 0.93 transition 1.5 1.71 coating + transition 2.1 2.63 78–98 cm coating 0.2 0.34 transition 1.0 1.11 coating + transition 1.2 1.45 ____________________________________________________
Tableau 4 Bulk density calculated with the model involving either an isotropic shrinkage
or an anisotropic shrinkage and error of prediction associated.
_____________________________________________________________________________ Horizon Isotropic shrinkage Anisotropic shrinkage
_________________________ ___________________________
Calculated Error Calculated Error
bulk density of prediction bulk density of prediction
____________________________________ g cm-3 __________________________________________ _____________________________________________________________________________ 14–38 cm 1.94 +0.08 1.90 +0.04 45–60 cm 1.86 +0.05 1.77 -0.05 63–72 cm 1.73 +0.06 1.67 +0.01 78–98 cm 1.63 +0.03 1.60 0.00 MEPa +0.06 0.00 RSMEb 0.06 0.03 _____________________________________________________________________________ a
Mean error of prediction D D n n n / 1 m p ⎥ ⎦ ⎤ ⎢ ⎣ ⎡ − =
∑
=; bRoot square mean error =