HAL Id: hal-00089826
https://hal-insu.archives-ouvertes.fr/hal-00089826
Submitted on 28 Aug 2006
HAL is a multi-disciplinary open access
archive for the deposit and dissemination of sci-entific research documents, whether they are pub-lished or not. The documents may come from teaching and research institutions in France or abroad, or from public or private research centers.
L’archive ouverte pluridisciplinaire HAL, est destinée au dépôt et à la diffusion de documents scientifiques de niveau recherche, publiés ou non, émanant des établissements d’enseignement et de recherche français ou étrangers, des laboratoires publics ou privés.
Organic facies variation in the late Kimmeridgian of the
Boulonnais area (northernmost France)
Nicolas Tribovillard, Anne Bialkowski, R. Tyson, Elisabeth Lallier-Vergès,
J.F. Deconinck
To cite this version:
Nicolas Tribovillard, Anne Bialkowski, R. Tyson, Elisabeth Lallier-Vergès, J.F. Deconinck. Organic facies variation in the late Kimmeridgian of the Boulonnais area (northernmost France). Marine and Petroleum Geology, Elsevier, 2001, 18, pp.371-389. �10.1016/S0264-8172(01)00006-X�. �hal-00089826�
Organic facies variation in the late Kimmeridgian of the
Boulonnais area (northernmost France)
N. Tribovillarda, A. Bialkowskia, R. V. Tyson, b, E. Lallier-Vergèsc and J. -F. Deconincka
a Laboratoire de Sédimentologie et Géodynamique, Université Lille 1 and FRE CNRS 2255, bâtiment SN5, F-59655 Villeneuve d'Ascq cedex, France
b Fossil Fuels and Environmental Geochemistry (Postgraduate Institute), Drummond Building, University of Newcastle, Newcastle upon Tyne NE1 7RU, UK
c UMR 6531 du CNRS “Sédimentation et Diagenèse de la Matiere Organique”, Université d'Orleans bâtiment Géosciences — BP 6759, F-45067 Orléans cedex 2, France – remplacé par UMR6113 – ISTO
Abstract
Recent studies of the upper Kimmeridgian of the Boulonnais area (northernmost France) have provided a sequence-stratigraphical framework that is here used to help interpret variations in sedimentary organic matter (OM) content and composition in response to fluctuations in relative sea-level. The organic facies are characterised using a combination of palynofacies, bulk organic geochemistry (TOC, Rock Eval pyrolysis, and sulphur data), and the particle-size distribution of the total palynological residues. The organic facies show a good correlation with the sequence stratigraphy, exhibiting peak TOC, HI, total S and Sorg values in the lithofacies deposited around the two MFS. The palynofacies in these intervals is characterised by a high content of fluorescent, orange, marine AOM. There is a strong correlation between the orange AOM and the total and organic sulphur contents. Similar positive correlations between orange AOM and organic sulphur have previously been observed in the distal organic-rich sediments of the Kimmeridge Clay Formation of Dorset (lateral time equivalents of the Boulonnais facies), but there the sulphur contents are lower, indicating that organic sulphur content of orange AOM is not fixed, suggestive of preservation-related parallel but not intrinsically related trends. The S data can be used to estimate an apparent burial efficiency and hence the proportion of the primary productivity preserved; this allows a rough estimate of palaeoproductivity. Model calculations suggest that for a sulphide retention of 30–70% and uncompacted sedimentation rate estimates in the range 5–10 cm/ka, the mean palaeoproductivity was in the range 52–175 gC/m2/a (up to 6% of which was preserved). Thus, if the preservation is high, as is the case for MFS, the palaeoproductivity does not need to be above average for shelf waters to produce a given TOC.
1. Introduction
The Kimmeridgian sandstones and mudstones of the Grès de Chatillon and the Argiles de Chatillon formations are well exposed in the coastal cliffs around Wimereux (Boulonnais area, northernmost France). These more nearshore and shallower shelf sediments are lateral time equivalents of the distal organic-rich sediments of the Kimmeridge Clay Formation of Dorset (UK). Extensive recent studies of the Wimereux sections have provided a sequence stratigraphical framework that is here used to help interpret variations in sedimentary organic matter (OM) content and composition in response to fluctuations in relative sea-level previously described by Herbin and Proust. The thermally immature organic facies are characterised using a combination of palynofacies, bulk organic geochemistry (TOC, Rock Eval pyrolysis, and sulphur data), and the particle size distribution of the total palynological residues.
2. Geological framework
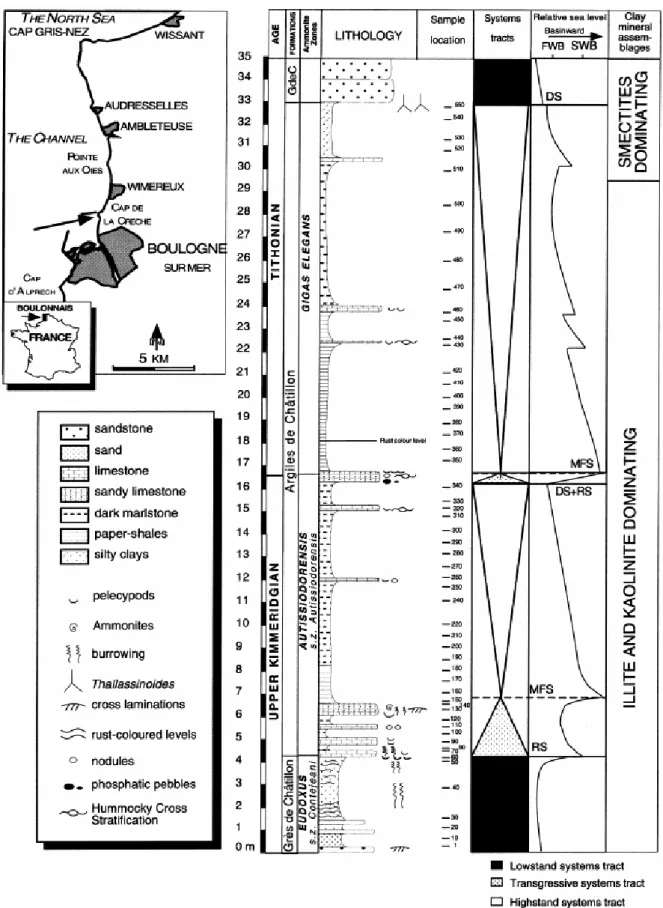
The studied succession is exposed at the Pointe de la Crèche, between Wimereux and Boulogne (Fig. 1). Most of the 33 m section falls within the Argiles de Chatillon Formation (Autissiodorensis and Elegans ammonite zones), bracketed between the upper part of the Grès de Chatillon Formation below (Eudoxus zone), and the base of the Grès de la Crèche Formation above (Scitulus zone: Herbin and Wignall). The sedimentary log, stratigraphy, sequence stratigraphy, and sample locations, are shown in Fig. 1.
The mudstones and shales of the Argiles de Chatillon represent a low-energy shelf facies deposited below wave base, but revealing some tidal and storm influence in some of the thin shelly limestone interbeds (Fürsich & Oschmann, 1986). Like the more distal time-equivalent shales and mudstones exposed at Kimmeridge on the Dorset (UK) coast ( Cox and Gallois, 1981 and Waterhouse), these sediments are also organic-rich in part ( Deconinck; Dunn, 1972; Geyssant; Herbin; Herbin; Proust; Proust and Proust), but their OM has a more mixed origin ( El; Herbin and Herbin). The higher pyrite contents and the depauperate in situ macro and microbenthos and reduced bioturbation have long been used to suggest reducing and “stagnant”, but not persistently anoxic conditions ( Ager; Ager and Barnard).
Fig. 1. Lithostratigraphy and ammonite biozonation (Herbin et al., 1995) of the Kimmeridgian–Tithonian of the Cap de la Crèche Section and their correspondence with relative sea-level (Proust and Proust). Note the change in clay mineral distribution near the top of the Argiles de Châtillon Formation (Deconinck et al., 1996).
Several orders of cyclicity are recorded within the Argiles de Châtillon; the most prominent are:
• the Milankovitch-type (climatic) primary cycles (ca. 25 ky);
• the superimposed longer-term cycles observed here (ca. 500 ky; Herbin and Waterhouse). Recent sequence stratigraphical studies of the Wimereux section (Herbin; Proust; Proust and Proust) allow us to relate observed variations in organic facies to changes in relative sea-level. Herbin et al. (1995) pointed out that relative sea-level rise was not the single cause for OM accumulation. Instead, these authors suggest that three parameters must act in conjunction: 1. physiography (concerning the shape of the basin and the volume of sediments available); 2. transgression (influencing the size of the area producing the organic material and the water depth);
3. climate (governing the quality of the OM and the variation of primary productivity).
3. Material and methods
As detailed descriptions of the lithofacies and stratigraphy have been given previously in Deconinck; Deconinck; Herbin; Proust and Proust, only a summary need be offered here. The Grès de Chatillon consists of brown- to orange-coloured sandstones and sandy marlstones with common cross-bedding and wave ripples, and intense bioturbation (especially U-shaped and Rhizocorallium burrows). The formation ends with a series of four sandy limestone beds rich in Exogyra shells. The overlying Argiles de Chatillon consists of claystone and marlstone accumulations with two intervals of laminated paper shales (Fig. 2) and a laterally variable number of local intercalated limestone beds, some of which may be diagenetic in origin. The marlstones show a gradual enrichment in silt in the upper part of the formation. Storm beds are numerous, notably around the Kimmeridgian–Tithonian (Autissiodorensis–Elegans zone) boundary.
Fig. 2. Stratigraphic distribution of the relative percentages of the various types of organic matter. AOM: amorphous organic matter; mfs: maximum flooding surface.
Altogether 56 samples were collected, generally with a sampling interval of around 2 per metre, but around half this in the upper half of the Elegans zone where the lithology is more monotonous, less organic-rich and there are no sequence-stratigraphic boundaries.
For all samples, the carbonate content was measured using a Bernard calcimeter. The Rock Eval pyrolysis parameters were determined with a Rock Eval VI apparatus: total organic carbon content (TOC, in wt.%), Tmax (°C), and Hydrogen Index (HI, in mg hydrocarbon per g TOC; see all details about Rock Eval pyrolysis and parameters in Espitali and Espitali). Half of the samples were analysed with a LECO C-S 125 device in order to determine the total sulphur content (TS, in wt.%). Major element analyses (not reported here) were carried out by ICP-AES at the spectrochemical laboratory of the Centre de Recherches en Pétrographie et Géochimie of Vandœuvre-les-Nancy (geochemistry facility of the French Centre National de la Recherche Scientifique). The samples were prepared by fusion with LiBO2 and HNO3 dissolution. The analytical accuracy and precision were both found to be better than 1% (mean 0.5%). This was checked by making use of international reference material and by analysing replicate samples, respectively. The non-silicate bound fraction of iron was deduced using the formula: Fenon-sil=(Fetotal−0.22×Al) (Hild & Brumsack, 1998), allowing an estimation of the fraction of iron present as pyrite. The organic sulphur content was then determined by difference: Sorg=TS−Spyr (TS stands for total sulphur).
Standard palynological processing techniques have been used, as described in Lallier and Lallier. Two types of preparations were produced for each sample: total untreated kerogen slides using the residues of just HCl and HF digestion and treated kerogen slides prepared after further treatment with KOH, HNO3 and ZnBr2 in order to remove humic substances, sulphides and any other undissolved mineral matter. In neither case was ultrasonic treatment or sieving employed. The mounting medium of the slides was Elvacite 2044. For each sample, 500 organic particles were counted in transmitted white light according to a computer-assisted protocol (Noël, in preparation) that permits a consideration not only of the number of particles, but also their size (area in plan view), and thus provides a potentially better quantification of the relative abundance of amorphous organic matter (AOM, sensu Tyson, 1995). To estimate the level of preservation of the organic matter the qualitative six-point fluorescence scale of Tyson (1995) was used, based on a global evaluation under blue light fluorescence and use of a 20× objective (see also Tuweni & Tyson, 1994). Scale point 1 corresponds to totally non-fluorescent organic matter, 2 indicates only fluorescent palynomorphs, and 3–6 increasingly stronger and homogenous fluorescence of the AOM; 6 is rare except in some very rich oil shale facies.
Four types of structureless particles are recognised (Tyson; Tyson and Tyson) based on their general shape, internal fabric (texture), colour, and the nature of the particle edges ( Plate 1 A–D); the first two are marine and the latter two probably terrestrially derived:
Plate 1. Transmitted light microphotographs of the four types of structureless and amorphous organic matter. A — reddish SOM; B — brown AOM; C — black SOM; D — orange AOM.
Orange AOM, typical of immature marine source rock facies, and exhibiting distinct and in some cases almost angular edges, and a gel-like texture. Common pyrite framboid inclusions are observed in untreated kerogen slides (Plate 1D). Although colour differences can be subjective, cross-correlation of orange AOM counts made in Orléans and Newcastle (using the same slides) gave r2 value of >0.9 (n=9, range 3–76%), even though the Newcastle count was based only on particle numbers:
Relativenumericalfrequency (%) oforangeAOMparticles=([0.84×%orangeAOMarea]+3.68) Brown AOM has a more heterogeneous “floc” texture, less distinct “fuzzy” outlines, and tends to be less lustrous; in untreated kerogen slides, it exhibits a more granular texture and the presence of pyrite crystallites (Plate 1B). It is associated with lower fluorescence.
Reddish structureless OM (SOM) has a more homogeneous gel-like texture, sharp edges and brittle fracture. It is not associated with pyrite (Plate 1A).
Black SOM has a “flaky” texture, but is totally opaque regardless of particle thickness. It contains minute woody inclusions (Plate 1C).
The particle size of the total OM, including AOM, was determined using a laser-dispersive Malvern “Mastersizer” apparatus, for both the total and treated kerogen preparations. Because the particulate fraction of OM, the phytoclasts and palynomorphs show a much clearer relationship to sequence stratigraphy than AOM (e.g. Tyson and Tyson), an attempt was made to separate and concentrate these entities for the particle size analyses. Unfortunately, both H2O2 and Na–hypochlorite treatments failed to remove the AOM, despite use of different concentrations and reaction times.
Statistical analyses were performed using SPSS for Windows (v.9.0) and MVSP (v.3.0). Clusters analyses employed unweighted pair group averages as the measure of similarity and Euclidean distances.
4. Results
4.1. Palynofacies data
The palynofacies data can be used to clearly differentiate the Grès de Chatillon from the Argiles de Chatillon: the former shows a dominance of phytoclasts and palynomorphs, whereas the latter is dominated by orange and brown marine AOM plus phytoplankton debris (Fig. 2). This difference probably reflects a combination of hydrodynamic equivalence (phytoclasts are equivalent to silt and sand), and very different oxygen regimes that resulted in very poor and good preservation of AOM, respectively. Because brown and orange marine AOM are the two dominant components of the OM assemblage in the Argiles de Chatillon, their percentages show an inherent inverse correlation.
The black SOM shows an erratic occurrence and is generally very rare; where it constitutes more than 2% of the total structureless particles, it is positively correlated with brown AOM (r2 0.45, n=7), but probably due to a mutual dilution effect by orange AOM. Cluster analysis of the palynofacies parameters shows that the black SOM and the reddish SOM are both associated with the definite terrestrial OM components (the brown translucent and opaque phytoclasts, spores and pollen). This agrees with previous findings, which have shown that reddish SOM is common in lacustrine formations where it is interpreted as being soil-derived terrestrial material (Bourdon, Laggoun-Défarge, & Chenu, 1997), probably diagenetic humic gels. The greater rarity of this material in the more distal Kimmeridge Clay Formation, also supports a terrestrial derivation.
No correlation is observed between the percentage of total phytoclasts and the black/brown phytoclast ratio (regardless of whether or not the reddish and black SOM are included). This is somewhat unusual and could be an artefact of the counting procedure weighting for particle area, rather than relative numerical frequency (sensu Tyson, 1995). Proximal-distal sorting effects typically lead to a relative concentration in black phytoclast particles distally (e.g. Tyson and Tyson), but such sorting is probably best expressed in relative numerical frequency data. The opaque phytoclasts are generally dominant over the brown phytoclasts in these samples, which is also typical for the Kimmeridge Clay in Dorset ( Tyson, 1989) and indicates that although the Boulonnais facies are shallower, they are not associated with a major phytoclast input, which is typically associated with a dominance of brown translucent phytoclasts. There is no correlation between the ratio of plankton/sporomorphs and the ratio of AOM/phytoclasts, that is between the marine/terrestrial ratios in the palynomorph and total kerogen fractions.
Stratigraphically constrained cluster analysis of the data can be used to define more objectively the intervals with statistically different palynofacies; this procedure recognises five major clusters corresponding, from the base upwards (Fig. 3), to the first lowstand systems tract (LST) and transgressive systems tract (TST), the first maximum flooding surface (MFS), the interval between the first and second MFS, and the lower and upper parts (boundary at ca 26.5 m) of the last highstand systems tract (HST). All but the second and last of these five clusters can be subdivided; two of these lower order clusters correspond to the lower organic-rich part of the Elegans Zone and to the Grès de Chatillon (LST).
Fig. 3. Stratigraphic variation in hydrogen indices, also showing the stratigraphically constrained clusters defined using the optical data.
4.2. Rock eval data
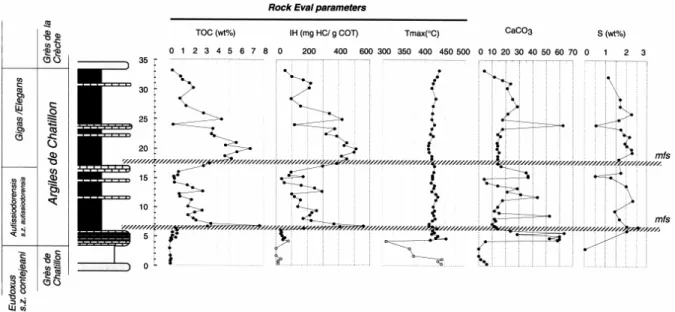
Reliable Tmax values range between 411 and 453°C with a mean value of 423°C, confirming that the sediments are immature with respect to hydrocarbon generation (Fig. 5). The TOC values range from 0–1% for the Grès de Chatillon and 0.1–7.6% for the Argiles de Chatillon (Fig. 4 and Fig. 5). The mean TOC is correlated with lithofacies, increasing from <0.1% for sandstones, to 0.4% for the limestones, 1.0% for silty claystones, 1.5% for dark marlstones, and 4.3% for paper shales. The highest values are observed at the base of the Autissiodorensis zone and in the lower part of the Elegans zone, in both cases associated with laminated paper shales. Stratigraphic TOC minima occur at the top of the Autissiodorensis zone and the top of the Elegans zone. The data thus clearly define two cycles of upward-decreasing TOC, with maxima around the two MFS, and a progressive decrease through the highstands; these cycles are analogous to the high TOC base (HTB) units of Creaney and Passey (1993), although changes in preservation, as well as terrestrial OM and sediment supply are clearly involved (cf. Tyson, 1996).
Fig. 4. Stratigraphic variation in Rock Eval parameters and whole rock carbonate and sulphur contents. The grey symbol at the bottom of the Tmax and HI curves are used for samples with very low TOC (inaccurate Tmax and HI
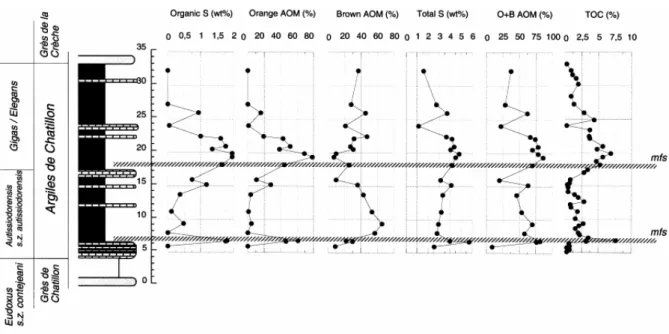
Fig. 5. Stratigraphic variation in the abundance of total and organic sulphur compared to the percentages of orange AOM, brown AOM, orange+brown AOM and also TOC.
The HI values are very strongly correlated with the TOC values (coefficient of determination
r2=0.97), and range from <80 in the Grès de Chatillon to as high as 556 for the richest sample
from the Argiles de Chatillon (Fig. 6). The HI versus TOC relationship shows a slight tendency to begin levelling off after a TOC of 3.5% and HI of 350; extrapolation of this trend indicates that at optimum preservation and minimum phytoclast content the sediments would have an HI value of ca 600, which is typical of Type II marine kerogen. The HI values also show a good correlation with lithofacies; the mean HI determined from the slope of the S2 versus TOC relationship (Fig. 7; Langford & Blanc-Valleron, 1990) increases progressively from 135 for the limestones, to 251 for silty claystones, 400 for the dark marlstones, and 663 for the paper shales (r2 values for the argillaceous lithofacies (≥0.92). This series of facies-specific linear relationships results in the overall curvilinear S2 versus TOC relationship, a trend which indicates that the TOC results from preservation and terrestrial/marine OM mixing, not just dilution.
Fig. 6. TOC versus HI crossplot for the various lithologies present in the studied section.
Fig. 7. TOC versus S2 crossplot for the various lithologies present in the studied section. The linear correlation is illustrated for each lithology.
Because TOC is a function of dilution as well as OM input or preservation, it is best to correlate the palynofacies data with HI, even though HI and TOC are strongly related. At HI values below 300 (all but the lower MFS and the organic-rich base of the Elegans zone), there is an excellent correlation between HI and the sum of brown and orange AOM (r2=0.81), i.e. the total marine AOM fraction (Fig. 8). In this range and especially at an HI below 250, the brown AOM typically dominates the marine AOM and the HI largely reflects a mixing between brown AOM and phytoclasts. Marine AOM does not become dominant until an HI value of 200 and a TOC of 2%. At HI values greater than 250 (>60–80% total marine AOM), the orange AOM increases rapidly, with most of the variation in HI then apparently resulting from the proportion of marine AOM that is orange, exclusively so at HI>400 (i.e. in the paper shale lithofacies; Fig. 9). A multiple regression model using the percentage of total marine
(brown plus orange) AOM, and the percentage orange of the total marine AOM yields an excellent adjusted r2 of 0.89 for all the data (standard error±54) (Fig. 10):
PredictedHI=−16.45+(3.88×%totalmarineAOM)+(2.1×%orangeoftotalmarineAOM).
This very strong correlation and the equally strong relationship between HI and TOC suggests that the TOC of the dark marlstones and paper shales is largely determined by whatever controls either the input and/or preservation of the AOM and particularly the orange AOM. The terrestrial carbon input contributes very little to the overall TOC variation; the phytOC value (sensu Tyson, 1995: TOC/100×(AOM/[AOM+Phytoclasts])) remains consistently low and almost constant in the argillaceous lithofacies (mean 0.32), again arguing against any major terrestrial input.
Fig. 8. HI versus total marine AOM (orange+brown) crossplot.
Fig. 9. Crossplot showing the relation between HI and the relative abundance of orange AOM compared to total marine AOM (orange+brown).
Fig. 10. Linear regression of measured and predicted HI values derived by multiple regression.
Preservation of the kerogen can also be assessed using the qualitative 6-point fluorescence scale of Tyson (1995). The scale values are well correlated with HI (r2=ca 0.6); samples with HI values >250 correspond to scale values 4 or 5 (moderate to strong heterogeneous AOM fluorescence); the samples with scale point 5 also coincide with the prominent peak in orange AOM, TOC and HI in the lower Elegans zone (ca 20 m). When only the percentage of total marine AOM and fluorescence scale were used as predictors in the multiple regression with HI, a very good r2 (0.83) and standard error (±66) were still obtained, only a little lower than those obtained using orange AOM data, and despite accurate fluorescence scale determination being more difficult than usual because the slides were unsieved:
PredictedHI=−124+(46.5×fluorescencescale)+(4.0×% totalmarineAOM)
An advantage of the fluorescence scale is that it can be estimated in less than a minute per slide as no actual counting is involved. The increased fluorescence, hydrogen indices and TOC and TS values, and their association with paper shale lithofacies are usually linked with more reducing environments with recurrent or prevalent anoxia either at the sediment surface or even in the water column (Tuweni; Tyson and Vincent). Such conditions are frequently observed in the vicinity of the MFS, as maximum water depths are optimal for the development of watermass stratification and thus anoxia ( Proust et al., 1993), and the lower sedimentation rates of the upper TST and lower HST favour minimal dilution and thus higher TOC values ( Tyson, 1996).
4.3. Sulphur content
As is typical for organic-rich marine sediments, TS values show a good positive correlation with TOC (excluding the one anomalously S-rich sample, the r2 for the dark marlstones and paper shales is 0.75, n=16). Compared to the more distal Kimmeridge Clay the TS values are around three times higher for the same TOC; the TOC/TS ratios of the Argiles de Chatillon are primarily in the range 0.2–1.4, whereas only coccolith limestones appear to exhibit values lower than 2.4 in the Kimmeridge Clay of Dorset (data of Richard Doyle, pers. comm.,
n=168). Pyrite sulphur is rather uniform in the mainly dark marlstone and paper shale Argiles
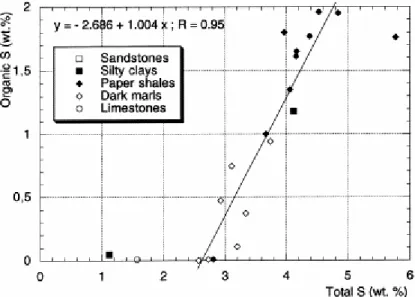
de Chatillon samples analysed (2.5–3.0%), and the stratigraphic variation in TS is thus dominated by changes in Sorg. Once TOC values exceed 2.5% (i.e. in the paper shales) the Sorg contents are strongly correlated with TS (r2=0.9, excluding the two lowest and highest TS samples), increasing from 0 to 2% of the whole rock and 0–45% of the TS (Fig. 11):
Sorg=[1.004×% TS]−2.69
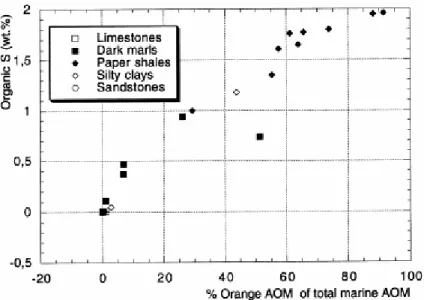
The high ratios of Sorg to TOC indicate that the paper shale samples have Type II-S kerogen sensu Orr (1986), i.e. atomic S/C ratios >0.04. The Sorg values show a very strong correlation with the percentage orange AOM of total marine AOM (r2=0.93, n=18; Fig. 12):
Sorg=[0.022×% orangeAOMoftotalmarineAOM]+0.151
For 16 samples, once the orange AOM reaches about 5% of the total marine AOM the Sorg/TOC ratio stabilises at around 0.3 (Fig. 13), slightly higher than the 0.2 Sorg/TOC saturation ratio indicated by Bein, Almogi-Labin, and Sass (1990). The increase in Sorg beyond this point is thus purely due to the abundance of orange AOM, not increasing S-incorporation within the orange AOM.
Fig. 11. Crossplot of total sulphur versus organic sulphur. The linear relationship is calculated for total S values between 2 and 5 wt.%.
Fig. 12. Crossplot showing the relationship between the percentage of the total marine AOM that is orange and the organic sulphur.
Fig. 13. Crossplot showing the relationship between the percentage of the total marine AOM that is orange and the organic sulphur to TOC ratio.
The Sorg values also show a good negative correlation with Tmax values (r2=0.61), Tmax decreasing by about 14°C (from 427 to 413°C as the percentage Sorg of TS increases from 0 to 45% (Fig. 14).
Tmax(°C)=[−6.29×%Sorg]+426
Despite this correlation and that between orange AOM and Sorg, there is only a poor direct correlation between orange AOM and Tmax (more data and therefore more scatter?). The
earlier maturation of Type II-S kerogens is a well-established phenomenon that is of considerable importance in hydrocarbon exploration (e.g. Powell & Snowdon, 1983).
Fig. 14. Crossplot of organic sulphur to total-S ratio versus Tmax.
4.4. OM particle size
The OM residue particle size data are expressed as the mode, mean and the first and third quartile diameters. All these parameters show the same overall stratigraphic trend (Fig. 15), regardless of whether treated or untreated kerogen preparations were used. The background modal particle diameter is around 20 μm, superimposed upon which are two principal maxima, one in the Grès de Chatillon, resulting from large phytoclasts (>100 μm), and the other (≤60 μm) at the base of the Elegans zone associated with an abundance of orange AOM (>20%), strong fluorescence, and HI values >300. As noted previously by Tyson (1989), as the preservation of marine AOM increases, the particles typically change from matte brown to a more lustrous orange colour and become more cohesive and thus larger and less likely to be dispersed during kerogen preparation. Typical marine AOM does not originate as discrete particles, but rather as gelatinous flocs or aggregates ( Tyson, 1995), which merge after deposition and compaction to form continuous or discontinuous organic laminae in the sediment; the AOM size observed in the kerogen slides is partly a function of the thickness and purity of the organic laminae in the rock (determining their susceptibility to HF attack), organic composition (resistance to any oxidative reagents), and the cohesiveness of the OM. The observed size trend in the Argiles de Chatillon is thus an indirect indication of the preservation state of the marine AOM. For the untreated slides the best correlation observed is between modal size and the percentage orange of total marine AOM (r2=0.66):
Modaldiameter (μm)=(0.49×%orangeoftotalmarineAOM)+13.7
For the treated slides, the r2 of this relationship diminishes to only 0.19, suggesting that the particle size distribution has been partly compromised by the additional chemical treatments and heavy liquid separation.
Fig. 15. Stratigraphic variation in organic-matter grain-size parameters compared to that of orange AOM.
5. Discussion
The HI versus TOC trend described here is rather similar to that reported for the 1 m “Cycle 1” from the Eudoxus zone of the Kimmeridge Clay in the “Yorkimm” Marton borehole, Yorkshire, UK (e.g. Ramanampisoa and Tribovillard). An association between higher TOC and HI values and an abundance of orange AOM was also previously described for the latter ( Boussafir and Boussafir). The orange AOM is linearly correlated with TOC (r2=0.83, data from Boussafir & Lallier-Vergès, 1997, Fig. 2) and thus also with TS. It is non-linearly correlated with HI (r2=0.67, HI predicted from polynomial regression with TOC), as the latter begins to level off after the orange AOM reaches around 20% (at a TOC of about 5%). Despite these general similarities, “Cycle 1” differs by having lower TS contents and the Sorg is significantly lower, always less than 1% (mean 0.45, n=25) and shows no correlation with TS (Lallier-Vergès et al., 1997; see also Pearson, Hill, Fallick, & Ecuvillon, 1996). The Sorg/TOC ratio is predominantly less than 0.2% (mean 0.14, n=25) and does not exhibit a trend suggestive of S-saturation. These observations indicate that although parallel trends occur in the abundance of orange AOM and organic sulphur, the sulphur content of orange AOM varies for different sample sets. This suggests that the formation (or preservation) of orange AOM and the incorporation of Sorg into it, may be two different (albeit often correlated) processes.
On the basis of transmission electron microscopy and molecular analyses, Boussafir; Boussafir and Gelin proposed that the difference in the orange and brown marine AOM in the Kimmeridge Clay was a reflection of contrasting early diagenetic regimes ( Table 1). The orange AOM was interpreted as resulting from “natural vulcanisation”, an early diagenetic process producing resistant high molecular weight abiogenic “geopolymers” by sulphurisation of the aliphatic OM via the inter- or intramolecular incorporation of reduced inorganic sulphur species into low-molecular-weight functionalised lipids (de; Sinninghe and Tegelaar) or carbohydrate ( Van Kaam-Peters, Schouten, Köster, & Sinninghe Damsté, 1998). The correlation with fluorescence, HI and lithofacies certainly shows that the difference in AOM is a function of greater preservation under more reducing (and probably more sulphidic) conditions ( Tyson, 1995).
Table 1. Relationship between the ultrastructural features, the characteristic pyrolysis products and the origin of the different types of amorphous organic matter (AOM) occurring in the Kimmeridge Clay Formation kerogens (from Boussafir and Boussafir)
In marine sediments, the sulphide supply available for sulphurisation reactions is essentially a function of the balance between the flux of metabolisable (planktonic) organic matter to the sulphate-reducing bacteria (and hence H2S production), and the flux of reactive iron (as oxy-hydroxides, siliciclastic grain coatings, or organo-metal complexes), which immobilises H2S as monosulphides and pyrite. Sulphurisation of OM may therefore be promoted by either iron-limitation (e.g. Berner; Kendrick and Zaback) due to a reduced siliciclastic sediment (and thus reactive iron) flux, or excess H2S production due to higher fluxes of metabolisable carbon, i.e. higher primary productivity (Tribovillard, Desprairies, Lallier-Vergès, & Bertrand, 1994b). Iron-limitation is typical of organic-rich “black shales” deposited under anoxic water columns ( Raiswell & Berner, 1985), at least partly because they are usually slowly deposited distal facies ( Tyson, 1995). Although the Argiles de Chatillon is clay-rich, and its clay mineral assemblages are rather uniform ( Deconinck; Deconinck and Proust), such relative compositional data cannot be used to infer the magnitude or stability of the absolute fluxes of siliciclastic sediment and reactive iron. At a given locality, sedimentation rates should certainly have been slower during the condensed section (around the MFS), and the development of paper shales in these parts of the Wimereux section is also suggestive of dysoxia–anoxia, both of which imply iron-limitation that would have favoured the greater organic sulphur contents observed at these times. Any increased flux of metabolisable OM due to an increase in primary productivity, will of course have resulted in even greater excess of sulphide for sulphurisation reactions; however, there is no clear and compelling reason why primary productivity should peak at the MFS, particularly in a basin margin setting (see also below).
It has been suggested that the amount of metabolisable organic carbon utilised during sulphate reduction (the dominant anoxic degradation process in marine sediments) can be estimated from the sulphur content of the sediment (Berner; Bertrand; Littke; Vet and Vet):
CarbonutilisedduringSO4 reduction=[% TS×0.75]× Sretention
This figure can be used to reconstruct the original TOC of the surficial sediment (e.g. Bertrand and Littke) if it is assumed oxidative degradation and methanogenesis were negligible. Sulphide retention is usually reported to vary between 5 and 75% (ibid.), and the value assumed (30% in Bertrand & Lallier-Vergès, 1993; 100% in Lallier and Lallier) therefore has a very major effect on the calculation; furthermore, sulphide retention decreases with iron-limitation, resulting in a likely underestimation of the carbon losses (and thus back-calculated TOC of the surficial sediment) in iron-limited facies such as anoxic “black shale” facies.
If back-calculation of metabolisable carbon losses is a valid approach, it can also be used to determine an apparent carbon burial efficiency (Tyson, in preparation), i.e. the percentage of preserved carbon relative to the initial surficial carbon (the latter essentially a function of carbon delivery flux for any given sedimentation rate). At sulphide retention values of 30 and 70%, the calculated mean apparent burial efficiencies are 26 and 43%. In modern sediments deposited in a given depth of water, the carbon burial efficiency is strongly correlated with the carbon preservation expressed as a percentage of productivity (OCPF sensu Bralower & Thierstein, 1987); using the derived OCPF estimate a palaeoproductivity can be obtained using a rearrangement of the following equation:
The sedimentation rate is used in conjunction with the dry sediment density, derived from the OM, carbonate, clay and pyrite weight fractions (assuming densities of each to be 1.2, 2.7, 2.7, and 4.8, respectively) to determine the sediment and organic-carbon mass-accumulation rates. Use of a single estimated mean sedimentation rate for all samples produces a strong correlation between TOC and the palaeoproductivity estimate and the OCPF (r2=0.9), and hence also between the latter (r2=0.8). Note that sedimentation rate affects the TOC and OCPF but this relationship cannot be determined when using just a single long-term mean sedimentation rate value, which is all that is calculable here). The apparent burial efficiency, and thus OCPF, is positively correlated with the assumed sulphide retention. The calculated palaeoproductivity also increases with the assumed sedimentation rate. Although caution is necessary because of these artefacts, an estimate of the mean palaeoproductivity is still possible. A new technique applied to the nearby Cap-Gris-Nez section, based on the concentration of refractory black phytoclasts, suggests that the maximum difference in sedimentation rate between the most condensed and rapidly deposited parts of the Argiles de Chatillon was probably of the order of five-fold (Tyson and McSweeney, unpublished). The TOC was observed to exhibit an inverse correlation with the estimated sedimentation rate; as sedimentation rates were apparently highest when TOC values were lowest, this has a moderating effect on the calculated palaeoproductivity.
If the duration of the Tithonian is taken to be 8.8 Ma and to comprise 17 ammonite zones (UK standard zonation) of assumed equal duration, this gives an average zonal duration of 0.52 Ma. As the Argiles de Chatillon includes two ammonite zones in approximately 29 m, this gives a mean compacted sedimentation rate of around 6 cm/ka; Waterhouse (1999) reports 25-ka Milankovitch cycles in the Autissiodorensis zone at Wimereux that are 60– 70 cm thick, which corresponds to a compacted sedimentation rate of around 3 cm/ka. Together these data suggest a compacted sedimentation rate between 3 and 6 cm/ka. For modelling purposes, palaeoproductivities were calculated for uncompacted sedimentation rates of 5, 10, 20, and 30 cm/ka and sulphide retention values of 5, 30 and 70%. At sedimentation rates of 5–10 cm/ka and sulphide retention values of 30–70% (considered to be the most probable ranges), the computed mean palaeoproductivities are 52–175 gC/m2/a (maximum 246 gC/m2/a). While the accuracy of these calculations is probably not great, they are sufficient to show that the observed TOC values can be explained without recourse to exceptional productivity values (cf. Bertrand; Lallier; Lallier; Lallier; Pradier; Ramanampisoa; Ramanampisoa and Tribovillard), as mean modern shelf values are variously reported to be in the range 100–230 gC/m2/a (Tyson, 1995). The mean calculated OCPF values are 3.9–6.4%, which are reasonable for dysoxic–anoxic shelf facies ( Tyson, 1995).
The modest calculated palaeoproductivities are a direct consequence of the high OCPF values: the higher the preservation, the lower the palaeoproductivity required to balance the observed TOC at any given sedimentation rate, and especially at the MFS.
Assuming that the highest sedimentation rates occur in the low TOC intervals (as predicted by the sequence stratigraphy) and that the sedimentation rate here was 30 cm/ka (five times a mean of 6 cm/ka), and that sulphide retention was 70% (due to maximum supply of iron), the estimated palaeoproductivity is approximately 150–190 gC/m2/a. If the MFS intervals had a sedimentation rate of 5 cm/ka and 30% sulphide retention, the estimated palaeoproductivity is approximately 120 gC/m2/a. As the MFS sedimentation rate was probably even lower, this suggests that the palaeoproductivity may well have been inversely correlated with TOC. The most probable explanation for such a trend would be the higher recycling of nutrients once the shelf was too shallow to be persistently stratified under the prevailing climatic conditions; the regular disruption of stratification is known to play a critical role in regulating shelf productivity at the present day (Tyson, 1995).
6. Conclusions
The organic facies of the Argiles de Chatillon show a good correlation with the sequence stratigraphy, exhibiting peak TOC, HI, TS and Sorg values in the paper shale lithofacies deposited around the two MFS. The palynofacies in these intervals is characterised by a high content of fluorescent, orange, marine AOM, which being better preserved remains intact as larger particles during palynological preparation. At TOC values greater than 2.5%, there is a strong correlation between the orange AOM and the total and organic sulphur contents. The sulphur contents are up to three times higher than those commonly observed at equivalent TOC values in the type Kimmeridge Clay of Dorset, and in the paper shales correspond to a Type II-S kerogen with characteristically depressed Tmax values and a Sorg/C saturation ratio of about 0.3. Similar positive correlations between orange AOM and organic sulphur have been observed previously in the Kimmeridge Clay of Yorkshire, but there the sulphur contents are lower, indicating that organic sulphur content of orange AOM is not fixed, suggestive of preservation-related parallel but not intrinsically related trends. The TS data can be used to estimate an apparent burial efficiency and hence the proportion of the primary productivity preserved, combined with an organic carbon accumulation rate; this allows a rough estimate of palaeoproductivity. Model calculations suggest that for a sulphide retention of 30–70%, and uncompacted sedimentation rate estimates in the range 5–10 cm/ka, the palaeoproductivity did not exceed 175 gC/m2/a (up to 6% of which was preserved). When the OM preservation is good, the palaeoproductivity does not need to be high in order to produce
a given TOC.
Acknowledgements
We thank P. Recourt, D. Malengros (Lille), M. Haton (Orléans), J. Morel (Nancy) for technical assistance, and Dr M. Boussafir (Orléans) for fruitful discussions. Thanks to Richard Doyle (Newcastle) for comparative orange AOM counts and fluorescence scale estimates. We thank D.G. Roberts and two anonymous reviewers who considerably helped to improve the manuscript.
References
Ager, D. and Wallace, P., 1966. The environmental history of the Boulonnais, France.
Proceedings of the Geological Association 77, pp. 385–417.
Ager, D. and Wallace, P., 1970. The distribution and significance of trace fossils in the uppermost Jurassic rocks of the Boulonnais, Northern France. In: Crimes, T.P. and Harper, C., Editors, 1970. Trace fossilsGeology Journal 3, pp. 1–17.
Barnard, T. and Shipp, D.J., 1981. Kimmeridgian foraminifera from the Boulonnais. Revue de
Micropaléontologie 24, pp. 3–26.
Bein, A., Almogi-Labin, A. and Sass, E., 1990. Sulfur and organic carbon relationships in Cretaceous organic-rich carbonates: implications of oxygen-poor depositional environments.
American Journal of Science 290, pp. 882–911.
Berner, R.A., 1985. Sulphate reduction, organic matter decomposition and pyrite formation.
Philosophical Transactions of the Royal Society of London A315, pp. 25–38.
Berner, R.A. and Westrich, J.T., 1985. Bioturbation and the early diagenesis of carbon and sulfur. American Journal of Science 285, pp. 193–206.
Bertrand, P. and Lallier-Vergès, E., 1993. Past sedimentary organic matter accumulation and degradation controlled by productivity. Nature 364, pp. 786–788.
Bourdon, S., Laggoun-Défarge, F. and Chenu, C., 1997. Effets de la diagenèse précoce sur la matière organique sédimentaire d'origine lacustre. Bulletin de la Société Géologique de
France 168, pp. 565–572.
Boussafir, M., Lallier-Vergès, E., Bertrand, Ph. and Badaut-Trauth, D., 1994. Structure ultrafine de la matière organique dans des roches mères du Kimméridgien du Yorkshire (UK).
Bulletin de la Société Géologique de France 165, pp. 353–361.
Boussafir, M., Gelin, F., Lallier-Vergès, E., Derenne, S., Bertrand, Ph. and Largeau, C., 1995. Electron microscopy and pyrolysis of kerogens from the Kimmeridge Clay Formation, UK: source organisms, preservation processes and origin of microcycles. Geochimica et
Cosmochimica Acta 59, pp. 3731–3747.
Boussafir, M., Lallier-Vergès, E., Bertrand, Ph. and Badaut-Trauth, D., 1995. SEM and STEM studies on isolated organic matter and rock microfacies from a short-term organic cycle of the Kimmeridge Clay Formation (Yorkshire, UK). In: Lallier-Vergès, E., Tribovillard, N.-P. and Bertrand, Ph., Editors, 1995. Organic matter accumulationLecture
Notes in Earth Sciences 57, Springer, Berlin, pp. 15–30.
Boussafir, M. and Lallier-Vergès, E., 1997. Accumulation of organic matter in the Kimmeridge Clay Formation: an update fossilisation model for marine petroleum source rocks. Marine and Petroleum Geology 14, pp. 75–83.
Bralower, T.J. and Thierstein, H.R., 1987. Organic carbon and metal accumulation rates in Holocene and mid-Cretaceous sediments: palaeoceanographic significance. In: Brooks, J. and Fleet, A.J., Editors, 1987. Marine petroleum source rocksGeological Society of London
Special Publication 26, pp. 345–369.
Cox, B. M., & Gallois, R. W. (1981). The stratigraphy of the Kimmeridge Clay of the Dorset type area and its correlation with some other Kimmeridgian sequences. Reports of the
Institute of Geological Sciences 80/4.
Creaney, S. and Passey, Q.R., 1993. Recurring patterns of total organic carbon and source rock quality within a sequence stratigraphic framework. AAPG Bulletin 77, pp. 386–401. Deconinck, J.-F., Chamley, H., Debrabant, P. and Colbeaux, J.-P., 1982. Le Boulonnais au Jurassique supérieur: donnèes de la minéralogie des argiles et de la gèochimie. Annales de la
Société Géolique du Nord T. CII, p. 145.
Deconinck, J.-F., Geyssant, J.R., Proust, J.-N. and Vidier, J.P., 1996. Sédimentologie et biostratigraphie des dépôts Kimmèridgiens et Tithoniens du Boulonnais. Annales de la
Société Géolique du Nord 4, pp. 157–170.
Dunn, C. E. (1972). Trace element geochemistry of Kimmeridge Sediments in Dorset, North
West France and Northern Spain. PhD thesis, University of London.
El Albani, A., Deconinck, J.-F., Herbin, J.-P. and Proust, J.-N., 1993. Caractérisation géochimique de la matière organique et minèralogie des argiles du Kimmèridgien du Boulonnais. Annales de la Société Géolique du Nord 2 2, pp. 113–120.
Espitalié, J., 1993. Rock Eval pyrolysis. In: Bordenave, M.L., Editor, , 1993. Applied
Petroleum Geochemistry, Technip, Paris, pp. 231–261.
Espitalié, J., Deroo, G. and Marquis, F., 1986. La pyrolyse Rock Eval et ses applications, Part B. Revue de l’Institut Français du Pétrole 40, pp. 755–784.
Fürsich, F.T. and Oschmann, W., 1986. Storm shell beds of Nanogyra virgula in the Upper Jurassic of France. Neues Jahrbuch Geologische Paläontologische Abhandlungen 172, pp. 141–161.
Gelin, F., Boussafir, M., Derenne, S., Largeau, Cl. and Bertrand, Ph., 1995. Study of qualitative and quantitative variations in kerogen chemical structure along a microcycle: correlation with ultrastructural features. In: Lallier-Vergès, E., Tribovillard, N.-P. and Bertrand, Ph., Editors, 1995. Organic matter accumulation. Lecture Notes in Earth Sciences, Springer, Berlin, pp. 32–47.
Geyssant, J.R., Vidier, J.-P., Herbin, J.-P., Proust, J.N. and Deconinck, J.-F., 1993. Biostratigraphie et paléoenvironnement des couches de passage Kimméridgien/Tithonien du Boulonnais (Pas de Calais): nouvelles donnees paléontologiques (ammonites), organisation sequentielle et contenu en matière organique. Géologie de la France 4, pp. 11–24.
Herbin, J.P. and Geyssant, J.R., 1993. Ceintures organique au Kimméridgien/Tithonien en Angleterre (Yorkshire, Dorset) et en France (Boulonnais). Comptes Rendus de l'Académie des
Sciences de Paris 317 II, pp. 1309–1316.
Herbin, J.P., Müller, C., Geyssant, J., Mélières, F. and Penn, I.E., 1991. Hétérogénéité quantitative et qualitative de la matière organique dans les argiles du Val de Pickering (Yorkshire, UK): cadre sédimentologique et stratigraphique. Revue de l’Institut Français du
Pétrole 46, pp. 675–712.
Herbin, J.P., Fernandez-Martinez, J.L., Geyssant, J.R., El Albani, A., Deconinck, J.-F., Proust, J.-N., Colbeaux, J.-P. and Vidier, J.P., 1995. Sequence stratigraphy of source rocks applied to the study of the Kimmeridgian/Tithonian in the north-west European shelf (Dorset/UK, Yorkshire/UK and Boulonnais/France). Marine and Petroleum Geology 12, pp. 177–194. Hild, E. and Brumsack, H.-J., 1998. Major and minor element geochemistry of Lower Aptian sediments from the NW German Basin (core Hoheneggelsen KB 40). Cretaceous Research
19, pp. 615–633.
Kendrick, J.W., 1979. Geochemical studies of black clays from Leg 43, Deep Sea Drilling Project. In: Tucholke, B.E. and Vogt, P.R., Editors, 1979. Initial Reports of the Deep Sea
Drilling Project Vol. 43, US Government Printing Office, Washington, DC, pp. 633–642.
Lallier-Vergès, E., Bertrand, P. and Desprairies, A., 1993. Organic matter composition and sulfate reduction intensity in Oman Margin sediments. Marine Geology 112, pp. 57–69. Lallier-Vergès, E., Bertrand, P., Huc, A.Y., Bückel, D. and Tremblay, P., 1993. Control of the preservation of organic matter by productivity and sulphate reduction in Kimmeridgian shales from Dorset (UK). Marine and Petroleum Geology 10, pp. 600–605.
Lallier-Vergès, E., Hayes, J., Tribovillard, N.-P., Zaback, D., Connan, J. and Bertrand, P., 1997. Productivity-induced cyclic sulfur enrichment of hydrocarbon-rich sediments from the Kimmeridge Clay Formation. Chemical Geology 134, pp. 277–288.
Langford, F.F. and Blanc-Valleron, M.M., 1990. Interpreting Rock Eval pyrolysis data using graphs of pyrolysable hydrocarbons vs. total organic carbon. AAPG Bulletin 4, pp. 799–804. de Leeuw, J.W. and Sinninghe Damsté, J.S., 1990. Organic sulfur compounds and other biomarkers as indicator of paleosalinity. In: Orr, W.L. and White, C.M., Editors, 1990.
Geochemistry of sulfur in fossil fuelsACS Symposium Series, pp. 429–443.
Littke, R., Baker, D.R., Leythaeuser, D. and Rullkötter, J., 1991. Keys to the depositional history of the Posidonia Shale (Toarcian) in the Hils Syncline, northern Germany. In: Tyson, R.V. and Pearson, T.H., Editors, 1991. Modern and ancient continental shelf
anoxiaGeological Society of London Special Publication 58, pp. 311–333.
Orr, W. L. (1986). Kerogen/asphaltene/sulfur relationships in sulfur-rich Monterey oils. In D. Leythaeuser & J. Rullkötter (Eds.), Advances in organic geochemistry 1985. Oxford: Pergamon. Organic Geochemistry, 10, 499–516.
Pearson, M.J., Hill, M.F., Fallick, A.E. and Ecuvillon, S., 1996. Sulphur incorporation in Jurassic marine mudrocks and their bitumens at low thermal maturity, Cleveland Basin, England. Geochimica et Cosmochimica Acta 60, pp. 4181–4192.
Powell, T.G. and Snowdon, L.R., 1983. A composite hydrocarbon generation model: implications for evaluation of basins for oil and gas. Erdöl und Kohle 36, pp. 163–170. Pradier, B. and Bertrand, P., 1992. Etude à haute résolution d'un cycle du carbone organique des argiles du Kimmeridgien du Yorkshire (G.-B.): relations entre composition pétrographique du contenu organique observé in situ, teneur en carbone organique et qualité pétroligène. Comptes Rendus de l'Académie des Sciences de Paris 315 II, pp. 187–192.
Proust, J.-N., 1994. Notions élémentaires de stratigraphie séquentielle illustrées par un exemple. Annales de la Société Géolique du Nord 3 II, pp. 5–25.
Proust, J.-N., Deconinck, J.-F., Geyssant, J.R., Herbin, J.-P. and Vidier, J.P., 1993. Nouvelles données sédimentologiques dans le Kimméridgien et le Tithonien du Boulonnais (France).
Comptes Rendus de l'Académie des Sciences de Paris 316 II, pp. 363–369.
Proust, J.-N., Deconinck, J.-F., Geyssant, J.R., Herbin, J.-P. and Vidier, J.P., 1995. Sequence analytical approach to the Upper Kimmeridgian–Lower Tithonian storm-dominated ramp deposits of the Boulonnais (Northern France). A landward time-equivalent to offshore marine source rocks. Geologische Rundschau 84, pp. 255–271.
Raiswell, R. and Berner, R.A., 1985. Pyrite formation in euxinic and semi-euxinic sediments.
American Journal of Science 285, pp. 710–724.
Ramanampisoa, L., Bertrand, P., Disnar, J.R., Lallier-Vergès, E., Pradier, B. and Tribovillard, N.-P., 1992. Etude à haute résolution d'un cycle du carbone organique des argiles du Kimmeridgien du Yorkshire (G.-B.): résultats préliminaires de géochimie et de pétrographie organique. Comptes Rendus de l'Académie des Sciences de Paris 314 II, pp. 1493–1498. Ramanampisoa, L. and Disnar, J.R., 1994. Primary control of paleoproduction of organic matter preservation and accumulation in the Kimmeridge rocks of Yorkshire (UK). Organic
Geochemistry 21, pp. 1153–1167.
Sinninghe Damsté, J.S., Rijpstra, W.I.C., De Leeuw, J.W. and Schenck, P.A., 1989. The occurrence and identification of series of organic sulfur compounds in oils and sediment extracts: II. their presence from hypersaline and non-hypersaline paleoenvironments and possible application as source, paleoenvironmental and maturity indicators. Geochimica et
Cosmochimica Acta 53, pp. 1323–1342.
Tegelaar, E.W., de Leeuw, J.W., Derenne, S. and Largeau, C., 1989. A reappraisal of kerogen formation. Geochimica et Cosmochimica Acta 53, pp. 3103–3106.
Tribovillard, N.P., Desprairies, A., Lallier-Vergès, E., Moureau, N., Ramdani, A. and Ramanampisoa, L., 1994. Geochemical study of organic-rich cycles from the Kimmeridge Clay Formation of Yorkshire (G.B.): productivity vs. anoxia. Palaeogeography
Tribovillard, N., Desprairies, A., Lallier-Vergès, E. and Bertrand, Ph., 1994. Sulfur incorporation of lipidic organic matter in reactive-iron deficient environments: a possible enhancement for the storage of hydrogen-rich organic matter. Comptes Rendus de l'Académie
des Sciences de Paris 319, pp. 1199–1206.
Tuweni, A.O. and Tyson, R.V., 1994. Organic facies variations in the Westbury Formation (Rhaetic, Bristol Channel, SW England). Organic Geochemistry 21, pp. 1001–1014.
Tyson, R.V., 1987. The genesis and palynofacies characteristics of marine petroleum source rocks. In: Brooks, J. and Fleet, A.J., Editors, 1987. Marine petroleum source rocksGeological
Society Special Publication 26, pp. 47–67.
Tyson, R.V., 1989. Late Jurassic palynofacies trends, Piper and Kimmeridge Clay Formations, UK. In: Batten, D.J. and Keen, M.C., Editors, 1989. NW European
micropaleontology and palynology. British Micropaleontological Society Series, Ellis
Horwood, Chichester, pp. 135–172.
Tyson, R.V., 1995. Sedimentary organic matter: organic facies and palynofacies, Chapman and Hall, London (now Kluwer Academic, Dordrecht).
Tyson, R.V., 1996. Sequence-stratigraphical interpretation of organic facies variations in marine siliciclastic systems: general principles and application to the onshore Kimmeridge Clay Formation, UK. In: Hesselbo, S.P. and Parkinson, D.N., Editors, 1996. Sequence
stratigraphy in British geologyGeological Society Special Publication 103, pp. 75–96.
Van Kaam-Peters, H.M.S., Schouten, S., Köster, J. and Sinninghe Damsté, J.S., 1998. Controls on the molecular and carbon isotopic composition of organic matter deposited in a Kimmeridgian euxinic shelf sea: evidence for carbohydrate preservation through sulfurisation.
Geochimica et Cosmochimica Acta 62, pp. 3259–3283.
Vetö, I. and Hetenyi, M., 1991. Fate of organic carbon and reduced sulphur in dysoxic–anoxic Oligocene facies of the Central Paratethys (Carpathian Mountains and Hungary). In: Tyson, R.V. and Pearson, T.H., Editors, 1991. Modern and ancient continental shelf
anoxiaGeological Society of London Special Publication 58, pp. 449–460.
Vetö, I., Hetényi, M., Hámor-Vidó, M., Hufnagel, H. and Haas, J., 2000. Anaerobic degradation of organic matter controlled by productivity variation in a restricted Late Triassic basin. Organic Geochemistry 31, pp. 439–452.
Vincent, A.J. and Tyson, R.V., 1999. Organic facies of the Middle Jurassic of the Inner Hebrides, Scotland, UK. Petroleum Geoscience 5, pp. 83–92.
Waterhouse, H.K., 1999. Orbital forcing of palynofacies in the Jurassic of France and the United Kingdom. Geology 27, pp. 511–514.
Wignall, P.B., Sutcliffe, O.E., Clemson, J. and Young, E., 1996. Unusual shoreface sedimentology in the upper Jurassic of the Bounonnais, Northern France. Journal of
Zaback, D.A. and Pratt, L.M., 1992. Isotopic composition and speciation of sulfur in the Miocene Monterey Formation. Re-evaluation of sulfur reactions during early diagenesis in marine environments. Geochimica et Cosmochimica Acta 56, pp. 763–774.