HAL Id: cea-02381443
https://hal-cea.archives-ouvertes.fr/cea-02381443
Submitted on 26 Nov 2019HAL is a multi-disciplinary open access archive for the deposit and dissemination of sci-entific research documents, whether they are pub-lished or not. The documents may come from teaching and research institutions in France or abroad, or from public or private research centers.
L’archive ouverte pluridisciplinaire HAL, est destinée au dépôt et à la diffusion de documents scientifiques de niveau recherche, publiés ou non, émanant des établissements d’enseignement et de recherche français ou étrangers, des laboratoires publics ou privés.
Nuclear data uncertainties propagation methods in
Boltzmann/Bateman coupled problems: Application to
reactivity in MTR
Thomas Frosio, Thomas Bonaccorsi, Patrick Blaise
To cite this version:
Thomas Frosio, Thomas Bonaccorsi, Patrick Blaise. Nuclear data uncertainties propagation methods in Boltzmann/Bateman coupled problems: Application to reactivity in MTR. Annals of Nuclear Energy, Elsevier Masson, 2016, 90, pp.303-317. �10.1016/j.anucene.2015.12.010�. �cea-02381443�
Nuclear Data uncertainties propagation methods in Boltzmann/Bateman
coupled problems: application to power factors in MTR
Thomas FROSIO1,*1, Thomas BONACCORSI1,a, Patrick BLAISE2,b French Atomic Energy and Alternative Energies Commission
CEA,DEN,CAD, Reactor Studies Department, 1: Reactor Physics and Fuel Cycle Division
2: Experimental Physics Division F-131018 Saint Paul-Lez-Durance, France a : +334 42 25 36 63 / [email protected]
b : +334 42 25 73 29 / [email protected]
Abstract: A novel method has been developed to calculate sensitivity coefficients in coupled Boltzmann/Bateman problem for nuclear data (ND) uncertainties propagation on the reactivity and is here extended to power factors. Different uncertainty propagation methodologies, such as One-At-a-Time and hybrid Monte-Carlo / deterministic methods have been tested and are discussed on an actual example of ND uncertainty problem on a MTR-type reactor benchmark. Those methods, unlike total Monte Carlo sampling for uncertainty propagation and quantification (UQ), allow obtaining sensitivity coefficients, as well as correlations values between nuclear data, during the depletion calculation for global neutronics parameters such as reaction rates. The methodologies are compared to a pure MC sampling method, usually considered as the “reference” method. The present paper extends the development to power factor by introducing a new methodology enabling to decorrelate direct and transmutation terms for local factors. The total uncertainty can be decomposed in two effects: a direct effect coming from the perturbation and an effect coming from transmutation. The most impacting ND are the scattering reactions, principally coming from 27Al and
H2O. The overall effect is a reduction of the propagated uncertainties throughout the cycle thanks to
negatively correlated terms.
Key-words: uncertainty propagation, nuclear data, transport, depletion, coupling, Monte Carlo,
sensitivity analysis, power factor, local reaction rate, local concentration uncertainties.
1
1 INTRODUCTION
Sensitivity analysis plays an important role in the field of core physics, and nuclear data Uncertainty propagation and Quantification (UQ) is more and more extensively used in safety calculations of large NPP cores [1,2], as well as innovative design relevant of Gen-IV systems [3,4].
Reactor design and safe operation strongly rely on the quality of numerical simulation codes. Among the various components of nuclear power plant simulations, the precise description of neutron transport and fuel depletion of the reactor core is of particular importance. Although the methods and their implementations in the computer codes have reached a high quality level, final result uncertainties remain, mainly due to uncertainties in the input parameters which cannot be eliminated.
An emerging need also raises for the new generation of very versatile and efficient MTRs, where performances and safety concern both lifetime, cycle length and isotope production [5]. A good understanding of biases and uncertainties on reactor core calculations is essential for assessing safety features and design margins in current and future NPPs, as well as in experimental reactors such as MTRs. In recent years there has been an increasing demand from nuclear industry, safety and regulation for best estimate predictions to be provided with their confidence bounds, leading to the definition of several benchmarks for acquiring, on an international level, a realistic estimation of these uncertainties is necessary for judging the reliability of the simulation results [2]. Among them, the UAM-LWR Phase II [3]
Biases are induced by modelling assumptions (geometry simplification, spatial discretization) and deterministic calculation options (resonance self-shielding formalism, flux solver, etc.). Those biases are usually determined, almost straightforward; by comparison between deterministic calculations and reference Monte Carlo calculations, within the Validation phase of the VV&UQ (Verification, Validation & Uncertainty Quantification) process of deterministic codes and calculation schemes deployment [11].
For almost 30 years, nuclear data uncertainty propagation and nuclear data statistical adjustment in fast reactor applications have been widely used to produce “adjusted” sets of multigroup cross sections and to assess the uncertainty on neutronics design parameters. As a consequence, these methods are naturally implemented in calculation tools dedicated to GEN-IV neutron calculations, such as the ERANOS2 code [12] in France. Recent publications have already presented results of nuclear data propagation for GEN-IV reactors [13]. However, results concerning the nuclear data propagation on GEN-II and GEN-III reactor parameters, and even more for MTR are scarce: if UQ methods are well established for Boltzmann problem, and in particular using MC methods [4,5], as well as separated Bateman problems [9], an accurate and rigorous treatment of nuclear data
uncertainty propagation in coupled problem is still missing, even if an important theoretical work was performed by the end of the 70’s [20,21]. Use of the Monte Carlo method to solve the transport equation introduces stochastic uncertainty in computed fluxes. These fluxes are used to collapse cross sections, estimate power distributions, and deplete the fuel within depletion calculations; therefore, the predicted number densities contain random uncertainties from the Monte Carlo solution. These uncertainties can be compounded in time because of the extrapolative nature of depletion and decay calculations. Additionally, such errors are known to have a spatial component. The flux errors will be smallest in the most reactive regions of the fuel (where greater sampling occurs) and will be larger in the lower flux regions of the fuel. There is a need to determine and understand statistical uncertainties and their propagation in Monte Carlo depletion calculations [14].
An important gap between “step 0” uncertainty calculation and depletion uncertainty calculation must then be filled. The major unknown, uncertainties on isotopes concentrations in the reactor core can be estimated by decorrelating sources of uncertainties. In the present paper, we will focus on nuclear data exclusively, but some of the methods developed and used in this article can be applied to other kind of data like manufacturing process (technological) data. A future publication will describe their particular treatment in the process of propagating uncertainties during the cycle. Up to now, different ways to calculate uncertainties are used worldwide [6,7,16]. Some studies are based on Total nuclear data sampling Monte-Carlo methods [8,10,15,17]. These methods still require important computation time. For this reason, they are often applied on simplified geometries, such as fuel pins or limited assemblies [18]. The increasing HPC capabilities let envisage 2D to 3D full core calculations in reasonable computing time, but probably not within the next decade. However, because of the statistical convergence of Monte-Carlo calculations tools, UQ methods allow only to have information about important isotopes. Moreover, the MC nuclear data sampling methods do not allow accessing the sensitivity coefficients, but only the individual propagated uncertainties. Perturbation Theory has been developed to calculate uncertainty in depletion problems, but without actual coupling [19]. Other methods for time-dependent computations were settled but are not implemented in the calculation codes
In a previous paper [34], time coupling was revisited in a more rigorous way, and implemented in the code chaining, with a particular application on reactivity, and its total uncertainty propagated from nuclear data during cycle. In this document, we will assess the impact of nuclear data uncertainties during depletion on local reaction rates such as power factors.
The first part of the paper will resume the elements of theory and the general background used for nuclear data uncertainty propagation through the depletion calculation, for both direct (ie Boltzmann part) and transmutation (i.e. Bateman depletion) terms. For local quantities, the hybrid method is not efficient and an alternative methodology is used. The second part reproduces the main characteristics of the modelled Material Testing Reactor (MTR) benchmark, as well as the codes and the associated nuclear data used to calculate integral quantities and propagate uncertainties. The third part details the main results obtained the various methods, and in particular the spatial correlation terms that appear through the chained calculation.
2 THEORY OF UNCERTAINTY PROPAGATION IN COUPLED DEPLETION/FLUX CALCULATIONS
2.1 General considerations
Depletion calculations are iterated coupled equations between Boltzmann time-dependent flux calculation and Bateman nuclei evolution calculation using the flux of the previous Boltzmann step, as shown on.
Figure 1: Calculation steps to get total sensitivity
The flux
ϕ
(t
)
at iterationt
is used in the Cii and Cif coefficients of the Bateman equations: they represent respectively the disappearance reaction rate of isotopei
and the transmutation rate of isotopef
ini
. These reaction rates are linked to the nuclear dataσ
and flux value ϕ(t). The Bateman equations allow to calculate the concentrations Ni(t+1) of isotopei
att
+
1
, knowing the isotopic concentrationsNi(t),.The numerical methods for solving the equations are often complex, a functional f of the calculation code will be used throughout the paper, such that:
= = → = ℜ → ℜ ) ( ) ,.. ( ) ,.. ( : 1 1 Y Y Y f X f p n p n
σ
σ
σ
σ
represents the nuclear data space andY
represents the code output, which can be either reaction rates, reactivity or isotopic concentrations.A first order Taylor development is made in the neighbourhood of mathematical nuclear data expectanciesΕ(
σ
)=µ
=(
µ
1,...,µ
n)
, leading to:( )
µ
(
σ
µ
)
(
σ
µ
)
µ
−
+
−
∂
∂
+
=
∑
=o
X
f
f
Y
n i i i i 1)
(
Decomposing into variance and keeping only the parameters of interest (nuclear data), we get:
[ ]
[
]
( )
( )
∂ ∂ ∂ ∂ = − = =var( ) ( ) ( )∑∑
( , ) ) ( 2 2 2 j k k j j k Y Cov X f X f Y Y Y t µ µ σ σ ε Ε Ε (1)In the following, indices
k
and j represent respectively the projection of sensitivities in a vector spaceΠ
which is the direct sum of restricted spaces by isotopes( )
Is s∈{isotopes}, reactions by isotope( )
Rs,r r∈{reactions} and energy groups by reaction and by isotope(
Gs,r,g)
g∈{energetics_groups}. The otherindices
i
andm
represent the different studied isotopes. This decomposition will form the canonical base of sensitivities spaceΠ
.(
)
⊂ ⊂ Π ∈ ∀ = = = Π⊕
⊕
⊕
s r s g r s g r s g r s r s r s s s I R G g r s G R I , , , , , , , , , , , ,The considered hypotheses in the following development are:
A. The variations of the functional
f
are linear in the neighbourhood of nuclear data expectancies B. The nuclear data can be modelled by Gaussian functionsC. The uncertainties coming from self-shielding effect are negligible but can be calculated [38,40] D. The covariances between isotopes are equal to zero for nuclear data.
E. The uncertainties coming from the (radioactive) decay process are negligible in the Bateman equations [32]
f
∂
can be written as a term coming from Boltzmann equation due to the variation of nuclear data directly in disappearance and production operatorsD
andP
, and a term coming from Bateman equations due to the variation of nuclear data in Cii and Cif . These terms will be denoted in the next “direct” and “transmutation” terms. We can further write:( )
( )
∑
[
( )
]
⊂ + = s i i t N h t h t fδ
δ
( o )δ
where
h
represents results coming from the direct effect (variation of cross-section in the flux calculation) and ho
Ni represents the transmutation effect, i.e. the effect of concentration variation in the flux calculation. Theh
function implicitly contains all flux variations as it can be expressed ash
( )
t
=
(
Y
o
ϕ
)(
t
)
where Y is the output data. So, direct and transmutations terms are flux-dependent., and are correlated.The power factor is given by the following expression
∑∑ ∫
∑ ∫
∞ ∞ = A i i f i i i i i fi dE t E A E E t A N dE t E A E E t A N t A ) , , ( ) ( ) ( ) , ( ) , , ( ) ( ) ( ) , ( ) , ( , 0 , 0φ
σ
κ
φ
σ
κ
τ
κ୧ሺEሻ is the average energy produced by fission for the
i
nuclide andA
is a mesh of the geometry.The possibility of building sensitivity with combined method is studied. Those methods will be further used for assessing uncertainties, sensitivities and correlations.
We respectively write
( )
σk k⊂s,r,g,( )
ε
k k⊂s,r,g and( )
g r s j g r s k j k r , , , , , ⊂
⊂ the nuclear data, the standard deviation of nuclear data and the correlation between nuclear data of isotope
s
for reactionr
in energy groupg
. Eqn.1 can be rewritten in a more detailed way as follows:4 4 4 4 4 4 4 4 8 4 4 4 4 4 4 4 4 7 6 o 4 4 4 4 4 4 4 4 4 4 8 4 4 4 4 4 4 4 4 4 4 7 6 o o 4 4 4 4 4 4 8 4 4 4 4 4 4 7 6 iances Co g r s k j srg i s j k j k j i k ion Transmutat g r s k j srg i s j k j k j i s i k i Direct g r s k j srg j k j k j k Y r t N h t h r t N h t N h r t h t h t var , , ,, , , , ,, , , , ,, , 2 ) ( ) ( ) ( 2 ) ( ) ( ) ( ) ( ) ( ) ( ) (
∑ ∑
∑
∑ ∑
∑
∑
∑ ∑
⊂ ⊂ ⊂ ⊂ ⊂ ⊂ ⊂ ⊂ ⊂ ∂ ∂ ∂ ∂ + ∂ ∂ ∂ ∂ + ∂ ∂ ∂ ∂ =ε
ε
σ
σ
ε
ε
σ
σ
ε
ε
σ
σ
ε
(2)The coefficients
ε
kε
jrk,j represent covariance terms between nuclear data. They are (or should be) available in ND covariance files. The covariance matrix will be denoted M in the following.Eqn.2 is the starting relation to develop and test UQ methodologies. In particular, the different methodologies used in the followings are derived to evaluate sensitivity indices represented by
) (t h k
σ
∂ ∂ and∑
⊂ ∂ ∂ s i k i t N h ) ( ) (σ
o terms.2.2 Uncertainty evaluation for local reaction rate in depletion calculation
As mentioned in the introduction, uncertainties propagations are often done with MC sampling. The major drawback of this methodology is in the impossibility to perform sensitivity analysis. To circumvent this problem, three methods are developed and intercompared in the followings: • OAT (One At a Time) method, which will be considered here as the reference method, • A hybrid method based on two different MC calculations,
• A hybrid method based on two different OAT calculations,
• MC (Monte-Carlo) method, based on sampling input parameter will also be implemented, to be compared with the 3 previous methodologies. As ND correlations are not taken into account explicitly in this paper through MC calculation, one will show that the method underestimates the total propagated uncertainty.
2.2.1 Monte Carlo Sampling methodology
In Monte-Carlo sampling methodology, the calculations consist in creating a certain number
l
of code input data (l
corresponds to the number of performed calculation), where all perturbations onnuclear data are made at the same time. The variances from the corresponding datafiles are used and the nuclear data are perturbed, following a Gaussian centered on nuclear data expectancies. Then, samples
σ
l =(σ
l,1,..σ
l,n) - of nuclear data from the JEFF3.1.1.[26] evaluation are built:σ
is taken in a normal law of the nuclear data evaluationσ
~Ν
( )
µ
,ε
evaluation ,Ν
( )
µ
,
ε
being a normal law with meanµ
and standard deviationε
.In this paper, MC sampling is made without taking COMAC nuclear data correlations into account. Eqn.2 then becomes:
∑
∑∑
∑
⊂ ⊂ ⊂ ⊂ ∂ ∂ ∂ ∂ + ∂ ∂ ∂ ∂ + ∂ ∂ ≈ g r s k k s i k i k r s i m s k m k i k t N h t h t N h t N h t h t r , , 2 , 2 2 ) ( ) ( ) ( 2 ) ( ) ( ) ( ) ( ) ( ) , ( ε σ σ σ σ σ ε τ τ τ τ τ τ o o o r r (3)From Eqn.3,
ε
τ2(rr,t) is evaluated while building the following power factor MC estimators at each irradiation step: ) ( ) , ( 1 ) , ( 1 1 ) , ( ) , ( 1 ) , ( ) , ( ˆ ), , ( , int 2 t t r t r t r t r t r t r r t r y Uncerta Bias ref ref la r l l l l l l 4 4 4 4 4 4 3 4 4 4 4 4 4 2 1 r l r l 4 4 4 4 3 4 4 4 4 2 1 r r l r r r τ ε τ τ τ τ τ τ → ± − − ± − = − ∀∑
∑
∑
+∞ (4)where
τ
ref(rr,t) is the power factor of a reference calculation in a space elementr
r
at timet
,)
,
(
ˆ
r
r
t
τ
is the MC-estimator ofτ
( t
r
r
,
)
containing average and standard deviation of the power factors for all thel
calculations, and rr,
τ
ε
is the standard deviation. This estimator is converging without bias.2.2.2 One At a Time methodology
The One At a Time (OAT) method consists in perturbating each input parameter independently and calculating their impact on the output parameters. In this study, perturbation of 10% have been introduced, in order to ensure a linear relation between input and output quantities, as well as local power factor effects high enough vs convergence criteria.
Eqn.2 can be rewritten under a matrix general form:
[
( )] [
()]
) , ( , , 2 t S M t S t rr totalrr T totalrr τ τ τε
= (5)The Stotalrr (t) is a vector containing the total sensitivities (direct plus transmutation) for each input parameter it is defined as:
∂
∂
+
∂
∂
∂
∂
+
∂
∂
=
∑
∑
⊂ ⊂)
,
(
)
,
(
)
(
)
,
(
)
,
(
)
(
)
(
1 1 ,t
r
h
t
r
N
h
t
r
h
t
r
N
h
t
S
n s i n i s i i total rr
r
o
M
r
r
o
rσ
σ
σ
σ
τ τ τ τ τThe determination of its components is made by performing
n
calculations corresponding to orthogonal projections onΠ
. The results of each calculation,τ
pert,k(rr,t), is compared to a reference calculationτ
ref(rr,t) and divided by the perturbation value to get the sensitivity coefficient in pcm by %. on perturbati t r t r t r h t r N h pertk ref k s i k i)( , ) ( , ) ( , ) ( , ) ( , r r r r oτ
τ
σ
σ
τ τ = − ∂ ∂ + ∂ ∂∑
⊂Then uncertainty is obtained by combining this reconstituted vectorStotalrr (t) with the covariance matrix M (Eqn.5).
2.2.3 Hybridation of the methods
Different mixes of the methods can be use to get expressions of uncertainties in the both effects independently.
The direct effect can be determined through the sensitivity coefficients. This can be done while using the Generalized Perturbation Theory, presented in §2.2.3.1 or using a relation between ( tr, )
N h i r ∂ ∂ τ and h ( trr, )
σ
τ ∂ ∂in §2.2.3.2. This can also be done while performing twice more calculations to get one of the two effect and the total effect with MC or OAT method (§2.2.4). Knowing total and direct effect, the transmutation effect can be build.
Hybridation for OAT and MC methods are alternative solutions to get direct and transmutation uncertainties independently. The main differences between the three methods are in assumed hypotheses, as well as, values we can get from. Using GPT, we get direct sensitivity coefficients of local reaction rate to the concentration. Using Eqn.7, we get transmutation sensitivity terms. And finally, the way used in this study to allow getting direct and transmutation sensitivity (in OAT) and direct and transmutation uncertainties (in MC) is a method performing twice more calculations. The others are presented only because they – theoretically - should give identical results.
2.2.3.1
Generalized perturbation theoryUncertainties on power factors coming from direct (Boltzmann) effect can be evaluated using Generalized Perturbation Theory [33]. GPT allows to get the sensibility of a local reaction rate
N V
Σ Σ =
τ
to each microscopic cross-section. The most usual sensitivity value calculated by GPT is the following:
∂
∂
−
∂
∂
Γ
+
Σ
∂
Σ
∂
−
Σ
∂
Σ
∂
=
∂
∂
4
4
4
4
3
4
4
4
4
2
1
4
4
4
4
3
4
4
4
4
2
1
effect spectral k k effect direct N k N V k V k kP
D
t
h
_ † _,
,
,
,
,
)
(
ϕ
σ
λ
σ
ϕ
ϕ
σ
ϕ
ϕ
σ
σ
σ
τ (6)where Γ† is the generalized importance function, solution of source problem
ϕ
ϕ
λ
, , ) ( † † † † N N V V S P D Σ Σ − Σ Σ = = Γ− , ΣVrepresents the macroscopic cross section of interest,
N
Σ a normalization section and .,. represents the dot product on the phase space ) , , ( ) , , ( , 1 2 4 2 0 3 2 1 =
∫
∫
∫
Ω Ω Ω ∞r
r
r
r
r
r
E r E r d dE r d Vϕ
ϕ
ϕ
ϕ
πThis method will not be used because it requires the same number of calculations as fuel elements present in the geometry. However, a very good review of the methodology and its potentialities applied to a depletion problem can be found in [39]. For example, the benchmark used in this study is composed of 49 assemblies with 22 plates each divided in 8 pieces of plate. The number of calculations to be performed is then 49x22x8=8624 if reaction rate sensitivities for each piece of plate has to be evaluated.
In other words, GPT in coupling problems only gives direct (and spectral) uncertainty, but does not give access to the transmutation effect.
2.2.3.2
Relation between sensitivitiesA relative perturbation on isotopic concentration has the same result on macroscopic cross section than the same perturbation on microscopic cross-section. One can then express the reaction rate sensitivity to the average core concentration as follows:
) , ( ) , ( ) , ( ) , ( , , , t r h t r h t r h t r N h capture i fission i scattering i i r r r r
σ
σ
σ
τ τ τ τ ∂ ∂ + ∂ ∂ + ∂ ∂ = ∂ ∂ (7)Then, sensitivity of reaction rate to the concentration can be easily obtained by determining the ) , ( tr N k i r
σ
∂ ∂sensitivity profiles during OAT or MC calculation and build the good uncertainty estimator in the transmutation effect. This estimator is expressed with Eqn.4 or Eqn.5 for MC and OAT respectively, and applied to Ni( trr, ) instead ofhτ( trr, ).
2.2.4 Doubling calculations
Knowledge of direct and transmutation effects can be assessed by performing twice more calculations with OAT and MC methodologies. The first batch of calculations are done based on the scheme given on Figure 2. A second run of calculations is realized following the scheme of Figure 1. For each step, Boltzmann equation is solved taking into account the input perturbations. The resulting reaction rates (power factors) are obtained afterward. Then, Boltzmann and Bateman
equations are solved again with unperturbed input data, to get a depletion calculation with nominal values, giving direct terms as output. From direct (Figure 2) and total (Figure 1) terms, transmutation terms can be built, as explained in the followings.
Figure 2: Calculation steps to get Boltzmann sensitivity without Bateman sensitivity 2.2.4.1 Doubling Calculations for One At a Time
The methodology described in §2.2.2 does not allow to get direct and transmutation sensitivities independently, but only the total effect corresponding to
) , ( ) , ( ) ( ) ( , , r t h t r N h t S k s i k i total r k r r o r
σ
σ
τ τ τ
+∂∂
∂ ∂ =∑
⊂So, to understand the effect of decorrelating these terms, one may combine the previous method with the doubling calculation approach, as to access both h ( tr, )
k r
σ
τ ∂ ∂ and (r,t). N (r,t) N h k i i r rσ
τ ∂ ∂ ∂ ∂ , ie sensitivity profiles of power factors to cross-sections in the direct effect, and sensitivity profiles of power factors to cross-sections in the transmutation effect.Direct effect sensitivity is obtained following the process depicted in Figure 2. The total effect sentivitiy is obtained following the process of Figure 1.
The transmutation effect can be built afterward through Eqn.9.
TheStotal(t)sensitivity vector of reactivity can be further decomposed as:
) ( ) ( ) ( ) ( ) ( ) ( , , , , , t S t S t S t F t S t S concentratr ion ion transmutat r ion transmutat r direct r total rr τ r τ r τ r τ r τ = + = w i t h (9) The determination of N ( tr, ) k i r
σ
∂ ∂can be done by simply extracting the core concentration of each isotope at each burnup step and for each element
r
r
or using Eqn.7.The S , (t)
ion transmutat
rr
τ vector is a vector having fictively the same space-discretization asS , (t)
direct r
r
τ here,
•the time dependent sensitivity vector of the power factor to the nuclear data coming from direct terms :
∂ ∂ ∂ ∂ = ) , ( ) , ( ) ( 1 , t r h t r h t S n direct r r M r r σ σ τ τ τ
•the time dependent sensitivity vector of the power factor to the isotopic concentration :
∂ ∂ ∂ ∂ = ) , ( ) , ( ) ( 1 , t r N h t r N h t S q ion concentrat r r M r r τ τ τ
•and the time dependent n×q sensitivity matrix of each isotopic concentration to each cross section ) , ( tr F r : ∂ ∂ ∂ ∂ ∂ ∂ ∂ ∂ = ) , ( ) , ( ) , ( ) , ( ) , ( 1 1 1 1 t r N t r N t r N t r N t r F n q n q r L r M O M r L r r σ σ σ σ
Using Eqn.9 and Eqn.5, the following equation, solved to calculate uncertainty by OAT doubling calculations method, can be written:
[
] [
]
[
] [
]
[
444] [
44474444448]
6 r 4 4 4 4 4 4 4 4 8 4 4 4 4 4 4 4 4 7 6 r r 4 4 4 8 4 4 4 7 6 r r r r r r r iances Co ion concentrat r T direct r ion Transmutat ion concentrat r T ion concentrat r Direct direct r T direct r t S t r F M t S t S t r F M t S t r F t S M t S t r var , , , , , , 2 ) ( ) , ( ) ( 2 ) ( ) , ( ) ( ) , ( ) ( ) ( ) , ( τ τ τ τ τ τ τε
+ + = (10)Here, three sources of uncertainties can be identified:
•uncertainties coming from direct effect
[
Sτdirect,rr (t)] [
TM Sτdirect,rr (t)]
,•uncertainties coming from transmutation effect
[
F(r,t)S , (t)] [
M F(r,t)S , (t)]
ion concentrat r T ion concentrat rr r r r τ τ ,
•covariances between direct and transmutation effects
[
Sτdirect,rr (t)] [
TM F(rr,t)Sτconcentrat,rr ion(t)]
.2.2.4.2 Doubling calculations for Monte-Carlo Sampling
MC sampling, even with doubling calculations (Figure 2) does not allow to obtain sources of uncertainty independently. The total uncertainty
ε
τ2(rr,t).1can be derivedfrom §2.2.1, as the direct uncertaintyε
τ2(r )r,t direct is extracted from the scheme of from Figure 2 The isotopic concentrations) , (r t
Ni r give the local concentration uncertainties, building the MC estimator just like Eqn.3, by replacing
τ
by Ni.A MF( trr, ) matrix can then be built (but not F( trr, ), as it is explained in Appendix), neglecting correlations between isotopic concentrations uncertainties as we will see in Appendix .
2.2.5 Correlation factors and their physical interpretation
Sensitivity and uncertainty analyses are usually focused on sensitivity parameters. The correlations give some interesting information that is often omitted in the studies found in the literature. The following paragraph will focus on the correlation coefficients that appear in Eqn.2 and Eqn.8, through the use of Bravais–Pearson coefficients. A Bravais-Pearson coefficient describes how two parameters are linearly linked to each other. It ranges between -1 and 1. If there is a linear relation between two quantities, then they are dependent. In general, two usages are made for these correlations coefficients:
• It is possible to predict the value of a parameter knowing the other one. References [35] [36] use Bravais-Pearson correlation factors to describe the representativity of an experiment A versus the reactor concept B, based on a cross product of sensitivity profiles and adequate covariance matrices, within the so-called transposition process (i.e. how an integral information from an experiment can be translated to a design parameter). This is by far the most often use of Bravais Pearson coefficient in the reactor engineering/physics literature. • In the present uncertainty propagation methods, correlations coefficients between direct
and transmutation operators appear in Eqn.2 and 8. They have an important effect on the estimation of total propagated uncertainties and need to be taken into account in the complete analysis. If parameters are strongly correlated in the coupled problem (r
≈
1
), the total propagated uncertainty will rise. On the contrary, if they are strongly anticorrelated (r1
−
≈
), the total uncertainty will be reduced.The determination of the sensitivity vectors allows to easily get correlations coefficients using the well-known formulation:
[
] [
]
[
()] [
()] [
() ()] [
() ()]
) ( ) ( ) ( , t S t F M t S t F t S M t S t S t F M t S r ion concentrat T ion concentrat direct T direct ion concentrat T direct ion transmutat direct = (13)Eqn.13 can be generalized for different kinds of Bravais-Pearson coefficients. It can cover correlations between depletion steps, between core configurations …etc, giving the possibility to establish valuable relations between different kinds of uncertainties. In the present study, we will concentrate on correlations between direct and transmutation effects only. Correlations between different positions in space or evolution steps for example are calculated with:
[
] [
]
[
()] [
()] [
( )] [
( )]
) ( ) ( / a t S M a t S t S M t S a t S M t S r total T total total T total total T total a t t + + + = + (14)3 BENCHMARK CALCULATION RESULTS FOR POWER FACTORS
3.1 Benchmark description
The benchmark used in the present study is a Material Testing Reactor based on U3Si2Alfuel
plates with 19.95% enriched 235U. A 2D view is reproduced on Figure 3. For the sake of simplicity, one kind of assembly has been modelled to build the whole core. No absorbing assembly has been included in the benchmark, as the goal is only to compare the different methods.
Figure 3: Geometric representation of the benchmark
Each fuel assembly is made of 22 Zircalloy 13mm-thick plates (in green). Each plate contains a fuel blade of 50 microns. The blue elements represent the surrounding boronless light water. The 2D geometry is slightly subcritical at the last burnup step.
3.2 Calculations tools
The application is made in 15 energy groups with the APOLLO2.8.3 [22] deterministic lattice code on a quarter of core using a 2 level MoC (method of characteristics) scheme, described in [23]. The UQ analysis will concentrate on 7 main isotopes (235U, 238U, H2O, 27Al, 135Xe, 147Pm, 239Pu) and 4 nuclear reactions (radiative capture, fission, nu, scattering), corresponding to the most important ones for this study.
Perturbation of ND at the beginning of the calculation will give the total sensitivities of power factors to all isotopes and associated nuclear reactions. As it will be shown in the paper, the assembly being a small geometry, it will lead to strong spatial correlations between all the parameters.
3.3 Nuclear data library and covariance data
These data are very important for uncertainty propagation and are currently the subject of a large effort in the international community [24].
To obtain reliable covariances associated with JEFF3.1.1 evaluations [26], a nuclear data re-estimation of the major isotopes was performed thanks to selected targeted integral experiments [27] and marginalization technique [25] using the CONRAD code. This work led to the emission of a new set of covariance matrices linked to JEFF3.1.1: the COMAC file (COvariance MAtrices Cadarache) [28]. In this covariance file, a particular attention was paid to the re-evaluation of important isotopes 235
U [29], 56Fe [30], 238U and 239Pu [31], meanwhile other evaluations are mainly based on ENDF/B-VII covariance file.
4 RESULTS
In order to point out the change in the different sensitivity profiles and associated correlations during depletion, we concentrated our analysis on 3 burnup steps: 2500 MWd/t, 40 000 MWd/t and 100 000 MWd/t – ie max BU discharge). Figure 4 reproduces the power shape for those burn-up. The power is principally localised in the core centre and, during irradiation, it is extended on the periphery.
Figure 4: Power distribution in the core during irradiation normalized at full core average value
4.1 Results obtained with the OAT reference method
The results presented in this part are made using deterministic OAT with the process of doubling calculations. We further explain direct and transmutation sensitivities and construct the total uncertainty from them.
4.1.1 Direct terms
The uncertainty map for the direct effect will be built by extracting the sensitivities of each power factor to cross-sections. We observe on Figure 5 that most of the relative uncertainty is situated on the core edges, where the power factor is low, close to the reflector. Scattering effect is the most important contributor to uncertainty in the direct effect. Moreover, an area around the center of the core has a really weak uncertainty. This behavior has already been observed in [37], where it is shown that values depend on fuel type and dimensions of the core. The propagated uncertainties are here much lower (1.6% max at 1σ and 0.6 % at 1σ in the center). The lower extend obtained for the present benchmark can be explained by a smaller core and UOx fuel, less sensitive to long-range spatial correlations from scattering. Then the weaker contribution of ND to the power factors is justified, and the uncertainty decreases at depletion increases.
Figure 5: Direct uncertainties [% of power factor] from OAT
4.1.2 Transmutation terms
The transmutation terms are coming from depletion and isotopic productions in the core. A good example illustrating this impact is the 235U evolution during time. Globally, 235U is disappearing, but due to the cross-sections uncertainties in Bateman equations and in flux calculation, the quantity of this consumed isotope is not perfectly known. Then the isotopic concentration is not well known, as it will be shown in §4.1.2.1. The uncertainty of 235U concentration produces an uncertainty on the power factors due to both isotopic concentration itself but also because flux calculation is modified by this concentration. This last phenomenon is taken into account with sensibility of power factor to isotopic concentration.
Table 1: Concentrations uncertainties coming from nuclear data vs burnup
Burnup (MW.d/t) 20 40 000 100 000 20 40 000 100 000
Sm149 0,5 3 4 1,5 1,5 2
U235 0 0,3 0,8 0 0,4 0,8
Pu239 1 1,2 1,5 1,4 1,2 1,1
Center of the core Edges of the core
4.1.2.1 Local isotopic concentrations uncertainties
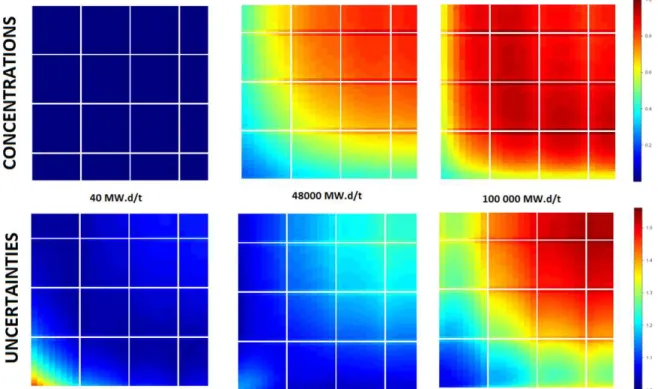
Let’s focus on what happens for three major isotopes in the core. The first one is 149Sm, a poison created during irradiation. The propagated evolution of its uncertainty during burnup is reproduced on Figure 6. As we can see on, at the beginning of irradiation, the value of this isotope is null. During irradiation, it is created everywhere in the core. Finally it disappears on the center of core because of radiative capture. The observed trends on 149Sm uncertainty are slightly different: a first equilibrium (going to 20 GW.d/t) is established, creating a homogeneous uncertainty of 1.2% at 1σ. During irradiation, uncertainty growths, coming from the center, and reaching 4% at 1 σ.
Figure 6: Concentrations and Concentrations uncertainties of 149Sm (bottom-left quarters of core) The second isotope of interest is 239Pu, produced during 235U depletion (Figure 7): at the beginning of irradiation we have no 239Pu in UOx fuel. The quantity of this isotope grows where the level of thermal flux is high, i.e. in the center of the core. This isotope is both produced and consumed so there are areas where it is more produced and area where it is more consumed. It is why we can observe at 100 GW.d/t, an area around the core where the quantity is the most important. This area is not the area of max uncertainty. In fact, during irradiation, at the beginning, the max uncertainty corresponds to the fuel near the reflectors because quantity of 239Pu produced here is weak so relative uncertainty is important. During irradiation, the uncertainty follows the production place, i.e. the center of the core.
Figure 7: Concentrations and Concentrations uncertainties of 239Pu (bottom-left quarters of core) The last isotope is 235U, depleted during burnup (Figure 8). Its consumption follows the flux during irradiation. Because the quantity of 235U becomes weak, the relative uncertainties of concentrations are growing.
Determining all the uncertainty to all the isotopes, the MF( trr, )matrix of Eqn.11 can be built for each
( t
r
r
,
)
. Knowing the sensitivity of power factor to isotopic concentrations, the transmutation uncertainty is then easily obtained by a matrix product.4.1.2.2 Total transmutation uncertainty
The previous MF( trr, ) are now combined toSτconcentrat,rr ion(t) which represents the power factor sensitivity maps to isotope concentrations. Because of the nature of transmutation uncertainty, it increases during depletion as it acts as a cumulative uncertainty. However, there is equilibrium between produced and consumed isotopes. In fact, the quantities produced and consumed are less and less uncertain because they depend on the previous step.
We observe that the uncertainty coming from direct effect becomes important at the end of irradiation, compared to the direct uncertainty from §4.1.1. There is a change in the predominant effect. The impacted areas are still the same than direct effect: the center and the fuel near reflectors is the most uncertain and can reach 0.8% at 1σ near the reflectors.
Figure 9: Transmutation uncertainties [% of power factor] from OAT
4.1.3 Direct/Transmutation correlations
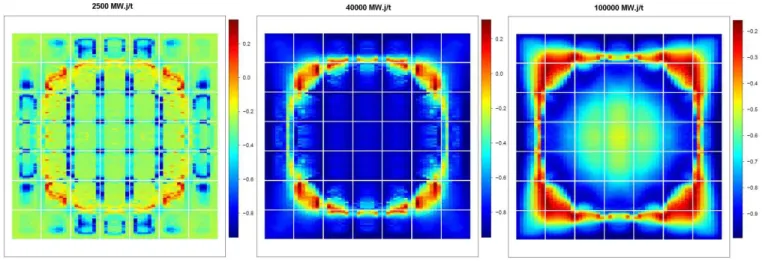
At the beginning, as we could postulate, direct and transmutation terms are not strongly correlated: the average correlation coefficient is around -0.15 (but already negative). The reason is that the uncertainty on concentrations does not influence the total uncertainty during the first depletion steps. As burnup increases, negative correlations appear and form a spatial ring where maximum correlations can be observed. The ring of maximum value is moving away from the core centre and
decays as the burnup increases. More interesting, the ring shape exactly corresponds to the minimum of uncertainty. The negative correlations modify the quadratic sum of direct and transmutation effects, hence reducing the total uncertainty.
At the end of irradiation, a second circle of anticorrelations slightly appear in the core center, as transmutation terms become approximately identical to direct terms in amplitude.
Figure 10: Correlations Bateman/Boltzmann during irradiation from OAT
4.1.4 Total uncertainty from DNB
Using uncertainty maps coming from §4.1.1 and §4.1.2, and calculating correlation coefficients between transmutation and direct terms in §4.1.3, we can constitute the map of total power factors uncertainties coming from nuclear data. The figure 15 (schemes of top) show the uncertainties calculated by OAT method.
The discretization for isotopes, reactions, even energetic groups is still possible with OAT methods (not MC). The next figure shows an example of uncertainties on power factors in 3D representation for different discretization of interest. The relative uncertainties are increasing principally in the center and the corners of the core and we find again the cardinal sinus shape with minimal uncertainty forming a ring.
Figure 11: Total uncertainties at 100 GW.j/T for some reactions and isotopes [% of power factor] from OAT
Table 2: Total uncertainties (in %, 1SD) for different burnup and different isotopes
4.1.5 Sensitivity coming from DNB
With OAT methods, we can observe shape of sensitivities as presented below. The figure 16 shows, for 3 energy groups (fast, epithermal and thermal), the sensitivities issued from Bateman, Boltzmann and Total perturbations in % of power factor for 1% of variation of the nuclear data (Fission in Uranium 235). The following equation can be written:
(
s,r,g)
, t,S (t) S (t) S (t) k ⊂ ∀ totalk = transmutatk ion + directk∀ .
Sensitivity profiles can have negative values, and their study can give information on the power factor variation induced by perturbations on nuclear data.
We can see in the fast energy group that sensitivities values remainvery low. This observation explains the “noise” appearing for fast energy group on Boltzmann, Bateman and Total sensitivities. Indeed, the studied benchmark being a thermal reactor, the perturbations in fast groups do not affecte the sensitivity profile. However, the shape form is the same than this of epithermal groups.
Burnup (MW.d/t) 20 40 000 100 000 20 40 000 100 000 H2O 0,3 0,3 0,28 1,2 1,2 0,3 Al27 0,5 0,4 0,23 1,2 1,1 0,25 U235 0,04 0,02 0,16 0,15 0,14 0,14 Pu239 0 0,005 0,08 0 0,007 0,2 Xe135 0,02 0,02 0,014 0,035 0,05 0,006 Total 0,5 0,5 0,45 1,6 1,6 0,5
Maximum uncertainties in the total effect (% at 1σ)
In the thermal groups, the sensitivity profile is widely different for the shape form and the values of sensitivities which are much higher. The points of low uncertainty observed on the previous figure are the same than the point where sensitivity is null. We can then conclude that this effect is not produced by a balance between thermal and fast neutrons.
Figure 12: Sensitivities in [% power factor / % variation of nuclear data] for fission 235U at 100 GWd/t in 3 energy groups
4.2 Inter-step correlation coefficients
The possibility of calculating correlation coefficient of uncertainty between irradiation steps let us provide that it is maybe possible to develop methodologies targeting to calculate uncertainties at each step using only the first steps (need to be studied and put in a representativity method), especially when the correlations or anticorrelations are strong. In another way, it gives the possibility to build Bayesian inferences methods to integrate results of experiments on integral parameters such as power factors, to compute and re-estimate nuclear data values (extended multi-experience representativity approach, not developed in this paper).
We observe strong correlations between step 0 and other steps (until 64 GWd /t on this case), whereas step 0 does not include Bateman uncertainties (as they are equal to zero). However, at high burnups, the correlations are becoming really weak, i.e. near zero for a lot of spaces areas.
Figure 13: Correlations between time 0 and other burnups for total uncertainties from OAT
4.3 Discussion about results quality
We compare here the two main methods for calculating uncertainties, ie OAT and MC methods. Figure 14 below reproduces propagated uncertainties for 3 depletion steps: OAT (upper part) and MC (lower part). The figure shows that at each step, the MC method slightly underestimates – by about 0.2% -the total propagated uncertainty on power factor. The maximum differences between the two methods are positioned on the highest uncertainty values.
During the irradiation, the relative uncertainties are concentrating in the core center and at the corners. A cardinal sinus shape appears with an area of minimal uncertainty.
Figure 14: Evolution of total uncertainties on power factors during irradiation for both methodologies [% of power factor]
5 CONCLUSIONS
In this paper, a hybrid method for nuclear data uncertainty propagation in depletion problems is applied to local reaction rates, such as power factors. The basic equations developed in the frame of a previous work are slightly modified in order to take into account a more refined space discretisation that is required for precise estimate of local quantities. The built method enables, using a deterministicOAT (One-at-A-Time) perturbation method, to build a complete set of Boltzmann/Bateman sensitivity coefficients, together with their associated Bravais-Pearson correlation coefficients. One shows that those correlation coefficients between the so called direct and transmutation effects, are negative, and hence induce a total propagated uncertainty that is lower than traditional MC or GPT methodologies developed so far.
We show that it is possible to build covariances of nuclides concentrations for each elements of the reactor core. Using these covariances and computing with sensitivity of power factor to the concentration, we create the transmutation term of the total uncertainty. We also produce the direct term and, knowing the total sensitivities, we can compute the correlations between direct and transmutation terms.
The total uncertainty is then the quadratic sum of these different values.
Using the OAT method, it is possible to practice a local sensitivity analysis which gives information on the physical phenomenon happening in the core.
The known of concentration uncertainty lets have information on local burnup (directly proportional to 235U concentration uncertainty). But it allows also to get information of quantities produce in the reactor core and where. It can be for example neutronics poison but it can also be specific material used for medical applications.
We show that OAT and MC methods produce some differences in the uncertainty calculation. These differences can be explained by the MC-sample which does not conserve the correlation between input perturbed data. This sample could have been done using a multidimensional Gaussian and would give the same results than OAT method (already observed on other calculation). This will be done in a next paper and applied to fission yIeld uncertainty propagation on core parameters. The number of calculation depends on the method applied. For GPT, the number of calculations is linked to the number of output neutronics quantities of interest. The space discretisation used in this paper is important and explains why GPT has been excluded for this application. The OAT method requires as many calculations as input parameters to be perturbed. Finally the MC sampling method shows good results with only hundreds of calculations but does not allow a local sensitivity analysis.
5.1 Appendix: Additional Remarks about the F( trr, )Matrix
In the equation , the time dependent F( trr, ) matrix has been introduced. It formally represents the sensitivity matrix of isotopic concentrations to cross-sections. It describes how an isotopic concentration is modified by a cross-section perturbation. Bateman/Boltzmann coupling term is contained in F.
This is expressed in percentage of concentration for 1 percent perturbation on nuclear data. For power factors, this matrix deals with concentrations depending on position in core.
This F matrix can only be created with OAT printing isotopic concentrations of each isotope because, for MC methods we cannot split direct and transmutation terms. Then, in transmutation terms, we cannot split concentration uncertainty from reaction rate sensitivity to the concentration.
Its combination with the COMAC nuclear data covariance matrix allows building the isotopic concentration covariance matrix
F M as: ) , ( ) , ( ) , (r t F r t M F r t MF r = r T r (11) ) , ( tr F r and M ( tr, ) F r
matrices, integrated on all the core are presented in [34].
One particularity of
F
M is to allow to easily get isotopic concentration uncertainty.
F
M being a covariance matrix, it can be decomposed as ZTΩZ, where Z is the diagonal matrix of isotopic concentrations uncertainties and Ω is the correlation matrix between isotopic concentrations. Then we have: ) , ( ) , ( ) , ( ) , ( ) , ( ) , (r t F r t M F r t Z r t r t Z r t M T T F r r r r r r Ω = = (12)
Remembering that Ω contains only 1 on the diagonal, we can identify the individual values of Z as:
i i g r s k j srg j k j k j i k i i i r t r N t r N t r Z , , , ,, ) , ( ,( , ) ( , ) ( , ) ∂ ∂ ∂ ∂ =
∑ ∑
⊂ ⊂ε
ε
σ
σ
r r rIn MC method, an estimation of the diagonal of the isotopic concentration matrix can be built with:
∑
∑
∑
− − ± = ∂ ∂ ≈ ⊂ l l l l r l r l r r 2 , , , , , 2 , ( , ) 1 ) , ( 1 1 ) , ( ) , (r t N r t N r t N r t Z i i i i g r s k k k i i i σ εAn estimator of Zi,i can be calculated with MC methods printing isotopic concentrations depending on
( t
r
r
,
)
and building the MC estimator of it.6 REFERENCES
[1] Mark D. DeHart and Lester M. Petrie. A Radioisotope Depletion Method using Monte Carlo
Transport with Variance Reduction and Error Propagation
http://www.ornl.gov/~webworks/cppr/y2001/pres/118835.pdf.
[2] W. Zwerman et al. « Nuclear Data Uncertainty and Sensitivity Analysis with XSUSA for Fuel Assembly Depletion Calculations”, Nuclear Engineering and Technology Volume 46, Issue 3, June 2014, Pages 343–352
[3] T. Blyth, M. Avramova, K. Ivanov, E. Royer, E. Sartori, O. Cabellos, H. Ferroukhi, and E. Ivanov, “Benchmark for Uncertainty Analysis in Modelling (UAM) for Design, Operation and Safety Analysis of LWRs, Volume I: Specification and Support Data for the Core Cases (Phase II)”, available from OECD/NEA Data Bank (2013).
[4] D. Rochman et al. “Uncertainties for criticality-safety benchmarks and keff distributions” Annals of Nuclear Energy 36 (2009) 810–831
[5] N. Garcia-Herranz et al. “Propagation of statistical and nuclear data uncertainties in Monte-Carlo burn-up calculations”, Annals of Nuclear Energy (2008) 35(4):714-730.
[6] T. J. Downar, “Depletion perturbation theory for burnup dependent microscopic cross sections”, Annals of Nuclear Energy 19 (1) (1992) 27–37.
[7] R. van Geemert, J. E. Hoogenboom, “Development of parallellized higher-order generalized depletion perturbation theory for application in equilibrium cycle optimization”, Annals of Nuclear Energy 28 (14) (2001) 1377–1411.
[8] T. Takeda, H. Naoki and . Tomohiro. “Estimation of Error Propagation in Monte-Carlo Burnup Calculations”. Journal of Nuclear Science and Technology 36, no. 9 (September 1999): 738-745.
[9] Williams, M. L. 1979. Perturbation and Sensitivity Theory for Reactor Burnup Analysis. Oak Ridge, TN: Oak Ridge National Laboratory. ORNL/TM-7096
[10] M. Tohjoh, et al. “Effect of Error Propagation of Nuclide Number Densities on Monte Carlo Burn-up Calculations”. Annals of Nuclear Energy 33 (2006), 1424-1436.
[11] A. Santamarina et al.. Validation of the new code package APOLLO2.8 for accurate PWR neutronics calculations. Proc. Int. Conf. M&C2013, Sun Valley (USA), May 5-9, 2013.
[12] J. M. Ruggieri et al ERANOS2.1 : International code system for GEN-IV fast reactor analysis. Proc Int. Conf. ICCAP’06, Reno (USA), 2006.
[13] G. Alberti et al. Nuclear data sensitivity, uncertainty and target accuracy assessment for future nuclear systems. Annals of Nuclear Energy, 33, pp 700-733, 2006.
[14] D. Rochman et al., “Efficient use of Monte Carlo: Uncertainty Propagation,” Nucl. Sci. Eng. 177, 337 (2014).
[15] H. Sjostrand et al., “Propagation of Nuclear Data Uncertainties for electra Burn-up Calculations,” Nucl. Data Sheets 118, 527 (2014).
[16] P. Helgesson et al., “UO2 Versus MOX: Propagated Nuclear Data Uncertainty for keff, with Burnup,” Nucl. Sci. Eng. 177, 321 (2014)
[17] P. Sabouri et al.. Propagation of nuclear data uncertainties in deterministic calculations : Application of generalized perturbation theory and the total Monte-Carlo method to a PWR burnup pin-cell. Nuclear Data Sheets 118 (2014) 523-526.
[18] D. Rochman, A. J. Koning, D. F. Da Cruz Propagation of 235,236,238
U
and 239Pu
nuclear data uncertainties for a typical PWR fuel element. Nuclear Technology. Vol. 179. 2012.[19] W. S. Yang. A perturbation method for pointwise nuclide depletion calculations. Annals of Nuclear Energy 26 (1999) 265-275.
[20] M. L. Williams. Development of depletion perturbation theory for coupled neutron/nuclide fields. Nuclear Science and Engineering 70 (1979) 20-36.
[21] M. L. Williams, C. R. Weisbin. Sensitivity and uncertainty alaysis for functionals of the time-dependent nuclide density field. Oak Ridge National Laboratory. April 1978.
[22] R. Sanchez et al.. APOLLO2 Year 2010.
[23] I. Zmijarevic. Multidimensional Discrete Ordinates Nodal and Characteristics Methods for APOLLO2 Code. Proc. Int. Conf. on Mathematics and Computation, Reactor Physics and Environmental Analysis in Nuclear Applications (M&C.99), Madrid, Spain, Sept. 27-30, 1999 [24] M. Salvatores, R. Jacqmin. Uncertainty and target accuracy assessment for innovative
systems using recent covariance evaluations. OECD/NEA WPEC SG26 Report, 2008.
[25] B. Habert et al.. Retroactive generation of covariance matrix of nuclear model parameters using marginalization techniques. Nuclear Science and Engineering. Vol. 166, 3, pp 276-287, 2010.
[26] A. Santamarina et al.. The JEFF-3.1.1 Nuclear Data Library. NEA 2009.
[27] A. Santamarina , D. Bernard, N. Dos Santos, C. Vaglio, L. Leal. Re-estimation of nuclear data and JEFF3.1.1 uncertainty calc. Proc. Int. Conf. PHYSOR2012. Knoxville. April 15-20, 2012. [28] C. DE SAINT JEAN et al. Estimation of multi-group cross section covariances. PHYSOR2012.
Knoxville, April 15-20 2012.
[29] D. BERNARD, L. LEAL, O. LERAY, A. SANTAMARINA, C. VAGLIO. U235 covariance matrix associated with JEFF3.1.1 evaluation. JEF/DOC-1360. JEFF Meeting. Paris. Dec 1-3, 2010. [30] C. VAGLIO-GAUDARD, A. SANTAMARINA, G. NOGUERE, J-M. RUGGIERI, J. F. VIDAL, A.
LYOUSSI. New 56Fe covariances for JEFF3 file with the feedback of integral benchmark analysis. Nuclear Science and Engineering. Vol. 166, pp 267-275, 2010.
[31] C. De Saint Jean et al. Covariances on 239Pu, 238U and 235U neutron cross sections with CONRAD code. Proc. Of Workshop NEMEA-7, 2013.
[32] O. Cabellos et al.. Propagation of Nuclear Data uncertainties in transmutation calculations using ACAB Code. International Conference on Nuclear Data for Science and Technology 2010.
[33] M.L. Williams. Perturbation theory for nuclear reactor analysis. CRC Handbook of nuclear reactor calculations. Vol. 3. 1986.
[34] T. Frosio, T. Bonaccorsi, P. Blaise Nuclear Data Uncertainty Propagation methods in Boltzmann/Bateman coupled problem. Part 1. Theory and application to the reactivity during depletion calculation.
[35] V.V. Orlov et al.. Problems of fast reactor physics related to breeding. Energy Rev.,4,pp.991-1075.1980
[36] A. Gandini. Uncertainty analysis and experimental data transposition methods based on perturbation theory. Handbook of uncertainty analysis. 1988.
[37] A. Santamarina et al. Nuclear Data Uncertainty Propagation on Power Maps in Large LWR Cores. PHYSOR2014. Kyoto. Japan. 2014
[38] B. Foad, T. Takeda. Importance of self-shielding for improving sensitivity coefficients in light water nuclear reactors. Annals of Nuclear Energy. Volume 63, January 2014, Pages 417–426 [39] H.F. Stripling et al. / Annals of Nuclear Energy 52 (2013) 47–58
[40] G. Chiba, M. Tsuji, T. Narabayashi. Resonance self-shielding effect in uncertainty quantification of fission reactor neutronics parameters. Nuclear Engineering and Technology. Volume.46 No.3 June 2014


![Figure 5: Direct uncertainties [% of power factor] from OAT](https://thumb-eu.123doks.com/thumbv2/123doknet/13220163.393961/18.918.98.850.102.457/figure-direct-uncertainties-power-factor-oat.webp)

![Figure 9: Transmutation uncertainties [% of power factor] from OAT](https://thumb-eu.123doks.com/thumbv2/123doknet/13220163.393961/21.918.102.858.507.862/figure-transmutation-uncertainties-power-factor-oat.webp)
![Figure 11: Total uncertainties at 100 GW.j/T for some reactions and isotopes [% of power factor]](https://thumb-eu.123doks.com/thumbv2/123doknet/13220163.393961/23.918.95.850.105.344/figure-total-uncertainties-gw-reactions-isotopes-power-factor.webp)
