HAL Id: hal-01620253
https://hal.archives-ouvertes.fr/hal-01620253
Preprint submitted on 20 Oct 2017
HAL is a multi-disciplinary open access archive for the deposit and dissemination of sci-entific research documents, whether they are pub-lished or not. The documents may come from teaching and research institutions in France or abroad, or from public or private research centers.
L’archive ouverte pluridisciplinaire HAL, est destinée au dépôt et à la diffusion de documents scientifiques de niveau recherche, publiés ou non, émanant des établissements d’enseignement et de recherche français ou étrangers, des laboratoires publics ou privés.
Vocational Education, On-the-Job Training and Labour
Market Integration of Young Workers in Urban West
Africa
Christophe Jalil Nordman, Laure Pasquier-Doumer
To cite this version:
Christophe Jalil Nordman, Laure Pasquier-Doumer. Vocational Education, On-the-Job Training and Labour Market Integration of Young Workers in Urban West Africa. 2017. �hal-01620253�
UMR 225 IRD - Paris-Dauphine
UMR DIAL 225
Place du Maréchal de Lattre de Tassigny 75775 • Paris Cedex 16 •Tél. (33) 01 44 05 45 42 • Fax (33) 01 44 05 45 45 • 4, rue d’Enghien • 75010 Paris • Tél. (33) 01 53 24 14 50 • Fax (33) 01 53 24 14 51
E-mail : dial@dial.prd.fr • Site : www.dial.prd.fr
D
OCUMENT DE
T
RAVAIL
DT/2012-13
Vocational Education, On-the-Job
Training and Labour Market
Integration of Young Workers in
Urban West Africa
Christophe J. NORDMAN
Laure PASQUIER-DOUMER
VOCATIONAL EDUCATION, ON-THE-JOB TRAINING AND LABOUR MARKET
INTEGRATION OF YOUNG WORKERS IN URBAN WEST AFRICA1
Christophe J. Nordman IRD, UMR 225 DIAL Université Paris Dauphine
nordman@dial.prd.fr
Laure Pasquier-Doumer IRD, UMR 225 DIAL Université Paris Dauphine
pasquier@dial.prd.fr
Document de travail UMR DIAL Octobre 2012
Abstract:
Young people in Africa are confronted with many difficulties when it comes to their integration in the labour markets and their research for decent and productive jobs. Research on the links between formal education and vocational training and their economic returns are especially crucial in understanding inadequacy between labour supply and demand for young people. This paper aims to contribute to this needed diagnosis by presenting some evidence based on the 1-2-3 Surveys conducted in seven African countries, which provides a consistent and comparable picture of the situation of youth employment in urban labour markets in these countries. We provide some evidence that vocational education might be a good instrument for integrating the formal sector and that it is often more profitable than general education in terms of earnings and firm performance, especially at higher levels of schooling. Overall, young workers without any formal vocational education and training are the more disadvantaged in terms of working conditions, while workers who benefited from a traditional apprenticeship in a small firm occupy an intermediate position.
Key words: Labour market, Youth, Vocational education, On-the-job training, West Africa.
Résumé
Les jeunes africains se heurtent à de nombreux obstacles au moment de leur entrée sur le marché du travail, en particulier dans leur recherche d’un emploi décent et productif. Pour mieux comprendre les déséquilibres entre offre et demande d’emploi pour ces jeunes, cet article vise à apporter un nouvel éclairage sur le lien entre l’éducation formelle, la formation technique et professionnelle et les caractéristiques de l’insertion des jeunes sur le marché du travail, à partir des enquêtes 1-2-3 menées dans sept pays d’Afrique de l’Ouest. La parfaite comparabilité de ces enquêtes permet de mieux appréhender la situation des jeunes sur le marché du travail urbain en Afrique de l’Ouest. Cet article montre que la formation professionnelle favorise l’accès au secteur formel et procure souvent de meilleurs revenus que l’éducation générale, en particulier à des niveaux d’éducation élevés. Il montre aussi que les travailleurs sans aucune formation technique ou professionnelle ont les moins bonnes conditions de travail, alors que les travailleurs ayant effectué un apprentissage traditionnel, occupent une position intermédiaire.
Mots Clés : Marché du travail, Jeunes, Formation professionnelle, Formation sur le tas,
Afrique de l’Ouest
JEL Code: J13, J24
1
This study was commissioned by UNESCO as a background paper for the 2012 EFA Global Monitoring Report: Youth, Skills and Work, Paris: UNESCO (October 2012). We would like to thank François Leclercq for helpful suggestions and comments on a first draft of this study. The usual disclaimer applies.
1. Introduction
Young people in Africa are confronted with many difficulties when it comes to their integration in the labour markets and their research for decent and productive jobs. Youth unemployment, which is substantially higher than global adult unemployment, has been growing in the last decade (ILO, 2006). The situation is likely to keep deteriorating as the total number of youth is expected to keep increasing rapidly in the next ten years1. By defining a specific target through the Millenium Development Goal concerning youth employment (Target 16) the international community has recognised the seriousness of the situation. However, despite the dramatic economic, social and political consequences of youth employment issues on poverty, social cohesion and migration, the literature on African labour markets provides only very few studies focusing on this population.
Regarding the literature, DIAL (2007) stresses that an assessment of youth employment problems in African countries requires a (still missing) clear diagnosis based on hard data and analytical research on determinants of labour market participation and unemployment. Research on the links between formal education and on-the-job training and their economic returns are especially crucial in understanding inadequacy between labour supply and demand. Compared to formal education, on-the-job training allows firm and worker skills to fast adapt to changing economic environment. By contrast, public and private formal education processes generally require many years before they can generate economic returns, in particular employment opportunities for young educated workers. In this respect, on-the-job training appears to be a major channel of human capital accumulation in developing economies, likely to yield crucial productivity augmentation because training is precisely adapted to firm needs.
For assessing the effect of human capital accumulation on labour market outcomes, basic labour market indicators are lacking or are at best incomplete due to data availability and methodological problems (see DIAL, 2007). Worst, different sources lead to opposite diagnoses concerning youth unemployment and its trends. In order to contribute to this badly needed diagnosis, we present in this paper some evidence based on the 1-2-3 Surveys conducted in seven main West African cities, which provides a consistent and comparable picture of the situation of youth employment in urban labour markets in these countries.2 This paper is organized as follows. Section 2 describes the key features of youth labour market integration, crossing this information with the youth’s level of formal education. Section 3 focuses on youth working conditions in the informal sector and on the training opportunities offered by this sector. Section 4 examines the earnings returns to skills, and to vocational education and training for all workers in the labour market and for those in the
1 In 2005, 62 percent of the population was below age of 25 and the total number of the youth (aged 15-24) is
forecast to grow by an additional 22 million between 2005 and 2015 (ILO, 2006). In 2010, the share of youth in the population in Sub-Saharan Africa has reached about 20 percent, making Africa the “youngest” region in the world (UNECA, 2011).
2 Following international standards, we define “youth” as people aged 15 to 24. This definition excludes children
2 informal sector, including production function returns of informal entrepreneurs. Section 6 summarizes our findings and concludes.
2. A profile of youth in the West African cities with a focus on education
In what follows, we make use of the so-called 1-2-3 Surveys covering seven economic capitals of the West African Economic and Monetary Union (WAEMU) in the early 2000s (see Box 1 for a description of the surveys).
We start by looking at overall activity rates, unemployment and then job characteristics in order to identify the key features of youth labour market integration compared to that of their elder counterparts. Meanwhile, we systematically provide a focus on gender differentiation, and general and vocational education levels and their various links with the youth’s job quality.
2.1 Youth activity
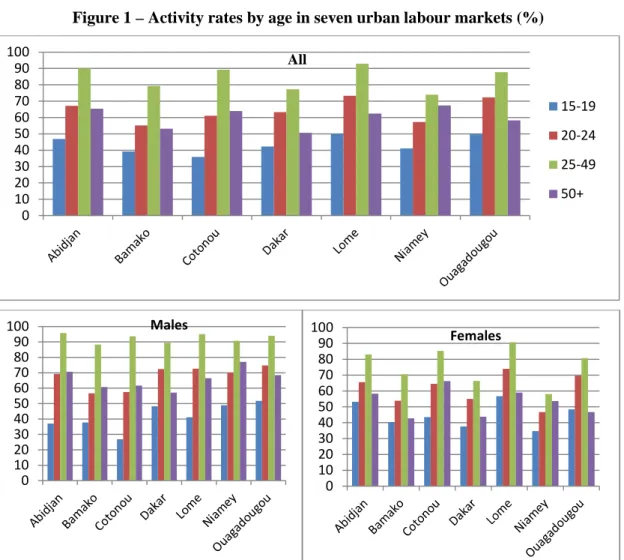
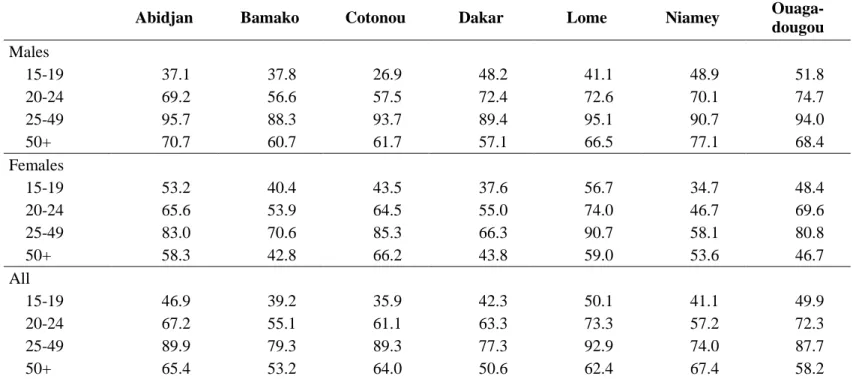
Figure 1 – Activity rates by age in seven urban labour markets (%)
Source: 1-2-3 Surveys. Phase 1 (labour force survey), 2002-2003. Authors' computations.
0 10 20 30 40 50 60 70 80 90 100 15-19 20-24 25-49 50+ All 0 10 20 30 40 50 60 70 80 90 100 Males 0 10 20 30 40 50 60 70 80 90 100 Females
3 As shown by Figure 1, activity rates rapidly increase as the young leave school and enter the labour market. The proportion of young actives is the highest in Lome, Abidjan and Ouagadougou. In Abidjan and Cotonou, girls are much less likely to be enrolled in school than boys and this is reflected in labour market indicators as youth activity rates for young females are much higher than for young males (see Tables 1a and 1b in the Statistical Appendix).
2.2 Youth unemployment
Some stylized facts on youth unemployment in Africa
Before looking at our data for the seven West African cities, five main observations concerning youth unemployment in Africa can be made using existing evidence from applied research and international agencies reports:
(1) In spite of the lack of consensus regarding Sub-Saharan Africa’s position relative to other parts of the world in terms of youth unemployment, the statement of the World Bank’s World Development Report 2007 according to which Sub-Saharan Africa would have the lowest youth unemployment rate is likely to be correct.
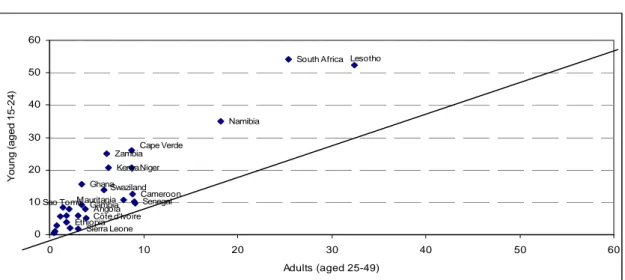
(2) Despite all the problems of consistency that afflict employment statistics in Africa, youth unemployment rates are consistently higher than overall unemployment rates with strong variation among countries (Figure 2 below). The ratio of the former to the latter varies from 1.5 to as much as 4, although in most cases the rate of youth unemployment is about twice as high as the adult unemployment rate. For both the youth and the adults, unemployment rates appear particularly strong in countries in Southern Africa and, to a lesser extent, in Cape Verde.
Figure 2 – Youth vs. adult unemployment in Africa (%)
Source: World Development Report 2007, Table A3, pp. 274-275.
Ethiopia Sierra Leone
GambiaAngola Senegal Mauritania Côte d'Ivoire Cameroon Swaziland Ghana Kenya Zambia Niger Cape Verde Lesotho South Africa Namibia Sao Tomé 0 10 20 30 40 50 60 0 10 20 30 40 50 60 Adults (aged 25-49) Y o u n g ( a g e d 1 5 -2 4 )
4 (3) Although data are scarce, there is suggestive evidence in Africa in general that youth unemployment rates are higher in urban areas than in rural areas (see World Bank, 2008). (4) Youth unemployment rates are generally found to be higher among females than males, but there are exceptions. For example, young males are more likely than females to be unemployed in São Tomé and Principe and Zambia (see World Bank, 2008).
(5) Although the relationship between educational attainments and employment outcomes is not always clear (Kuépié, Nordman and Roubaud, 2012), higher educational attainment in the form of secondary and tertiary education does not lead to a decrease in the unemployment rate for youth (on the contrary, unemployment is sometimes found to increase with education, see World Bank, 2008 and Kuépié et al., 2012).
Box 1. The 1-2-3 Surveys for Urban West Africa
We use a set of surveys called 1-2-3 Surveys or in its French synonym ‘Enquêtes 1-2-3’ covering seven economic capitals of the West African Economic and Monetary Union (WAEMU) in the early 2000s.
A 1-2-3 Survey is a multi-layer survey organized in three phases and specially designed to study the informal sector. Phase 1 is a representative labour force survey collecting detailed information about individual socio-demographic characteristics and employment. Phase 2 is a survey which interviews a sub-sample of informal production units identified in Phase 1. The informal sector in the 1-2-3 Surveys follows the definition of the ILO according to which it includes all enterprises which do not possess an administrative registration number and/or do not keep written accounts. The third phase focuses on household consumption and living conditions. The same methodology and virtually similar questionnaires were used in each city, making for totally comparable indicators.
The surveys for West Africa used in this paper were carried out from 2001 to 2003 in the urban agglomerations of Abidjan, Bamako, Cotonou, Dakar, Niamey, Lome and Ouagadougou. The surveys have been carried out by AFRISTAT and the National Statistical Institutes (INS) with the support of DIAL as part of the Regional Program of Statistical Support for Multilateral Surveillance (PARSTAT).
The samples are made of about 2,500 households in each of the seven West African cities, with the exception of Cotonou where the number was raised to 3,000. A full 17,841 households actually answered the questionnaire. This corresponds to 93,213 individuals for whom an individual questionnaire was completed. For a more detailed description of the data see Brilleau, Ouedraogo and Roubaud (2005).
Unemployment in West Africa: results from the 1-2-3 Surveys
Labour force surveys (namely 1-2-3 Surveys, Phase 1) conducted in the economic capital cities of the seven WAEMU countries produce comparable and reliable labour market statistics (see Box 1). Taking all the WAEMU cities together, the unemployment rate is the lowest (14.6 percent) among those individuals without the minimum level of schooling. It
5 rises to 20-21 percent for those with levels ranging from completed primary schooling to completed secondary schooling. It then drops slightly (19 percent) among those individuals who have completed at least one year of higher education. In Lome, however, unemployment increases strictly with the level of education, from 8 percent for those with no education to 23 percent for those with higher education. The trends are less linear in the other cities. In most cases, unemployment tends first to increase with the level of education, but then decrease with the completion of secondary school and entry into higher education studies. This is particularly the case in Cotonou, Dakar and Ouagadougou where higher education somewhat reduces the extent of unemployment.
Findings from a logit of the probability of being unemployed3 controlling for individual and household characteristics such as age, gender, migratory status, marital status, household’s per capita income, how the individual is related to the head of household and the household’s dependency ratio, are similar to those of the descriptive analysis. Ceteris paribus, individuals without the minimum level of schooling appear to be less exposed to unemployment than those who have at least completed primary school, probably indicating lower job aspirations for the former. Lome shows a strong positive relation between unemployment and education. Cotonou and Abidjan also follow this trend. In the other cities, the link between unemployment and level of education takes the bell shape observed previously.
The fact that investment in human capital does not always open the door to employment reflects the state of deterioration on the African urban labour markets. This deterioration is due to the failure (or absence) of urbanisation policies unable, for whatever reason, to set in motion a drive to create skilled jobs. It is also a consequence of the structural adjustment policies whose credo was, among other things, to reduce staff in the civil service. This explanation is all the more plausible in that among the individuals aged 45 to 59, who entered the labour market before the urban boom and before the full force of the structural adjustment plans was felt, higher education is synonymous with a low risk of unemployment across all the countries.
Concerning youth unemployment levels, the data confirm the relative disadvantage of the youth compared to the adults. In all capital cities, indeed, youth unemployment rates are consistently higher than adult unemployment rates, especially when the young category is restricted to the 20-24 years old (Figure 3 and Table 2 in Appendix). The youth disadvantage is particularly strong in Niamey and Ouagadougou. By contrast, gender differences are not uniform across countries. While Abidjan, Dakar, Niamey and Ouagadougou display higher proportions of female unemployment among the young, the reverse is true for Lome and, to a lesser extent, for Bamako and Cotonou.
3
6
Figure 3 – Youth vs. adult unemployment in urban labour markets (%)
Source: 1-2-3 Surveys. Phase 1 (labour force survey), 2002-2003. Authors' computations.
Finally, although being unemployed is an indicator of exclusion from the labour market, having a job does not always guard well against precariousness.4 In the following sections, we look at the link between education and the quality of the job held by youth workers. We examine in turns various characteristics of the jobs including employment sector, formality status, underemployment, earnings and job satisfaction.
2.3 Job quality of young workers
In addition to providing harmonised data on youth participation and unemployment rates, one of the original features of the 1-2-3 Surveys is to make available rich and reliable information on the employment characteristics of the youth. Generally, data on youth employment characteristics (underemployment, employment by sector and occupation, earnings level, job satisfaction, etc.) are even scarcer than data on youth participation and youth unemployment rates. It is generally admitted that the high level of informal employment in most African countries may be a sign of labour market entry difficulties. It may also be synonymous of low employment quality since informal jobs are generally less secure jobs in which labour and safety regulations do not apply.
Stylised facts on employment sector distribution by education level of the overall workforce
A quantitative analysis of the balance on the West African labour markets reveals the existence of not-inconsiderable unemployment against which human capital accumulation is no shield, especially among young people. An analysis of external efficiency should also
4 See Bocquier, Nordman and Vescovo (2010) for a detailed analysis of employment vulnerability using these
West African data.
0 5 10 15 20 25 30 35 40 45 15-19 20-24 25-49 50+
7 consider the correspondence between level of education and job quality. Job quality is studied here in terms of the employment sector: public formal, private formal and informal.5
There is a very close link between level of education and employment sector. In all of the cities, virtually all of the employed workers (91 percent) who did not start or complete primary school work in the informal sector. Complete primary schooling brings the proportion in the informal sector down to 75 percent and the fact of having completed middle school further reduces it to 50 percent. Only 19 percent of the individuals who entered higher education work in the informal sector. Give or take a few fluctuations, this configuration holds for all the cities except Lome. Although, in the Togolese capital, the formal sector clearly supplants the informal sector as the level of education rises, this trend is slower than in the other cities and a not-inconsiderable proportion (39 percent) of people with higher education work in the informal sector. However, it is worth noting that this city also displays a phenomenon whereby 95 percent of individuals who did not start or complete primary school work in the informal sector.
For further analysis, we decomposed the formal sector into public and private formal sectors and then run a multinomial logit model to measure the net6 influence of education on sector allocation (results not presented to save space, and available on request). The results show that regardless of the city considered and whatever school grade is observed, an additional year of education always tends to yield the maximum impact for integrating the public sector, followed by the private formal sector, with regard to working in the informal sector, which is the reference category. Beyond this general picture, we notice that in three towns (Ouagadougou, Bamako, Lome) out of seven, additional years in higher education (more than 13 years of schooling) have no influence on the probability of integrating the formal private sector, as compared to informal sector. This result may reflect the incapacity of formal private firms in the considered countries to create highly qualified jobs for leavers of the higher education system.
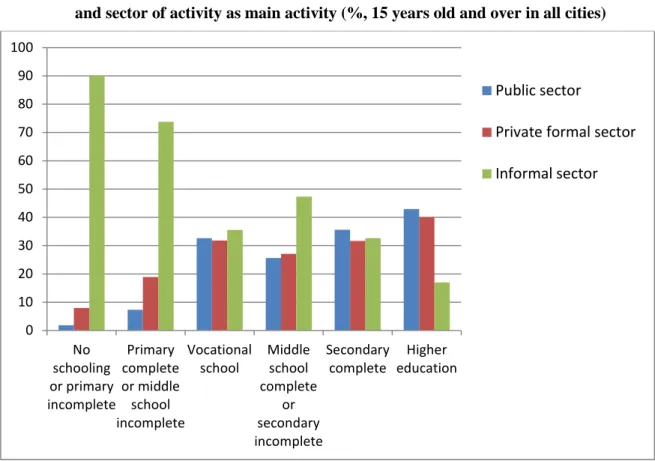
Although the level of education plays an important role in access to the modern sector, the type of education also has an important effect (Figure 4 below). For example, only 37 percent of the individuals with vocational education7 work in the informal sector as opposed to nearly 50 percent of their counterparts who reached an equivalent level in the secondary school system (i.e. those who have completed at least the middle school without reaching the secondary level). When the cities are taken separately, vocational education is found to be a better instrument for integration into the modern sector than general education in Niamey, Dakar, Bamako, Cotonou and Lome. Approximately 82 percent of the Niger capital’s workers with vocational training work in the formal sector, as opposed to 71 percent in Dakar and Bamako, 58 percent in Cotonou and 50 percent in Lome. By way of comparison, the proportion of people who had completed general studies at middle school and worked in the formal sector stood at 68 percent in Niamey, 55 percent in Dakar, 41 percent in Bamako, 44 percent in Cotonou and 30 percent in Lome. However, in Abidjan and Ouagadougou,
5 See the definition of the informal sector in the 1-2-3 Surveys in Box 1.
6 We used the same set of control variables as for the analysis of unemployment.
7 Individuals who completed at least four years of vocational education and who therefore obtained at least the
8 vocational education shows no advantage over general education in terms of the chances of entering the formal sector.
Figure 4 – Distribution of individuals by education levels and sector of activity as main activity (%, 15 years old and over in all cities)
Source: 1-2-3 Surveys. Phase 1 (labour force survey), 2002-2003. Authors' computations.
Youth employment informality
Our data reveal that in all capital cities the bulk of youth employment is in the informal sector (see Table 3 in Appendix). While about three quarters of all the employed are found in the informal sector in each country (80 percent in Cotonou and Lome), this proportion is as high as 90 percent among the sole young workers, reflecting strong labour market entry difficulties. By contrast, almost no young people are found in the public sector. The youth have indeed been strongly penalized by the freezing of new recruitments in this sector. Though their figures concern urban Burkina Faso and first jobs only, Calves and Schoumaker (2004) reach the same conclusion: while 13 percent of young men had their first job in the public sector in 1980, they were only 8 percent in 1990 and about 3 percent in 2000. The same evolution is observed for the formal private sector, with the share declining from 10 percent to 5 percent between 1980 and 2000. Back to the 1-2-3 Surveys, gender differences are mostly found in the proportion of young working in the formal private sector. The latter is always higher for young male workers than for young female workers.
Youth underemployment 0 10 20 30 40 50 60 70 80 90 100 No schooling or primary incomplete Primary complete or middle school incomplete Vocational school Middle school complete or secondary incomplete Secondary complete Higher education Public sector
Private formal sector Informal sector
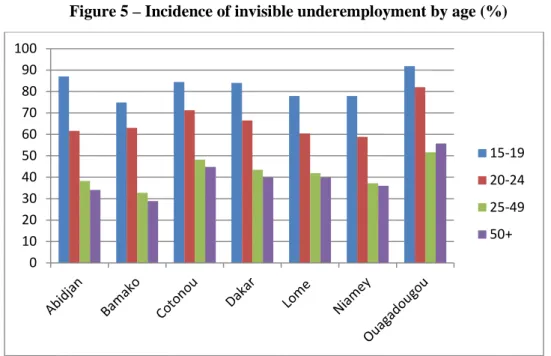
9 Based on four country-case studies, namely Tanzania, Ethiopia, Burkina Faso and Tanzania, the 2008 World Bank Report entitled Youth in Africa’s Labor Market provides some figures on youth time-related underemployment (or “visible” underemployment). According to the report, 6 percent of young men and more than 10 percent of young women report being underemployed in Tanzania. In Ethiopia, underemployment is high in rural areas, with the average worker working less than 30 hours a week, according to the 1999 Labour Force Survey. In Burkina Faso, about 16 percent of all workers feel that they are under-employed. In this regard, the 1-2-3 Survey data suggest that the situation of the young and the adults is more or less the same with respect to time-related underemployment. Be they in their twenties or their forties, between 10 percent and 15 percent of the workers work less than the legal duration of working hours but are willing and available to work more (Table 4 in Appendix). Young women fare worse than young men in all capital cities. On the other hand, there are marked differences between young and adults in terms of invisible underemployment where invisible underemployment includes all workers earning less than the minimum hourly wage (Figure 5 and Table 5 in Appendix).8 Despite variation in levels between capital cities, the incidence of invisible underemployment among the young is almost twice as high as that of adults in most cities. It is thus very likely that the share of working poor is higher among young people than among adults. As for visible underemployment, young women are found to be more concerned than young men.9
Figure 5 – Incidence of invisible underemployment by age (%)
Source: 1-2-3 Surveys. Phase 1 (labour force survey), 2002-2003. Authors' computations.
8 At the time of surveys, the minimum monthly wages (SMIG) amounted, respectively for Cotonou,
Ouagadougou, Abidjan, Bamako, Niamey, Dakar and Lomé, to 25 000, 27 080, 36 000, 22 000, 22 000, 39 000 and 13 800 CFA Francs. See Brilleau, Roubaud and Torelli (2005) for further details.
9 If we add up the different components of underemployment (unemployment, visible and invisible
underemployments) to calculate a synthetic indicator, one obtains a global underemployment of about 67 percent for the seven cities, i.e. 2.7 million individuals over more than 4 million actives (Brilleau et al., 2005).
0 10 20 30 40 50 60 70 80 90 100 15-19 20-24 25-49 50+
10
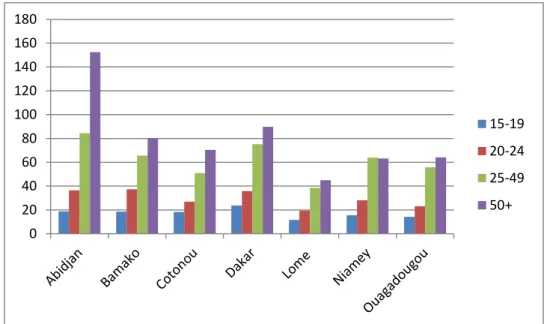
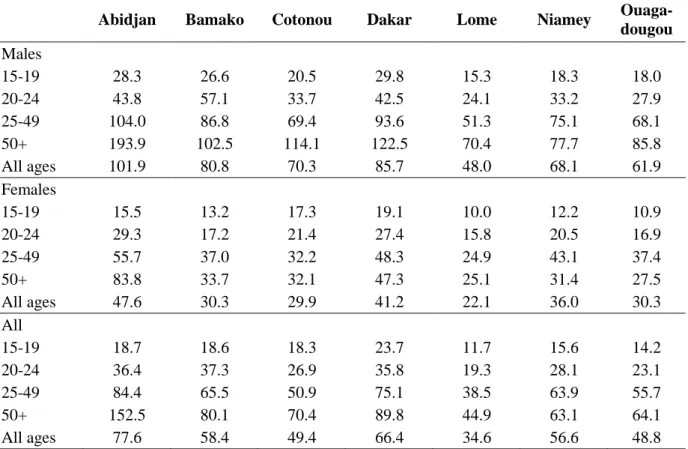
Youth earnings
Being less experienced and working less hours than older workers, young people are also found to earn significantly less than their older counterparts (Figure 6 and Table 6 in Appendix). However, as noted by ILO’s Global Employment Trends for Youth 2004, the question of how much ‘less’ is acceptable and how much ‘less’ reflects discrimination against young people is very hard to judge and requires more detailed statistical analyses that are beyond the scope of this paper. We however provide an analysis of individual earnings and the returns to education in Section 4.
Figure 6 – Mean monthly earnings by age in PPA 1,000 CFA Francs (main activity)
Source: 1-2-3 Surveys. Phase 1 (labour force survey), 2002-2003. Authors' computations.
Job satisfaction of young workers
Finally, 1-2-3 Surveys provide various indicators on youth and adult job satisfaction that complete the picture of labour market conditions for young people (Brilleau et al., 2005; Bocquier, Nordman and Vescovo, 2010). Among employed youth, 35 percent are satisfied with their job and do not plan to look for another job in the near future. Surprisingly enough, this proportion does not significantly vary between sectors: it amounts to 37 percent in the public sector against 36 percent in the informal sector. By contrast, this proportion of satisfied workers does vary by education levels: the share of satisfied workers constantly decreases as education rises, from 37 percent for workers with no formal education to 18 percent for those holding higher education degrees. This is probably because more educated workers have higher expectations that are not fulfilled.
On the other hand, 51 percent of the employed youth would like to get a new job. This proportion decreases with age and income in all capital cities. This means that pressure on the labour market comes not only from the unemployed but also, and in a substantial proportion, from those already employed but dissatisfied with their job. Finally, the wishes expressed by
0 20 40 60 80 100 120 140 160 180 15-19 20-24 25-49 50+
11 the young reveal a strong mismatch between their preferences and real job opportunities. 27 percent of the youth would like to get a job in the public sector whereas only 4 percent of new jobs were created in this sector during the year preceding data collection. By contrast, the informal sector appeals to only 48 percent of the youth even though 82 percent of new jobs were created in this sector. The same kind of results is obtained by Serneels (2004) in the case of Ethiopia. According to the author, half of the young unemployed in urban Ethiopia are looking for a job in the public sector, in spite of the lack of new recruitments. These results suggest that strong disillusions among the young are to come, that could well give rise to severe political and social tensions.
3. Training opportunities for youth working in the informal sector
As the bulk of youth employment is in the informal sector (see previous section and Table 3 in the statistical Appendix), it is crucial to better understand the working conditions of young workers in the informal sector (IS) compared with their older counterparts, and relatively to their training.
3.1 Young workers in the urban informal sector
Taking all the WAEMU cities together, young workers represent around one fifth of the workforce involved in the informal sector (Table 8 in the Appendix). This proportion is higher in Abidjan and Ouagadougou, as one quarter of the workers in the informal sector is young (15-24 years old). With the exception of Dakar and Niamey, the majority (55 percent) of young workers in this sector are females.
The level of schooling is very low in the informal sector of the WAEMU cities, in particular in Bamako, Niamey and Ouagadougou, where the mean years of schooling do not exceed 2.5. The highest levels of education in the informal sector can be found in Lome, Cotonou and Abidjan (4.8, 4.2 and 3.7 years respectively). With 3.3 years of schooling on average, young workers do not have a significantly higher level of schooling than their older counterparts, except in Niamey and Ouagadougou, where the difference is small however. In Abidjan, Cotonou and Abidjan, young workers are even less educated than the old ones.
Employers in the IS do not consider the lack of skills in their staff as a major problem (Figure 7). Only 9 percent of employers declare facing a lack of skills within their staff. However, this share is significantly higher within employers of young workers, except in Abidjan and Ouagadougou. In addition, although the lack of skilled staff is mentioned by only 9 percent of employers, it is the most widespread problem related to staff in the employers’ declarations, together with discipline problems/lack of seriousness.10
10 The other problems mentioned in the questionnaire and related to staff are instability of staff (6 percent of
employers complain of this problem), wages too high (2 percent of employers), problems with unions (1 percent) and other problems (2 percent).
12
Figure 7 – Share of owners with employees declaring a lack of skilled staff, by city (%)
Source: 1-2-3 Surveys. Phase 2 (Informal sector survey), 2002-2003. Authors' computations.
The youngest workers (15-19 years old) enter the IS mostly as employee or apprentice. Only 40 percent of them create their own business (Figure 8). As they grow older, they are more likely to be the owner of the informal business: at years 20-24, 72 percent of workers in the IS are involved in their own business, compared with 91 percent of 25-45 years old workers. The reasons to become owner of an informal business are not exactly the same for the youngest workers than for the 20-24 years old workers (Table 9 in the Appendix). The youngest owners declare less often that they chose to become owner to be independent (23 percent vs. 33 percent), and more often that they did it by familial tradition (16 percent vs. 5 percent). Then, becoming owner of an informal business seems to be more often a constrained choice for the youngest workers than for the 20-24 years old workers.
When the young workers are engaged, they work in a family business for half of them (Figure 8). This configuration holds for four cities out of seven, with the exception of Bamako, Cotonou, and Ouagadougou. In Bamako, and to a lesser extent in Ouagadougou, the large majority of the youngest enter the informal sector by creating their own business (71 percent in Bamako). Conversely, in Cotonou, being the owner of an informal business is very rare for workers under 20 years old, the reason probably being that the help of the family is the main way to enter the informal sector at this age.
0 2 4 6 8 10 12 14 16
All cities Abidjan Bamako Cotonou Dakar Lome Niamey Ouaga Firm with young worker Firm without young worker
13
Figure 8 – Distribution of workers in the informal sector, by relationship with the business owner, city and age (%)
Source: 1-2-3 Surveys. Phase 2 (Informal sector survey), 2002-2003. Authors' computations.
Another interesting result is that one third of the youngest workers (15-19) in the informal sector are unpaid, while this proportion goes down to 13 percent for workers being 20-24. By contrast, unpaid workers are almost inexistent (2 percent) among 25-49 years old workers. Focusing on paid workers, the mean monthly earnings of the 25-45 years old workers is 2.6 times higher than those of the 15-19 category, and 1.7 times higher than those of the 20-24 years old workers. Then, the youngest workers, whose contribution to the workforce in the IS amounts to 9 percent, are clearly the more disadvantaged with respect to remuneration.
3.2 Vocational training of young workers in the informal sector
We have seen that formal education through schooling is very low for workers in the informal sector. However, the question of the characteristics of the training received by the workers in the informal sector remains. Some attempts have been made to assess the extent and efficiency of training in Africa, but not with comparable data and at a large scale. Because of the overwhelming share of the youth in the informal sector, studying training in this sector is naturally a priority.
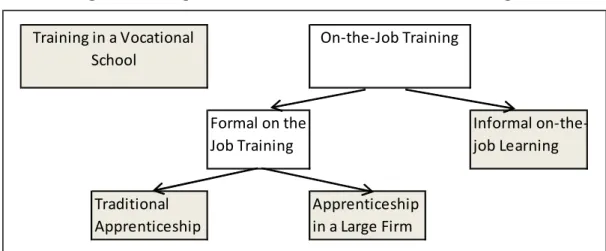
Commonly, two main types of vocational training may be distinguished (Figure 9): training in a vocational school and on-the-job training. On-the-job training represents a major part of total training received by workers during their life. While allowing the completion of initial training in accordance with the precise needs of firms or production units, on-the-job training also enables employers to correct the insufficient initial training of the oldest cohorts of workers or to adapt it when it becomes obsolete in a context of technical or organizational change. However, the difficulty in defining and measuring this type of training makes it unclear how to determine its impacts or how to evaluate its spread.
0 10 20 30 40 50 60 70 80 90 100 1 5 -1 9 2 0 -2 4 2 5 -4 9 1 5 -1 9 2 0 -2 4 2 5 -4 9 1 5 -1 9 2 0 -2 4 2 5 -4 9 1 5 -1 9 2 0 -2 4 2 5 -4 9 1 5 -1 9 2 0 -2 4 2 5 -4 9 1 5 -1 9 2 0 -2 4 2 5 -4 9 1 5 -1 9 2 0 -2 4 2 5 -4 9 1 5 -1 9 2 0 -2 4 2 5 -4 9
All cities Abidjan Bamako Cotonou Dakar Lome Niamey Ouaga Owner Family worker Non family worker
14 Generally, within on-the-job training, we distinguish formal training from informal training (Figure 9). Within the academic literature in sociology, there has been a growing interest in workplaces as learning environments and the importance of on-the-job learning in skill formation processes (Garrick, 1998; Boud and Garrick, 1999). In particular, many workplace learning processes are variously described as ‘informal’ or ‘nonformal’ (Coffield, 2000; Hayward and James, 2004). It is important to appreciate that interest in workplace learning in economics, through both formal and informal processes, is still a relatively recent phenomenon and that evidence about effective practices is still relatively scarce (Battu, Belfield and Sloane, 2003), in particular for Africa (Nordman and Wolff, 2012).
In the West African context, the main form of formal training is traditional apprenticeship (Haan, 2006; Liimatainen, 2002; Johanson and Adams, 2004). Traditional apprenticeship in the informal sector consists of private contractual arrangements between an apprentice or his/her parents and a master craftsman who agrees to provide practical training in the workplace, and subsequently certifies the training in return for a fee or reduced earnings while learning11. Johanson and Adams (2004) show that, in SSA, traditional apprenticeship is probably the largest source of technical and vocational training for informal sector workers. However, it perpetuates traditional technologies and lacks norms and quality insurance. Conducting qualitative field surveys in several African countries including Angola, Benin, Cameroon, Ethiopia, Morocco, Senegal and South Africa, Walther (2006) showed that young people are confronted with two main difficulties: (1) the insufficient qualifications of the master craftsmen and their inability to explain the theory behind certain notions and techniques, (2) the lack of organized progression in the teaching within the learning process, even though this may have distinct phases for assimilating behaviour, for the use of instruments and, finally, for taking part in all the master craftsman’s tasks. Despite these shortcomings, according to Walther (2006), traditional learning is a key factor in giving young people access to the job market. With 1-2-3 Survey data, we can approximate traditional apprenticeship by the fact that the young report having received an apprenticeship in a small informal firm.
In contrast to formal learning processes, informal training is much more difficult to approach. The reason is that informal training most often appears indistinguishable from the employee’s productive activity. Informal training can be described as an unconscious or conscious process of knowledge acquisition when the worker operates in her workplace and stimulates this learning during the repeated exercise of his/her professional activity. For this reason, the attempts aiming at measuring training provided by the employers tend to focus on formal training only and to neglect therefore the informal learning processes. In our data, we do not have a perfect measure of the extent of informal training. However, we can approach informal training using information on whether young workers declared they learnt their job on their own, and not through the three other forms of training defined in the questionnaire:
11
In West Africa, informal apprenticeship training is commonly conceived in three phases: during the first year, the apprentice is expected to observe what the master craftsman and the workshop workers are doing. In a second phase, the apprentice is shown certain practices and gradually asked to do some practical work. In the ultimate phase, the apprentice is fully involved in workshop activities and held responsible for his or her output (Haan, 2006).
15 apprenticeship in a vocational school, apprenticeship in a small informal firm (which we understand as traditional apprenticeship), and apprenticeship in a large firm. We assume that the apprenticeship in a large firm is another form of formal training, with traditional apprenticeship (Figure 9).
Figure 9 – Categorization of vocational education and training (VET)
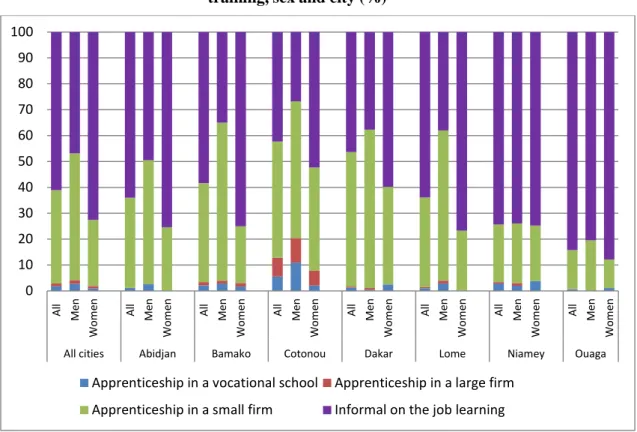
Using this categorization of VET (Figure 9), we observe that training in a vocational school is largely marginal in the IS of the WAEMU cities, as less than 2 percent of young workers in the IS have benefited from such form of vocational training (Figure 10). Cotonou is an exception with more than 10 percent of young men having been trained in a vocational school. Then, on-the-job training is by far the main way of VET in the informal sector.
Within on-the-job-training, apprenticeship in a large firm is a very rare phenomenon. It may reflect the segmentation between formal and informal sectors (Barlet and De Vreyer, 2012), as large firms are mostly formal in the WAEMU context.
For young men, the main form of VET is traditional apprenticeship (49 percent), followed by informal on-the-job training (47 percent). The predominance of traditional apprenticeship for men is particularly marked in Bamako, Dakar and Lome, but is not observed in Niamey and Ouagadougou, where informal on-the-job-learning represents 74 percent and 81 percent respectively.
As far as women are concerned, the bulk of them has not benefited from formal training, as almost three-quarters of women in the informal sector experienced only informal on-the-job training (Figure 10). However, this share is much lower in Cotonou and Dakar (52 percent and 60 percent, respectively).
Formal on the Job Training Informal on-the-job Learning Traditional Apprenticeship Apprenticeship in a Large Firm On-the-Job Training Training in a Vocational School
16
Figure 10 – Distribution of young workers (15-24 years old) in the informal sector, by training, sex and city (%)
Source: 1-2-3 Surveys. Phase 2 (Informal sector survey), 2002-2003. Authors' computations.
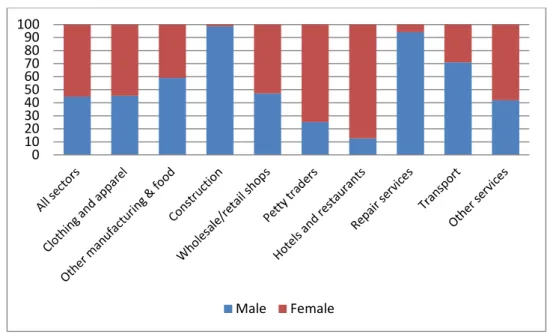
The differences between men and women may be explained by the distribution of sex by sectors of activity and by the preponderance of sector-specific informal on-the-job-training. Figure 11 shows that women are absent from construction and repair services sectors. Yet, traditional apprenticeship is very widespread in these two sectors of activity, as shown in Figure 12: around 70 percent of the young workers have benefited from traditional apprenticeship in these sectors of activity. By contrast, women are over-represented in the sectors of petty traders, hotels and restaurants, and wholesale /retail shops, where the share of traditional apprenticeship in the vocational training distribution of young workers is particularly low. 0 10 20 30 40 50 60 70 80 90 100 A ll M e n W o m e n A ll M e n W o m e n A ll M e n W o m e n A ll M e n W o m e n A ll M e n W o m e n A ll M e n W o m e n A ll M e n W o m e n A ll M e n W o m e n
All cities Abidjan Bamako Cotonou Dakar Lome Niamey Ouaga
Apprenticeship in a vocational school Apprenticeship in a large firm Apprenticeship in a small firm Informal on the job learning
17
Figure 11 – Distribution of young workers (15-24 years old) in the informal sector, by sex and sector of activity (%)
Source: 1-2-3 Surveys. Phase 2 (Informal sector survey), 2002-2003. Authors' computations.
Figure 12 – Distribution of young workers (15-24 years old) in the informal sector, by training and sector of activity (%)
Source: 1-2-3 Surveys. Phase 2 (Informal sector survey), 2002-2003. Authors' computations.
0 10 20 30 40 50 60 70 80 90 100 Male Female 0 10 20 30 40 50 60 70 80 90 100
Apprenticeship in a vocational school Apprenticeship in a large firm Apprenticeship in a small firm Informal on the job learning
18 It is interesting to notice that apprenticeship in a vocational school is concentrated in the sector of transport, as 32 percent of young workers in the IS who experienced a training in a vocational school hold a job in this sector of activity. This result is mainly due to the specificity of Cotonou and Abidjan, which concentrate 68 percent of the informal transport sector within WAEMU cities, and where the workers with training in a vocational school represent more than 20 percent of young workers in this sector12, compared with 5 percent in the other cities.
By comparing the characteristics of young workers with the type of vocational training they received, we see that workers with an apprenticeship in a large firm are the more advantaged in terms of working conditions (Table 10 in Appendix): on average, they earn more and on a more regular basis and they are more often protected by a written contract. On the contrary, young workers without formal training and, more surprisingly, young workers who attended a vocational school are the less advantaged. However, if we exclude unpaid workers of the analysis, workers with an apprenticeship in a vocational school are the more advantaged in terms of earnings. Workers who benefited from an apprenticeship in a small firm occupy an intermediate position, as far as earnings are not taken into account: their mean earnings are very close to those of workers without formal training.
3.3 Formal training opportunities for young workers in the informal sector
We now would like to describe the formal training supply in the informal sector. Taking all the WAEMU cities together, we find that the informal sector provides around 66,600 formal training opportunities for young workers. It means that 17 percent of young workers in the IS are working as apprentices (Figure 13). The supply is particularly high in Dakar (25 percent) and low in Bamako (9 percent) and Ouagadougou (11 percent). Distinguishing these figures by cohorts, the formal training supply is higher for the youngest workers (15-19) than for the 20-24 years old workers, as it represents 24 percent of the former and 13 percent of the latter. The large majority of apprentices are unpaid, except in Niamey and Ouagadougou, where paid apprentices are as numerous as unpaid apprentices (Figure 13). One third of apprentices are family members of the owner and two thirds are unrelated to the owner. Distinguishing paid and unpaid apprentices, these proportions remain unchanged.
12
19
Figure 13 – Distribution of young workers (15-24 years old) in the informal sector, by apprenticeship status at the time of the survey, and city (%)
Source: 1-2-3 Surveys. Phase 2 (Informal sector survey), 2002-2003. Authors' computations.
Higher opportunities for young men to benefit from a formal training are found in the sectors of repair services, manufacturing, construction, clothing and apparel, and transport where apprentices represent 58, 46, 39, 37 and 31 percent of the young male workers, respectively (Figure 14). By contrast, the opportunities for young men are almost inexistent in the sector of petty traders and in the sector of hotels and restaurants.
For young women, opportunities of formal training are low in general, as only 7 percent of young women are apprentices. Clothing and apparel sector is an exception, because it allows 34 percent of young women to benefit from a formal training.
0 10 20 30 40 50 60 70 80 90 100
All cities Abidjan Bamako Cotonou Dakar Lome Niamey Ouaga Paid apprentice Unpaid apprentice Non apprentice
20
Figure 14 – Distribution of young workers (15-24 years old) in the informal sector, by actual apprenticeship status, sex, and sector of activity
Source: 1-2-3 Surveys. Phase 2 (Informal sector survey), 2002-2003. Authors' computations.
4. Earnings and returns to skills and vocational education and training
The analysis of private returns to education originates from standard human capital theory according to which inter-individual earnings differentials result from wage compensations for workers’ different levels of human capital endowment, thereby suggesting that investment in education is an explanatory factor in the distribution of individual earnings. This principle has substantial implications for poor countries because it justifies the existence of income differences between individuals in the labour market. From a policy viewpoint, if returns to education are high for individuals from poor households, poverty reduction policies designed to promote equal opportunities in access to formal education and VET systems would be appropriate. However, in the African context, the existence of significant rents in the formal sector (especially in the dominant public sector) are known to be so high that it might be rational for individuals to ‘queue’ and to discount the returns to be accrued in the informal sector. In this environment, education may no longer guard against poverty and social exclusion. It is then of key interest to reappraise the external efficiency of investment in schooling and training in these countries, in particular in the informal sector.
0 10 20 30 40 50 60 70 80 90 100
Paid apprentice Unpaid apprentice Non apprentice
Men Men Men Men Men Men Men Men Men Men
Women Women Women Women Women Women Women Women Wom en
21
4.1 Workers’ earnings in urban West Africa
Let us now describe the distribution of individual earnings in the West African cities. First, note that is not easy to study earnings in an African urban environment since a large majority of workers works in the informal sector where there are no accounts or pay slips and individuals are naturally reticent to disclose their incomes (but this is not specific to Africa). The 1-2-3 Surveys provide an estimate of the total benefits relating to the job (sundry bonuses, paid holidays, housing, benefits in kind, etc.), whether monetary or non-monetary, which are added to the direct income. However, as is the case in all surveys of this kind, measurement errors are greater for non-salaried workers, particularly in the informal sector. Two strategies were adopted in the 1-2-3 Surveys to at least partially overcome these problems: first, for non-wage earners (self-employed and employers), the interviewers were asked to help them reconstitute their earnings by recapping incomings and outgoings over a reference period to which the interviewee could relate. Following this exercise, non-wage earners’ incomes were translated into a monthly sum in the questionnaire. This monthly income (net) was then divided by the number of hours worked per month available from both phases 1 and 2 of the 1-2-3 Surveys to obtain hourly earnings. Second, the individuals who were unable or unwilling to disclose their exact earnings were asked to give a bracket. Seven brackets were defined by multiples of the minimum wage in force, providing therefore quite thin intervals.13
Summary statistics on earnings reveal that the average monthly earned income for individuals aged 15 and over in the WAEMU cities is 63,000 CFA francs (96 euros in 2006).14
There are some substantial differences between cities. A worker in Abidjan earns on average 78,000 CFA francs (119 euros) per month whereas a worker in Dakar earns 67,000 CFA francs (102 euros) per month and a worker in Lome earns a mere 35,000 CFA francs (53 euros) per month. The other cities are in intermediate positions with 49,000 to 59,000 CFA francs. Breakdown by sector also reveals substantial earnings inequalities. For example, public-sector workers earn an average of 145,000 CFA francs (221 euros) per month, which is approximately three and a half times more than informal sector workers who scrape by with just 40,000 CFA francs (61 euros) per month. Formal private sector workers are also winners on the labour market with 122,000 CFA francs per month. This bipolar configuration is found in all the cities studied: high earnings in the public sector, followed closely by the formal private sector (except in Abidjan where public-sector earnings are far higher – one and a half time – than that of the formal private sector), while the informal sector lags far behind these high yields.
13 For both the workers who refused to disclose their earnings and those who declared only income brackets (on
average 50 percent of our samples), earnings are imputed by an econometric estimation based on an income equation. See Kuépié, Nordman and Roubaud (2009) for further details.
14
22
4.2 Returns to qualifications
We now turn to investigating the effect of education on inter-individual earnings differentials.15 The earnings regressions use the seven samples of the WAEMU cities separately. The estimates are obtained using the log of hourly rather than monthly earnings to take account of the heterogeneity of working hours in different sectors. Together with education, Kuépié et al. (2009, 2012) account for the individuals’ migratory status, marital status, religion, job seniority, potential experience, gender, and dummies for the employment sector in the pooled sector regressions (in reference to the informal sector).
In most studies, log earnings are assumed to be linear or quadratic in years of education. Here, we seek to document the shape of the entire earnings-education profile, and therefore summarize the results obtained with a more flexible approach specifying education in terms of qualifications obtained (or certificates). This is because the earnings function is generally found to be convex in education in developing countries (i.e. increasing marginal returns to education years), which prompts us to measure the returns to different levels of qualification and not just to average years of schooling. To do so, Kuépié et al. (2009) estimate the marginal returns to holding a diploma, thus accounting for the quality of the school career.
Returns to qualifications can be studied in at least two ways. One way is to directly consider the regression model coefficients of dummies for holding a certain diploma. In this case, the coefficient associated with each qualification dummy is interpreted as the rate of increase in earnings between individuals with no qualifications (generally the reference category) and individuals with the qualification considered. Another way is to calculate the marginal returns obtained by subtracting from the considered qualification’s coefficient (qualification d) the value of the coefficient for the qualification immediately below it (qualification d-1). For example, the marginal return to a baccalauréat plus two years of higher education (BAC+2) is the difference between the coefficient for the BAC+2 and the coefficient for the
baccalauréat alone. The return to a primary certificate (CEP) is the difference compared to
the “no diploma” category, that of the middle school certificate (BEPC) compared to the CEP, that of the BAC compared to the BEPC, etc. The marginal returns hence correspond to the increases in earnings generated by the acquisition of the successive qualifications. Here, we rely on these results displaying the marginal returns since they measure the additional value of each qualification rather than the value compared with ‘no qualifications’, which can almost always only ever be positive.
15 The detailed results of this exercise are reported and discussed in Kuépié et al. (2009, 2012). We provide here
summary results of their findings. Note that the estimates account for selectivity effects at labour market and sector entry and for possible endogeneity of the education variables in the earnings functions.
23 Kuépié et al. (2009) report the results of this exercise using histograms of the marginal returns to the various qualifications for each sector (Figures 4 to 7 in their paper). Unsurprisingly, they find that the effect of each qualification on earnings is positive overall, with a huge quantitative leap for secondary and higher education. Their most striking result is that, depending on the cities considered, a certain number of diplomas do not have positive marginal returns. These results either reflect the inadequacy of the training considered with respect to the labour market, or the fact that certain diplomas do not in fact target the labour market but are solely aimed at giving access to higher levels of education. Although the latter hypothesis can be put forward to explain the low marginal profitability of a few diplomas in the public sector, the fact that additional earnings are nil or negative for a large number of diplomas in the formal private sector suggests that many of the VET systems do not correspond to the needs of the labour market in this sector. None of the economic capitals escapes from this lack of connection between the level of skills revealed by the diploma and the remuneration obtained on the formal private labour market. In the informal sector, the marginal earnings seem to be more coherent with the level of training acquired than in the formal private sector (but less than in the public sector). This result is in contrast with the idea that the informal sector does not enhance the value of education.
Furthermore, the profitability of education in the informal sector is illustrated in a spectacular way by the income premium received by individuals when they have a vocational diploma (in particular the BEP, see figure 15 below), in a sector where the returns to vocational training very often exceed those that the same diploma can procure in the formal private sector. Moreover, vocational education qualifications are often found to be more profitable than general education qualifications when compared with the number of years required to obtain them. For example, although it generally takes one year less to obtain the vocational certificate (BEP, on average 11.6 years) than to obtain the baccalauréat (on average 13 years), the BEP is most often more profitable than the baccalauréat, especially in the informal sector.16 The returns to the BEP are even found to be significantly over 40 percent higher than the returns to the baccalauréat in the formal private sector of Cotonou, and in the informal sectors of Ouagadougou, Bamako, Niamey and Lome. The same result holds true if we compare the premium for obtaining the CAP (vocational certificate equivalent to completed primary school) versus the BEPC (general certificate of completed primary education).
16
24
Figure 15 – Marginal returns to the vocational certificate (BEP*) compared to the Baccalauréat
Source: Kuépié et al. (2009), Figure 7, page 504. Note: *Brevet d’Études Professionnelles.
4.3 Gender and cohort differentiations in the returns to schooling
By looking at the magnitude of the returns to schooling using pooled samples of males and females individuals aged 15 and over, we rely on two important, and potentially restrictive, assumptions. Firstly, using pooled data across sexes, the returns to individual characteristics are constraint to be identical for males and females. This might be a problem as women often have less continuous work participation than men, especially in Africa, and as a result may value their human capital differently in the labour market (Nordman and Roubaud, 2009). Kuépié et al. (2009, Table A.7) checked whether the rewards for human capital differ across gender. Their results give mostly support to the pooling assumption, for almost all cities, thereby rejecting gender heterogeneity in the returns to schooling.17
Overall, while the absence of gender differentiation in the returns to education in the public sector is not so surprising given that earnings are set there from formal wage scales irrespective of sex, these mixed results in the private sectors may be more unexpected. For instance, Schultz (2002) discusses gender differences in the returns to schooling in developing
17
Among the few cases where education is differently and significantly rewarded across gender, Abidjan reports greater return to higher education for females in the private formal sector. Similar pattern is observed for the informal sectors of Cotonou and Lome. Likewise, women benefit from a higher return to primary schooling in the private formal sector of Bamako. By contrast, the return to a year in collège is greater for men in the informal sectors of Abidjan and Niamey.
-20% 0% 20% 40% 60% 80% 100% 120%
Public Private form al Inform al
25 countries and concludes that the balance of evidence indicates that these estimates tend to be somewhat higher for women than for men.18
In the case of West Africa, two explanations of the similar education returns across gender may come to mind (Kuépié et al., 2009): firstly, the samples are representative of urban areas where gender differentiation in the labour market is probably less prominent than in rural regions. Secondly, decreasing marginal returns to schooling across education levels had been advanced to explain the observed greater returns to education for women (Schultz, 2002), since women tended to have less education than men on average19, and returns were often observed to be higher at lower levels of schooling. However, the increasing marginal returns evidenced here (the so-called “convexity of the returns”) have now probably a counterbalancing effect.
Another concern when computing the returns to schooling is whether one should consider young and old workers in the same regressions, or more generally individuals belonging to different age cohorts. This is potentially problematic if these two categories receive different rewards for their observed characteristics due to differentiated labour market conditions at the time they got their job. Pooling these individuals implies that there is no cohort effect in the return to human capital. As this assumption does not necessarily hold, Kuépié et al. (2009) relax it by estimating different earnings functions for workers below and above an age threshold (30 years old, due to data limitation in terms of sample sizes). From their results, it seems that the pooling assumption across these two cohorts does not seem to be a so strong hypothesis, at least for education returns.
However, from Figure 16 below, it is easy to compute the returns to education by level for young and ‘old’ workers (above and below 30) in the informal sector where samples are large enough. We observe that the returns to a year in lycée and in higher education are always greater for young workers in the cases of Abidjan, Bamako, Dakar and Lomé and, to a lesser extent because for higher education only, in the cases of Cotonou, Ouagadougou and Niamey. By contrast, in all cities except Ouagadougou, the return to a year in collège is greater for old workers. This indicates that the convex earnings-education profile previously observed is more acute for young workers than for their elder counterparts. Hence, in most cities, the existence of increasing returns by level of education concerns mainly the youngest generation of workers in the informal sector.
18 Mixed evidence of greater education returns for females have been found however by Appleton, Hoddinott
and Krishnan (1999) for Côte d’Ivoire, Ethiopia and Uganda. By contrast, clear higher returns to education for men are obtained by Cohen and House (1993) for the formal sector in Sudan; and higher education returns for women are found by Nordman and Roubaud (2009) for the urban area of Madagascar.
19 This is also the case in the 1-2-3 Survey data here as, on average across all the cities, female paid-work
26
Figure 16 – Marginal returns to schooling levels by age cohorts (above and below 30 years old)
Source: Authors’ computations from Kuépié et al. (2009), Figure A8.
4.4 The returns to schooling and vocational education and training in production functions of informal entrepreneurs
We now focus on the effect of education and formal vocational training (in a vocational school, in a large or small firm) on the value added20 of informal businesses. Therefore, we observe informal entrepreneurs making use of labour, physical capital and human capital, the latter being defined as professional experience, schooling and formal training received. The functional form used for the estimation of the production functions is typically a Cobb-Douglas production function and is estimated in log form. The production function is estimated using pooled samples of the seven WAEMU cities. Table 11 presents the coefficient regression estimates obtained using various specifications.21
We start by investigating the determinants of firm performance for all informal entrepreneurs (column (1)). We then disaggregate the global sample by age of the owners (young entrepreneurs, column (2)), tertiles of physical capital (q1, q2 and q3, columns (3), (4) and
20 Value added is defined as the difference between total sales and total purchases in value, i.e. all costs for
intermediate inputs excluding paid wages and income of the owner.
21 In all specifications, for the sake of simplicity, we do not take into account possible simultaneity biases of the
productions factors (see Ackerberg et al., 2007).
0 5 10 15 20 25 30 35 Y o u n g O ld Y o u n g O ld Y o u n g O ld Y o u n g O ld Y o u n g O ld Y o u n g O ld Y o u n g O ld
Cotonou Ouaga Abidjan Bamako Niamey Dakar Lomé
0-6 education years (Primaire)
7-9 education years (Collège)
10-13 education years (Lycée)
+13 education years (Higher levels)