Potential of Sharia-Compliant Investments
Bachelor Project submitted for the obtention of the Bachelor of Science HES in International Business Management
by
Mohamed ISHUAYED
Bachelor Project Advisor:
Frédéric RUIZ
Geneva, August 19th 2016
Haute école de gestion de Genève (HEG-GE) International Business Management
Declaration
This Bachelor Project is submitted as part of the final examination requirements of the Haute école de gestion de Genève, for the Bachelor of Science HES-SO in International Business Management.
The student accepts the terms of the confidentiality agreement if one has been signed. The use of any conclusions or recommendations made in the Bachelor Project, with no prejudice to their value, engages neither the responsibility of the author, nor the adviser to the Bachelor Project, nor the jury members nor the HEG.
“I attest that I have personally accomplished this work without using any sources other than those cited in the bibliography. Furthermore, I have sent the final version of this document for analysis by the plagiarism detection software URKUND using the address supplied by my adviser”.
Geneva, August 19th 2016
Acknowledgements
I would like to express my gratitude to the people who directly or indirectly helped me throughout the whole process of this Bachelor Project.
First and foremost I would like to thank my advisor, Mr. Frédéric Ruiz, for his help and guidance during the past few months.
Secondly, I would like to thank my HEG colleagues for their input and for allowing me to bounce ideas off them. I would also like to thank all the HEG lectures I have had the pleasure to meet and learn from.
Finally I would like to show my appreciation for all my family, friends, and colleagues from work for their patience and help throughout the whole process.
Executive Summary
Islamic finance and Sharia-compliant investing has seen substantial growth over the years. As more investors are interested in becoming fully Sharia-compliant, the question of what may they be giving up in exchange arises. This has led us to analyze the potential of Sharia-compliant investments.
It is well known that having a Sharia-compliant investment portfolio could be rather restrictive as some sectors and investment instruments are forbidden such as tobacco, alcohol, gambling, pork products, conventional interest based financial and insurance institutions, and conventional fixed income.
In our study, we wanted to provide quantitative proof of any differences an investor may encounter if he were to invest in Sharia-compliant equities and fixed income compared to their conventional counterparts.
We were able to observe that even though Sukuk is often analyzed as a conventional bond, it is substantially different in its underlying risks and payoff structure. The Sukuk market is gaining steam, but it lacks geographical diversity. Another issue we observed with Sukuk is the lack of liquidity. The demand for this type of product is much higher than the supply. Western countries should follow the lead of the United Kingdom and facilitate the issuance and holding of Sukuk securities.
As for the equities market, we compared a Sharia-compliant index with an equivalent conventional index across three regions: global, United States and Europe. Our findings provide proof that since 2003, in all three regions, the Sharia-compliant indices have outperformed their conventional counterparts while taking on similar or lower risk profiles.
Our findings suggest that Sharia-compliant investing has great potential from a financial and economic point of view. Financially, as explained above, an investor can expect to perform as well as or better than the rest of the market. Economically, investing in Sukuk rather than conventional fixed income means that you are making a bigger impact on society as a whole; because when investing in Sukuk, you are financing a real project.
The potential of Sharia-compliant investing will depend heavily on the continued growth of Sukuk certificates and further understanding of their valuation and pricing.
Contents
Declaration ... i
Acknowledgements ... ii
Executive Summary ... iii
Contents... iv List of Tables ... vi List of Figures ... vi 1. Introduction ... 1 1.1 Literature Review ... 1 1.2 Methodology ... 3
2. Sharia investment vehicles ... 4
2.1 Sukuk ... 4
2.1.1 Sukuk market ... 4
2.1.2 Sukuk Murabahah (debt) ... 9
2.1.3 Sukuk Ijarah (Lease contract) ... 10
2.1.4 Sukuk Musharakah (Profit Sharing) ... 11
2.1.5 Challenges ... 12
2.2 Equities... 13
3. Risk and returns measures ... 14
3.1 Performance measures ... 14 3.1.1 Absolute return ... 14 3.1.2 Annualized return ... 15 3.2 Risk measures ... 15 3.2.1 Annualized volatility ... 16 3.2.2 Consistency of performance ... 16
3.2.3 Maximum drawdown and time to recovery ... 17
3.2.4 Sharpe ratio ... 17
4. Analysis of Sharia-Compliant Investments ... 18
4.1 Index Selection ... 18
4.2 Data collection and processing ... 20
4.3 Global equities ... 21
4.3.1 DJIM: Dow Jones Islamic Market World Index ... 21
4.3.2 MSCIW: MSCI All Country World Index ... 22
4.3.3 Index composition ... 22
4.3.4 Risk and return profiles ... 23
4.4 United States equities ... 29
4.4.1 IMUS: Dow Jones Islamic Market U.S. Index ... 29
4.4.2 SPX: Standard & Poor’s 500 ... 29
4.4.3 Index composition ... 29
4.4.4 Risk and return profiles ... 30
4.5 European equities ... 32
4.5.2 E1DOW: Dow Jones Europe Index ... 33
4.5.3 Index comparison ... 33
4.6 Fixed Income ... 34
4.6.1 Risk and return profiles ... 34
4.7 Limitations ... 37
Conclusion... 38
Bibliography ... 41
Appendix 1: Risk and return profiles ... 43
List of Tables
Table 1 - Sukuk Issuance Type by Issuer Type in USD Millions from January
2001 to December 2015 ... 9
Table 2 - Conventional and Sharia-Compliant Asset Allocation... 18
Table 3 – Equity Index Characteristics ... 19
Table 4 - Fixed Income Index Characteristics... 19
Table 5 - Global Equities Country Allocation ... 22
Table 6 - Global Equities Sector Allocation... 22
Table 7 - Global Equities Annualized Returns ... 24
Table 8 - Global Equities Annualized Volatility ... 25
Table 9 - Global Equities Sharpe Ratio ... 25
Table 10 - Global Equities Maximum Drawdown and Days to Recovery ... 26
Table 11 - Global Equities Percentage of Postive Months ... 28
Table 12 – U.S. Equities Sector Allocation ... 29
Table 13 - U.S. Equities Sharpe Ratio ... 31
Table 14 - U.S. Equities Maximum Drawdown and Days to Recovery ... 31
Table 15 - Fixed Income Annualized Returns and Volatility Gross of Fees ... 35
Table 16 - Fixed Income Annualized Returns and Volatility Net of Fees ... 36
Table 16 - Equities Indicative Dividend Yields ... 37
Table 17 - European Equities Country Allocation ... 43
Table 18 - European Equities Sector Allocation ... 43
Table 19 - Equities Annualized Returns ... 43
Table 20 - Equities Annualized Volatility ... 44
Table 21 - Equities Sharpe Ratio ... 44
Table 22 - Equities Annual Returns ... 44
Table 23 - Equities Annual Volatility ... 45
Table 24 - Fixed Income Annual Returns and Volatility ... 45
List of Figures
Figure 1 - Sukuk Issuances January 2001 to December 2015 in USD Millions .. 5
Figure 2 - Sukuk Issuance by Issuer Type ... 5
Figure 3 - Global Sukuk Issuance Regional Break-Up ... 6
Figure 4 - Classification of Sukuk Contracts ... 8
Figure 5 - Ijarah Sukuk Structure ... 11
Figure 6 - Global Equities Historic Price ... 23
Figure 7 - Global Equities Maximum Drawdown and Time to Recovery ... 27
Figure 8 - U.S. Equities Historic Price ... 30
Figure 9 - U.S. Equities Maximum Drawdown and Time to Recovery ... 32
Figure 10 - European Equities Historic Price ... 33
Figure 11 - Fixed Income Historic Price Gross of Fees ... 35
1. Introduction
Islamic finance and Sharia-compliant investing in its current form has existed since the middle of the 1970s. However, in recent years they have seen an exponential growth in interest. According to The World Bank (The World Bank, 2015), Islamic finance has grown at a pace of about 10 to 12% annually over the past decade, with global Sharia-compliant financial assets being estimated at USD 2 trillion in 2015.
In 2003, Islamic Financial assets were estimated at USD 200 billion, according to the IMF (IMF, 2015). The growth of Sharia-compliant assets can be credited to the growth of the world’s Muslim population, making about a quarter of the world’s population, and the awareness of Muslim investors about such products.
Over the past few years, interest in Islamic finance has grown beyond the typical hubs in the Middle East and Southeast Asia. Western countries, such as the United Kingdom have facilitated the use of Islamic products such as the issuance of Sukuk certificates, which are the Sharia-compliant equivalent of conventional bonds. Governments of Luxembourg, the United Kingdom and Germany have gone as far as to issue sovereign Sukuk securities to fund specific projects.
Even with the widespread growth of Islamic Finance, many individual investors in western countries are unfamiliar with its concepts. Due to the complexity of Sharia-compliant investments, Islamic investors have to rely heavily on portfolio managers to help them select their products. Conventional asset allocation and portfolio management are not suitable for a Sharia-compliant investor, which has led us to investigate the potential of Sharia-compliant portfolio management and compare it to its conventional counterpart.
Investing in Sharia-compliant products usually entails many costs which could lead to lower returns for investors. Through our study, we would like to analyze the potential of these products from an investor’s point of view.
1.1 Literature Review
Oxford dictionary’s website defines Sharia as: “Islamic canonical law based on the teachings of the Koran and the traditions of the Prophet (Hadith and Sunna), prescribing both religious and secular duties and sometimes retributive penalties for lawbreaking.”
In Islamic finance, it is important to take into consideration the central position of Sharia laws. As defined above, Sharia laws directly impact the way people invest. Over time, Sharia Boards were introduced as a way to make sure investments are compliant with the Laws. Sharia Boards are composed of highly regarded Islamic scholars. Since the Board gives its approval for investments, they have to be well respected for people to consider their advice.
According to Bassens, Derudder and Witlox (2011) there is evidence of a “transnational Sharia elite.” Through their study, they have been able to see that some well-respected Islamic scholars appear in many different Sharia Boards all over the world. These “Sharia elite” are able to shape Islamic finance through their separate rulings and through their influence over many different Boards.
Due to the somewhat subjective nature of some Sharia Boards, we are able to find some discrepancies in the way different Boards go about their compliance. Conservative scholars often have a tougher screening for Sharia-compliant investments, whereas more liberal ones may use higher thresholds. This has led Feisal Khan (2010) to question the whole concept of Islamic finance, discussing the fact that financial institutes do their best to find Scholars that pass their product as Sharia-compliant just to be able to sell it to investors.
Ulrich Derigs and Shehab Marzban (2009) also discuss the inconsistencies they found in the screening process done by different well known Islamic indices. They question the way current portfolio management is done. For the moment, Sharia-compliant fund managers and portfolio managers only select assets that are Sharia-compliant themselves thus restricted their investment universe and their potential returns. The authors propose a new way of making a Sharia-compliant portfolio. Their idea is to consider the portfolio as a separate entity that has to be Sharia-compliant in itself. Instead of have each separate asset in the portfolio Sharia-compliant. Through their study, they are able to find Sharia-compliant portfolios with characteristics that are very similar to traditional portfolios.
1.2 Methodology
Islamic Finance is a vast and sophisticated industry that has gone through many developments over the years; however, we wanted to concentrate our research more specifically on individual investors and the different Sharia-compliant instruments they may be confronted with.
Sharia-compliant investing can reduce rather significantly the investment universe due to the screening process done for non-Sharia compliance. We wanted to study if the reduced investment pool has a detrimental impact on Sharia-compliant investors, or if they can expect similar returns as conventional investors.
To do so, we will present the different Sharia-compliant investment vehicles and we will analyze the risk and return characteristics of the two main categories:
• Fixed income • Equities
We will start by presenting the two types of investment categories. Then we will analyze their risk and return characteristics using mathematical equations.
2. Sharia investment vehicles
2.1 Sukuk
Because Sharia law does not permit usury, Islamic investors are unable to access a very big part of the capital markets: conventional fixed income instruments. In traditional finance, fixed income is a staple of all client portfolios. For many years, Islamic investors could not invest in these lower risk assets in a Sharia-compliant manner. However, over the past sixteen years, a similar instrument has gained steam; that instrument is Sukuk. Sukuk is the Arabic word for certificates.
It is often considered that Sukuk are the Sharia-compliant equivalent of conventional bonds. Though Sukuk are the closest financial instrument Islamic investors have to traditional interest bearing bonds, they are in fact structured very differently. The most important aspect of Sukuk is their risk and profit sharing structures, which are a staple of Islamic Finance
Sukuk gives its holder the ownership of a securitized set of assets through various forms of Sharia-compliant contracts. Securitization is a process “which involves moving assets into a special legal entity. This special legal entity then uses the assets as guarantees to back (secure) a bond issue, leading to the creation of securitized bonds.” (Choudhry, Wilcox, 2013: 297).
An interesting definition of Sukuk securitization is:
“Sukuk are securitizations of either assets (and their cash flows) or entire businesses (and their cash flows). They are not bonds. Each asset originator has a definable cost of obtaining funds from direct funding sources (i.e., the interest rate it must pay). The principle and purpose of asset securitization is to isolate certain of the originator’s assets to allow an investor in those assets to provide lower-cost funding than the originator’s direct funding cost absent such an isolation (taking into account transaction costs).” (McMILLEN, 2013:184)
2.1.1 Sukuk market
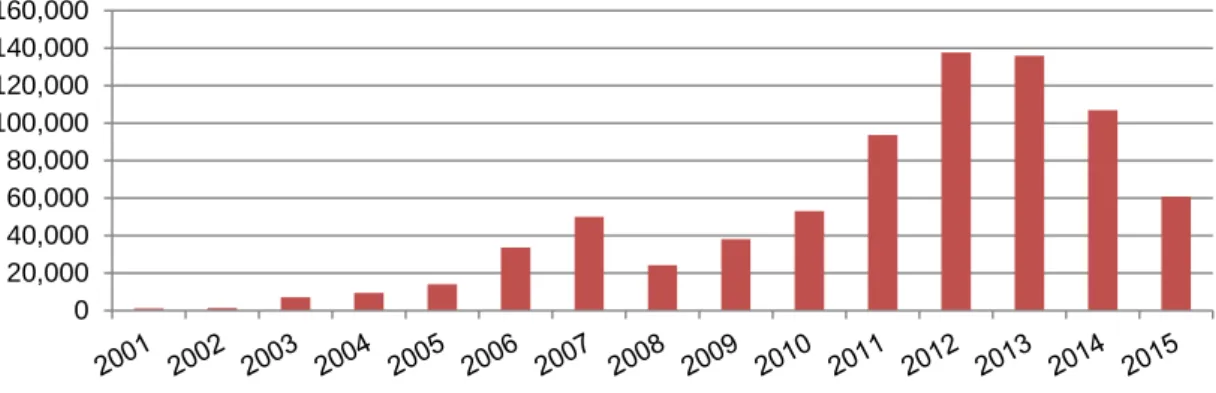
Since the early 2000’s, the issuance of Sukuk has increased substantially. According to the Sukuk Report 5th edition released in March 2016 by the International Islamic Financial Market (IIFM), there has been a total of about USD 767 billion worth of Sukuk issued between January 2001 and December 2015. In figure 1 below, we have a graphical representation of the amount issued per year.
Figure 1 - Sukuk Issuances January 2001 to December 2015 in USD Millions
Source: adapted from IIFM, 2016
We can clearly observe a high uptake in Sukuk issuance over the years. However in 2015, we could witness a drop of about 43% in new issuance:
“A large part of this decline is due to BNM1 policy decision to discontinue issuance of short-term investment Sukuk and this may not be taken as a reflection of weakness in the Sukuk market but a change of strategy”
(IIFM, 2016: 5).
There are three types of entities that issue Sukuk securities: • Sovereign: Sukuk issued by a national government
• Quasi-Sovereign: Sukuk issued by a public sector entity often sponsored or owned by a national government
• Corporate: Sukuk issued by a private corporation
Figure 2 - Sukuk Issuance by Issuer Type
Source: adapted from IIFM, 2016
1
Bank Negara Malaysia (BNM) is the central bank of Malaysia 0 20,000 40,000 60,000 80,000 100,000 120,000 140,000 160,000 57% 10% 33% Sovereign Quasi-Sovereign Corporate
In figure 2 above, we have the percentage of Sukuk issued by each type of entity between January 2001 and December 2015. Sovereign entities have issued USD 437 billion worth of Sukuk, equivalent to 57% of total issues. A high percentage of the Sukuk issued by Sovereign entities are short-term (under 12 months) certificates. A concern with Sukuk securities is the lack of regional diversification. As we can view in figure 3 below, over 95% of all Sukuk issues since 2001 are from the Middle East and Asia, with 57% coming from Malaysia and a further 22.02% coming from the Gulf Cooperation Council (GCC)2 region. Looking a little closer, we can observe that only 2% of all Sukuk are from developed regions (USA and Europe).
Figure 3 - Global Sukuk Issuance Regional Break-Up
Source: adapted from IIFM, 2016
It should be noted that even though most Sukuk are issued in developing regions, a considerable amount of them are considered Investment Grade3, meaning that the top rating agencies provide them with a rating BBB- or above .
Following our brief analysis of the Sukuk market, we would like to present some of the different types of Sukuk encountered on the market. Before investing in Sukuk, it is important to understand the way they are structured. There are several different types
2
Gulf Cooperation Council (GCC) is a “political and economic alliance of six Middle Eastern countries: Saudi Arabia, Kuwait, the United Arab Emirates, Qatar, Bahrain and Oman” (Britannica 2016)
3
Investment Grade fixed income is debt with a high credit rating, meaning that the risk of non-payment is low. Any debt with a rating under BBB- is called non-investment grade or Junk Bonds, meaning that the investment is highly risky.
73.86% 22.02% 2.28% 1.65% 0.18% 0.01% Asia GCC Africa Europe USA
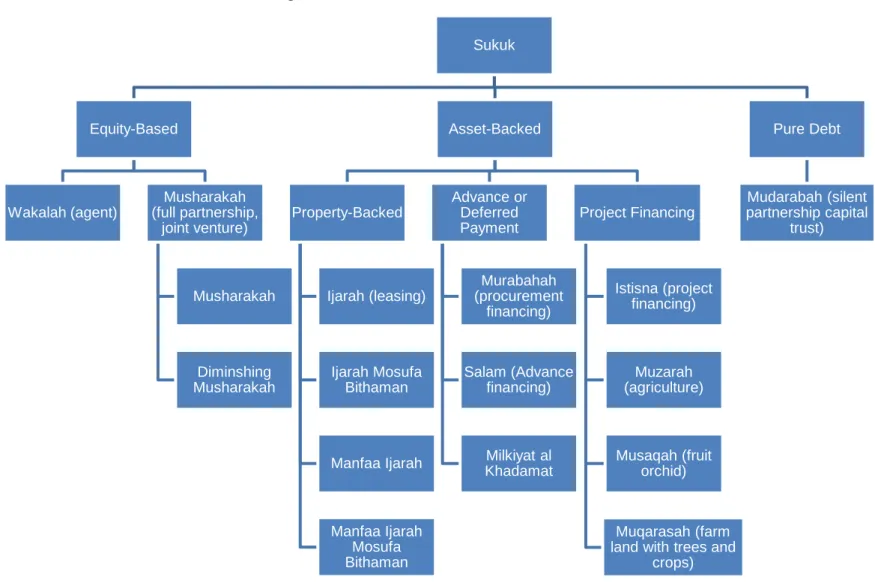
of existing Sukuk, with several proposed classifications. One proposal is to classify Sukuk contracts based on their financial characteristics as depicted in figure 4 (Ariff, Mohamed, Safari 2014: 26).
In figure 4 below, we could observe that there are many different types of Sukuk contracts. Each one has its own particular structure and financing objective, however, not all the mentioned contracts are frequently used in tradable Sukuk form.
Figure 4 - Classification of Sukuk Contracts
Source: Ariff, Mohamed, Safari 2014: 27
Sukuk Equity-Based Wakalah (agent) Musharakah (full partnership, joint venture) Musharakah Diminshing Musharakah Asset-Backed Property-Backed Ijarah (leasing) Ijarah Mosufa Bithaman Manfaa Ijarah Manfaa Ijarah Mosufa Bithaman Advance or Deferred Payment Murabahah (procurement financing) Salam (Advance financing) Milkiyat al Khadamat Project Financing Istisna (project financing) Muzarah (agriculture) Musaqah (fruit orchid) Muqarasah (farm land with trees and
crops)
Pure Debt
Mudarabah (silent partnership capital
For all Sukuk securities, a Special Purpose Vehicle (SPV) is created by an investment bank for the purpose of asset securitization. An SPV is an independent legal entity that issues ownership certificates (Sukuk) to the investors to which the entity issuing the Sukuk has to relinquish ownership of an income-generating asset as a guarantee for the loan. The asset-backing nature of Sukuk securities does not permit companies to leverage their balance sheet through debt contracting; because if the company doesn’t have enough assets to collateralize, it can’t take on more debt.
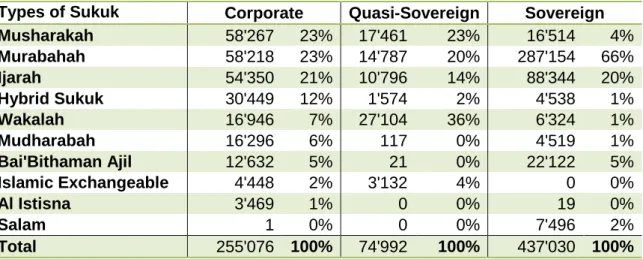
Table 1 - Sukuk Issuance Type by Issuer Type in USD Millions from January 2001 to December 2015
Types of Sukuk Corporate Quasi-Sovereign Sovereign
Musharakah 58'267 23% 17'461 23% 16'514 4% Murabahah 58'218 23% 14'787 20% 287'154 66% Ijarah 54'350 21% 10'796 14% 88'344 20% Hybrid Sukuk 30'449 12% 1'574 2% 4'538 1% Wakalah 16'946 7% 27'104 36% 6'324 1% Mudharabah 16'296 6% 117 0% 4'519 1% Bai'Bithaman Ajil 12'632 5% 21 0% 22'122 5% Islamic Exchangeable 4'448 2% 3'132 4% 0 0% Al Istisna 3'469 1% 0 0% 19 0% Salam 1 0% 0 0% 7'496 2% Total 255'076 100% 74'992 100% 437'030 100%
Source: adapted from IIFM, 2016
In table 1 above, we can observe the different types of Sukuk issues by issuer type. The most popular forms of Sukuk are:
• Murabahah – 47% of total issues • Ijarah – 20% of total issues • Musharakah – 12% of total issues
We will highlight the main characteristics of the above three types of Sukuk in the following sub-sections.
2.1.2 Sukuk Murabahah (debt)
A Murabahah contract can be viewed as a sales contract where a financial institution
“buys a good or asset and sells it to the client at a mark-up. The client pays for the good or asset at a future date or in installments.” (ASHRAF, HASSAN, 2013: 234)
Murabahah contracts are often used in Islamic banking for trade finance. It replaces the traditional model where a bank would lend money to a client with an interest rate.
However, the mark-up used by financial institutions for these types of contracts are often pegged to conventional interest rates.
Even though the aforementioned practice could be viewed as non-Sharia-compliant, Islamic banks are often forced to do so due to the concept of supply and demand. If the lender provides mark-ups lower than the interest rates, the demand for the Murabahah contracts would rise allowing the lender to raise the mark-up. However, if the mark-up is higher than the interest rates, clients will avoid Murabahah contracts and they will use conventional financing techniques.
Murabahah contract are often short-term and used for liquidity management similar to a fiduciary deposit4 in conventional banking.
As for Murabahah Sukuk, a useful definition is:
“With a Murabahah Sukuk, an Islamic bank securitizes its trading transactions with a proportion of the fixed markup providing the return to the Sukuk investor, and the bank uses the repayment from its trading client to repay the Sukuk holder on termination of the contract.” (Ariff, Mohamed, Safari 2014: 63)
2.1.3 Sukuk Ijarah (Lease contract)
Ijarah, from the Arabic meaning “to rent something”, is a frequently used form of financing in Islamic banking. In many ways an Ijarah contract is very similar to a lease contract. The lessor would buy or provide an asset to the lessee in exchange for a rental fee.
There are two types of Ijarah contracts. In the traditional Ijarah contract, the lessee has the right to use the leased item while paying rent for the right to use it. The second form is the Ijarah Wa Iqtina, meaning to lease and to own. In its second form, the lessor and lessee enter in a second contract in which the lessee agrees to buy the asset following the maturity of the Ijarah contract.
“Ijarah wa iqtina is popularly practiced when an Islamic bank purchases equipment or some other capital asset based on the request of a customer and then rents it to the customer for a fixed amount. The customer promises to purchase the equipment or asset within a specified period, and ownership is transferred from the bank to the customer. The lease contract is completely separate and independent from the contract of purchase of residuals, which must be valued on a market basis and cannot be fixed in advance.”
(Ariff, Mohamed, Safari 2014: 65)
4
A fiduciary deposit is a short term contract in which a bank would invest cash in another bank in exchange for an interest rate. Often used for excess liquidity.
An important point pertaining to the Ijarah contract is the ownership of the leased asset. Under said contract, the ownership and liability for the asset remains with the lessor. Only possession is transferred meaning the risk remains with the lessor.
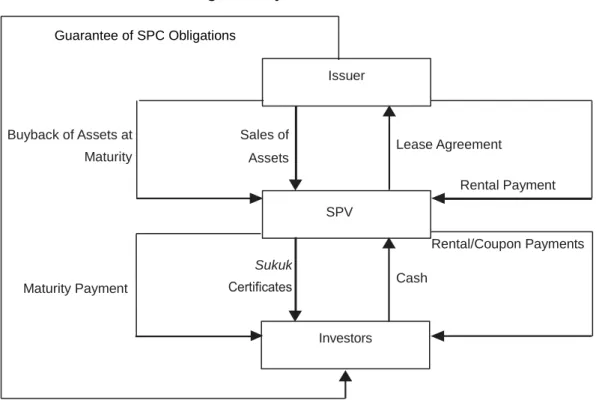
As for Ijarah Sukuk, the issuer would sell an asset to the SPV which will lease the asset back to the issuer in exchange to a prefixed or benchmarked rental. SPV in turn would issue Sukuk certificates to investors through securitization of the underlying contract. In figure 5 below we have a simple example of an Ijarah Sukuk structure.
Figure 5 - Ijarah Sukuk Structure
Source: Ariff, Mohamed, Safari 2014: 66
2.1.4 Sukuk Musharakah (Profit Sharing)
The final Sukuk we would like to present is the Musharakah Sukuk. A Musharakah, from the Arabic word for “partnership”, can be viewed as a joint venture between two parties. Each party would provide either capital or management, or some of each, to the joint venture. A Musharakah is entered to finance a specific project. In a Musharakah, all profit and loss are shared between the two contracting parties. The profit is shared following a pre-negotiated payoff ratio, whereas the losses are absorbed by both parties in proportion to their capital invested in the project.
Some types of Musharakah, called diminishing Musharakah, also provide a share buy-back feature for the issuer. In other words, the issuer would buy buy-back the investors’ share of the joint venture in installments.
Investors Issuer Buyback of Assets at Maturity Rental Payment Sales of Assets Lease Agreement Maturity Payment SPV Rental/Coupon Payments Sukuk Cash Guarantee of SPC Obligations
A Musharakah Sukuk, as with the previous mentioned examples, is the process of securitizing one or several Musharakah contracts and issuing Sukuk securities to investors. A Musharakah Sukuk is very different than any conventional bond as the flows generated are neither fixed nor are they pegged to a benchmark. The cash-flows depend on the project in the underlying Musharakah contract or contracts.
2.1.5 Challenges
There are three major challenges that currently exist for the Sukuk market. First of all, we are presented with an issue of liquidity. “Liquidity describes the degree to which an asset or security can be quickly bought or sold in the market without affecting the asset's price” (Investopedia, 2016a). Illiquidity is a major problem for most Sukuk markets. As of 2011, the majority of Sukuk markets suffered from illiquidity to the extent that 70% or more of all Sukuk never exchanged ownership (Ariff, Mohamed, Safari 2014: 190). A lack of liquidity leads to market inefficiency. Currently, the demand for Sukuk is higher than the supply.
The second challenge we have with Sukuk is their valuation. Today, most professionals value Sukuk the same way they would value conventional bonds. While this may work for some Ijarah Sukuk, where the issuer pays regular loan repayments, this doesn’t work for most other types of Sukuk, where the payoff is not necessarily regular. This issue is further emphasized by the lack of liquidity, because if there are a limited number of sellers on the market, the rare seller could demand a higher price than the valuation would demand.
The final challenge faced by potential investors is the higher costs associated with issuing and trading Sukuk. Due to the complex structure of Sukuk, the legal and set-up fees are higher than a conventional fixed income issuance. The higher cost is indicative of the lack of standardization in the issuing process.
These three challenges are due to the rather young nature of Sukuk. As more entities become comfortable with the process of issuing a Sukuk, we could expect to witness an uptake in issuance. If Sukuk gain liquidity, the markets will have to further extend its understanding of the products and we could expect to find more sophisticated valuation theories to gain further market efficiency.
2.2 Equities
The Sharia-compliant equities universe is very vast. Unlike fixed income, conventional equity can be considered Sharia if it passes a screening process. There are two types of screening that are commonly done, one qualitative and the other quantitative.
The qualitative screening serves to exclude companies that are active in industries that are considered to be prohibited by Sharia. Some of these industries include the production and distribution of tobacco, alcohol, gambling, pork products and conventional interest based financial and insurance institutions.
The quantitative screening, often called financial screening, assists in the exclusion of companies that have a debt heavy capital structure; meaning that an unacceptable portion of their income is generated from debt. It also excludes companies with too much income being generated from interest-bearing instruments. An example of financial screening is the following:
o Total debt divided by trailing 24-month average market capitalization o The sum of a company’s cash and interest-bearing securities divided
by trailing 24-month average market capitalization
o Accounts receivables divided by trailing 24-month average market capitalization”
(Dow Jones, 2016)
A Sharia Board is used to supervise the implementation of all screening process. They are also consulted if any issue arises from the screening process or when there is doubt as to the compliance of a specific company. Some Sharia Boards have different opinions on the screening process. One Board could deem a company not Sharia-compliant, whereas another board could have the opposite opinion.
3. Risk and returns measures
In Islamic finance and traditional finance alike, there are many different mathematical formulas and ratios used to calculate risk and returns for assets. We focused our research on the following measures:
• Performance • Volatility
• Consistency of performance
• Maximum drawdown and time to recovery • Sharp ratio
3.1 Performance measures
Many people focus on performance measures when analyzing potential investments. The performance of an investment can be considered as the return earned on an asset during a given period. To calculate the performance, we concentrated on the concept of true daily time weighted returns. “The time-weighted rate of return measures the compound rate of growth of $1 initially invested in the portfolio over a stated measurement period” (DeFusco, 2004: 341).
To calculate the time-weighted rate of return, we first have to calculate the daily return. Daily performance is calculated by dividing today’s closing price by yesterday’s closing price and subtract the result by one, as presented in the below equation:
𝑅𝑅𝑡𝑡 = �𝑃𝑃𝑃𝑃𝑡𝑡
𝑡𝑡−1� − 1 (1)
Where:
• Rt = return for period t • Pt = closing price for time t
• Pt-1 = closing price for time t -1 period • t = period
When calculating daily returns, “t” would equal to one day
3.1.1 Absolute return
Absolute return is the return an investment has during a given period of time. The time period could be one month, or ten years.
To measure the absolute return of an investment using daily closing prices, we have to geometrically chain the daily returns using the following equation:
𝑅𝑅𝑇𝑇 = �� (1 + 𝑅𝑅𝑡𝑡) 𝑇𝑇
𝑡𝑡=1 � − 1
(2) Where:
• RT = return for period T • Rt = return for period t • t = period
• T = total number of periods
The above equation provides us with a percentage return for the total period defined under T. We use daily returns in the above equation as it provides a more accurate performance calculation. It is often used by finance professionals to calculate performance because it takes into account the compounding effect of returns.
3.1.2 Annualized return
Annualized return provides a per year return. It transforms an absolute return into a per year return while taking into consideration the compounding effect of the investments. Absolute return considers the length of the investment as one period; whereas the annualized return transforms the length of the investment into yearly tranches.
To annualize the return, we use the following equation:
𝑅𝑅𝐴𝐴= (1 + 𝑅𝑅𝑇𝑇)𝑛𝑛�𝑇𝑇− 1 (3)
Where:
• RA = annualized return • RT = return for period T
• n = number of periods in a year • T = total number of period
For our study, we consider “n” to be the number of trading days in a year, which is between 260 and 262 days.
3.2 Risk measures
Even though measuring returns is very important in any performance study, it is very important to take into consideration the level of risk an investor is taking to earn a certain amount of return. As with measuring returns, there are many different
mathematical approaches to calculate risk. Some are more complex than others. In this study, we have decided to concentrate on the measures frequently used throughout the industry.
3.2.1 Annualized volatility
Volatility is “the standard deviation of the continuously compounded returns on the underlying asset” (Institute, 2014). Volatility is considered as the risk linked to a price movement. It is calculated as followed:
𝜎𝜎𝐴𝐴= �∑ (𝑅𝑅𝑡𝑡− 𝑅𝑅�) 2 𝑇𝑇 𝑡𝑡=1 𝑇𝑇 × 𝑛𝑛 (4) Where: • σA = annualized volatility • Rt = return for period t
• n = number of periods in a year • T = total number of period
As it can be seen in the above equation, volatility provides an insight on how far our returns can vary from the arithmetic mean of returns for a given period. High volatility means that an assets price can vary significantly. Low volatility means that there is very little price movement during a period.
Although volatility is often associated with how much money one can lose in a given time period, it should be noted that it also provides an insight on how much we can hope to earn. Volatility measures both upside and downside risk.
3.2.2 Consistency of performance
Although volatility is an interesting measure of risk, it is not enough by itself. It is important to take into account other factors that may not be visible when calculating the volatility. We decided to analyze how many months had a positive return over a given period. When we compare the percentage of positive months with the absolute return and with the volatility, we can see if the analyzed investment has one of the three below profiles:
• many small negative returns and a few very positive returns • even amounts of negative and positive returns
3.2.3 Maximum drawdown and time to recovery
Drawdown is the amount of loss incurred from the highest value and the subsequent lowest value of an investment during a defined period.
𝐷𝐷𝐷𝐷 = 𝐵𝐵𝐵𝐵𝐵𝐵𝐵𝐵𝐵𝐵𝐵𝐵𝑃𝑃𝑃𝑃𝑃𝑃𝑃𝑃 − 1 (5) Where:
• DD = drawdown
• Peak = highest point during the given period
• Bottom = lowest point following the peak during the given period
Maximum drawdown is the biggest Peak to Bottom loss incurred during a given period. It is a downside risk measure that provides some insight into how much an investor can expect to losing during any given time.
Even though maximum drawdown is a very interesting ratio, by itself it does not provide enough information. The time to recovery should also be taken into consideration. Time to recover is the amount of days, months or years it takes an investment to recover from its drawdown and get back to its Peak value.
3.2.4 Sharpe ratio
One relative performance measure widely used is the Sharpe ratio (Sharpe, 1966). The Sharpe ratio is the relative return of an asset divided by its standard deviation. The relative return is calculated by subtracting the risk-free rate of return from the portfolio return:
𝑆𝑆ℎ𝑃𝑃𝑎𝑎𝑎𝑎𝑃𝑃 𝑅𝑅𝑃𝑃𝐵𝐵𝑅𝑅𝐵𝐵 = 𝑅𝑅𝑝𝑝− 𝑅𝑅𝜎𝜎 𝑟𝑟𝑟𝑟
𝑝𝑝 (6)
Where:
• Rp = portfolio’s return • Rrf = risk-free rate of return • σp = portfolio’s standard deviation
The risk-free rate is the rate of return one can expect to receive from a non-risky asset. In most cases, one month or three month United States Treasury Bills or London Interbank Offered Rate (LIBOR) is used as the risk-free rate.
The Sharpe ratio indicates the amount of risk taken to provide one unit of relative return.
4. Analysis of Sharia-Compliant Investments
To test the potential of Sharia-compliant investments, we elected to analyze the market as a whole. As explained previously, we were able to find equivalent instruments to most traditional investments.
Table 2 - Conventional and Sharia-Compliant Asset Allocation
Conventional
Sharia-Compliant
Cash & Cash equivalent Murabahah account
Fixed Income Sukuk
Equities Equities
Alternative investment Alternative investment
Source: original content
The above table indicates the different investment categories used in conventional portfolio management and their Sharia-compliant equivalent.
As we wanted to quantify the potential of being Sharia-compliant for a typical investor, we looked into the performance and associated risks of equity and fixed income markets. As with most cases in finance, studying the risk and return profiles of an investment does not provide sufficient information; for that reason, we compared Sharia-compliant indices with conventional indices of similar construction as most people are familiar with the latter.
4.1 Index Selection
Indices are simulated portfolios of securities used to represent a market or a small segment of a market. There are many different indices with various construction methodologies. To analyze the equities market, we have decided to concentrate on three regions:
• Global
• United States of America • Europe
We have chosen the above three regions as they cover the markets individual investors are most likely to enter. The Global index provides analyzable data on the equities market as a whole, whereas the United States of America and Europe include the most traded securities.
We have chosen the most used indices in the world. They are the premiere benchmarks per region.
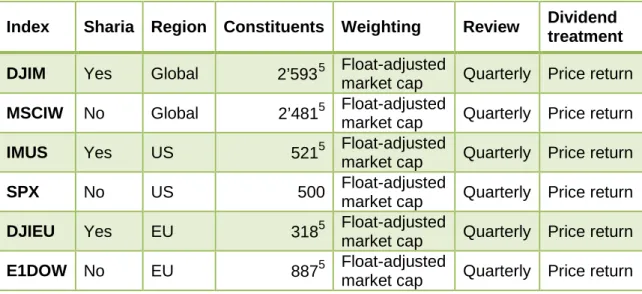
Table 3 – Equity Index Characteristics
Index Sharia Region Constituents Weighting Review Dividend
treatment
DJIM Yes Global 2’5935 Float-adjusted
market cap Quarterly Price return
MSCIW No Global 2’4815 Float-adjusted
market cap Quarterly Price return
IMUS Yes US 5215 Float-adjusted
market cap Quarterly Price return
SPX No US 500 Float-adjusted
market cap Quarterly Price return
DJIEU Yes EU 3185 Float-adjusted
market cap Quarterly Price return
E1DOW No EU 8875 Float-adjusted
market cap Quarterly Price return
Source: adapted from June 2016 factsheets
The above table lists the various indices we have selected for our analysis. We have taken two indices per region, one sharia-compliant and one conventional. The indices selected all use a float-adjusted market capitalization weighting of their constituents. We have selected to use price return instead of total return strategies. Selecting indices with the same weighting methodology and dividend treatment was very important for comparability.
For the fixed income securities, we focused our efforts on two global indices, one Sharia-compliant and one conventional.
Table 4 - Fixed Income Index Characteristics
Index Sharia Region Constituents Weighting Review Dividend
treatment
DJSUKUK YES Global 71 Market Value Monthly Total return
LBUSTRUU No Global 9’977 Market Value Monthly Total return
Source: adapted from July 2016 factsheets
Total return indices use income generated by the underlying securities, such as interest payments, to reinvest in the same index. We believe it is important to analyze fixed income indices on a total return basis as the interest payments are an integral part of the investment instrument.
5
Number of constituents according to June 2016 Factsheets. Constituents’ number can vary following a quarterly review.
4.2 Data collection and processing
After selecting the various indices we wanted to include in our study, we started gathering the required data. The first step was to extract the historic prices from a Bloomberg Terminal. The terminal provides a variety of financial data. An Excel plug-in was used to extract closing prices for the indices we were analyzing.
For the equities portion, we decided to start our analysis as of January 1st 2003. Data was available for earlier periods, but we decided to start our analysis following the Dot Com bubble of 2000. Following the bubble, the markets crashed in early 2000 and bottomed out between late 2002 and early 2003.
We wanted to use data that had the recovery following the crash as a starting point. We would be able to see how each index recovered, and how it reacted during the financial crisis that followed the Subprime bubble of 2007 and the recovery that followed.
As for the fixed income indices, we used January 1st 2006 for the start of our analysis window. The first value available for the DJSUKUK index was September 30th 2005. To facilitate our performance and risk analysis, we decided to use the beginning of the year as our starting point.
For both the equities and fixed income indices, we used June 30th 2016 as our end date. We used the latest end-of-quarter date available.
When the closing prices for the various indices were collected, we processed the data to make it comparable. Not all indices had the same amount of trading sessions per year due to their regional coverage. For example, DJIM had about 313 trading sessions per year because it traded six days a week over the whole year. We decided to remove all trading days where only one of the six equity indices traded.
To be able to visually compare the different indices more efficiently, we decided to use a base price of USD 100 as of January 1st 2003. To do so, we calculated the daily returns using equation (1). Using the daily returns, we were able to calculate each day’s index level while starting at 100.
4.3 Global equities
It was important to start our analysis on a global scale. The two indices, Dow Jones Islamic Market World index (DJIM) and MSCI All Country World index (MSCIW), we selected would allow us to compare the risk and return profiles of Sharia-compliant and conventional global markets. Following our analysis, we can concentrate on the other two regions to verify our findings.
4.3.1 DJIM: Dow Jones Islamic Market World Index
DJIM is widely used by investment professionals as a benchmark for Sharia-compliant world equities. Dow Jones uses several variables to screen for Sharia-compliant stocks. Below is a list of the main filters used to screen for sharia-compliance, as stated on Dow Jones’ website:
“Industry Screens: o Alcohol
o Pork-related products
o Conventional financial services o Entertainment
o Tobacco
o Weapons and defense Financial Ratio Screens:
All of the following must be less than 33%:
o Total debt divided by trailing 24-month average market capitalization o The sum of a company’s cash and interest-bearing securities divided
by trailing 24-month average market capitalization
o Accounts receivables divided by trailing 24-month average market capitalization”
(Dow Jones, 2016)
Dow Jones employs four prominent Islamic scholars on its Sharia Board for advice on the screening process.
4.3.2 MSCIW: MSCI All Country World Index
MSCIW is often used as a benchmark for world equities market; therefore it was the logical index to use. The index has 2’381 constituents from twenty-three developed and twenty-three developing markets; it covers approximately 85% of the global investable equity opportunity set (MSCI ACWI USD Factsheet, June 2016).
4.3.3 Index composition
Both Indices try to provide information on the global market, but due to the Sharia screening done for the DJIM index, we are presented with different country and sector weighting in each index. Below we have a table with the five biggest contributors by country for each index:
Table 5 - Global Equities Country Allocation
Country DJIM Country MSCIW
United States 60.95% United States 53.57%
Japan 6.76% Japan 7.63%
Switzerland 5.11% United Kingdom 6.42%
United Kingdom 4.48% Canada 3.17%
China 2.63% France 3.15%
Other 20.07% Other 26.06%
Source: adapted from June 2016 factsheets
As we can see in the above table, the country distribution is a little different in each index. Firstly, the top five country contributors are not the same in each index. For example, Canada has the fourth highest weighting of 3.17% in the MSCIW index, but it is only eight with 2.20% in the DJIM index.
The differences in the index construction are even more visible in the sector weighting.
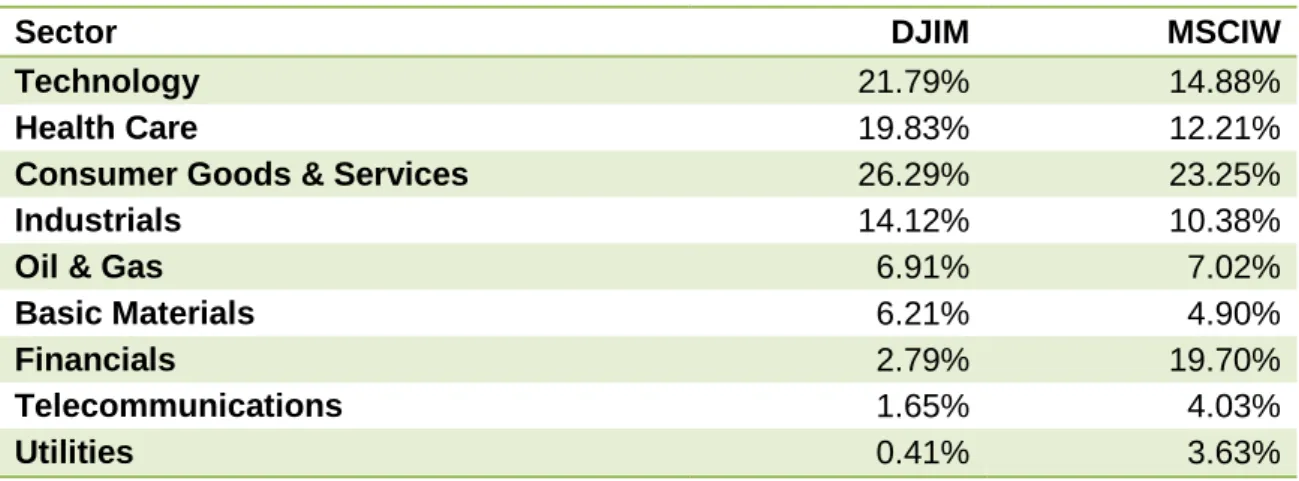
Table 6 - Global Equities Sector Allocation
Sector DJIM MSCIW
Technology 21.79% 14.88%
Health Care 19.83% 12.21%
Consumer Goods & Services 26.29% 23.25%
Industrials 14.12% 10.38%
Oil & Gas 6.91% 7.02%
Basic Materials 6.21% 4.90%
Financials 2.79% 19.70%
Telecommunications 1.65% 4.03%
Utilities 0.41% 3.63%
The biggest difference in the sector distribution can be found under Financials. The industry is under represented in the Sharia-compliant index due to the screening process eliminating all conventional financial institutions due to their non-Sharia-compliant business models.
There are only a few industry sectors that have similar weighting in the indices. If we were to assume that the only difference we have between the two indices is linked to the sector breakdown, then they would share about 77% of the same stocks. However, we can’t make such an assumption as there are other factors that influence each index constructions. But it does demonstrate that both indices have different constituents.
4.3.4 Risk and return profiles
Below we can find a graph of the price evolution of both indices through our analysis window of thirteen and a half years. As mentioned in our data collection and processing, we used a base currency of USD 100 as of January 1st 2003.
Figure 6 - Global Equities Historic Price
Source: adapted from Bloomberg data
We can make several interesting observations from the graphic representation in figure 6. We can observe that both indices are highly correlated over the thirteen and a half window. It is visible that MSCIW had a better recovery period between 2003 and end of 2007. However, DJIM had a better recovery period from 2009. These observations are supported by our index characteristics analysis done earlier. DJIM has a higher weighting in the Technology sector, which explains the tougher recovery period following the Dot Com crash. Moreover, DJIM has a very low weighting in Financials, which explains the better recovery following the financial crisis. Furthermore, the
60 100 140 180 220 260 DJIM MSCIW
screening for companies with high debt in their capital structure favored the conventional index before the 2007-2008 market crash.
4.3.4.1 Annualized returns
We started our analysis by taking a closer look at the return profile of both indices.
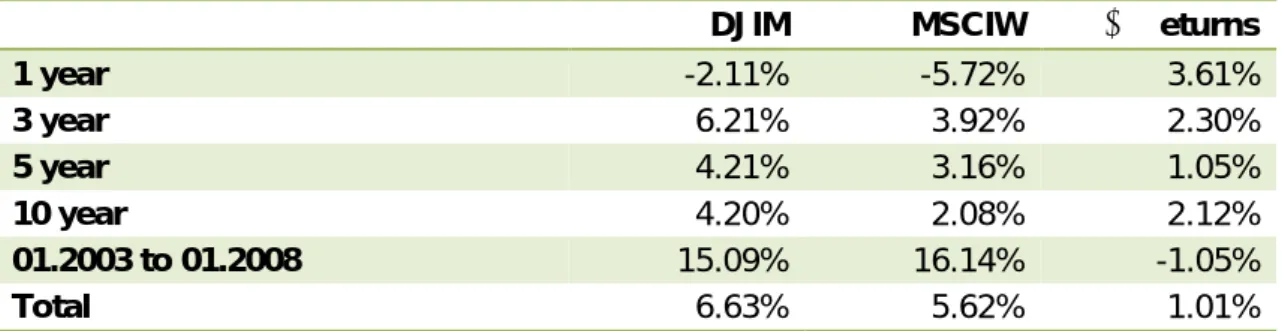
Table 7 - Global Equities Annualized Returns
DJIM MSCIW Δ Returns
1 year -2.11% -5.72% 3.61% 3 year 6.21% 3.92% 2.30% 5 year 4.21% 3.16% 1.05% 10 year 4.20% 2.08% 2.12% 01.2003 to 01.2008 15.09% 16.14% -1.05% Total 6.63% 5.62% 1.01%
Source: adapted from Bloomberg data
In table 7, we have calculated the annualized returns of six time horizons. We used equation (2) to calculate the absolute return over the given time horizons. We then used equation (3) to annualize the returns. Annualized returns should be understood as the average return you would get per year over a given amount of years. For example, for DJIM, if you invested money into DJIM three years ago, then you would have earned an average of 6.21% per year. Using annualized returns allows us to better compare figures as they are displayed as per year returns.
We also added a column with the difference in returns between DJIM and MSCIW. We can clearly see that DJIM had a better return than MSCIW over our sampled period. Only in the five years between January 2003 and end of December 2007 does MSCI have a better return.
4.3.4.2 Annualized volatility
To be able to put the returns demonstrated in table 7 into perspective, we created the below table with the annualized volatility with the same time horizons.
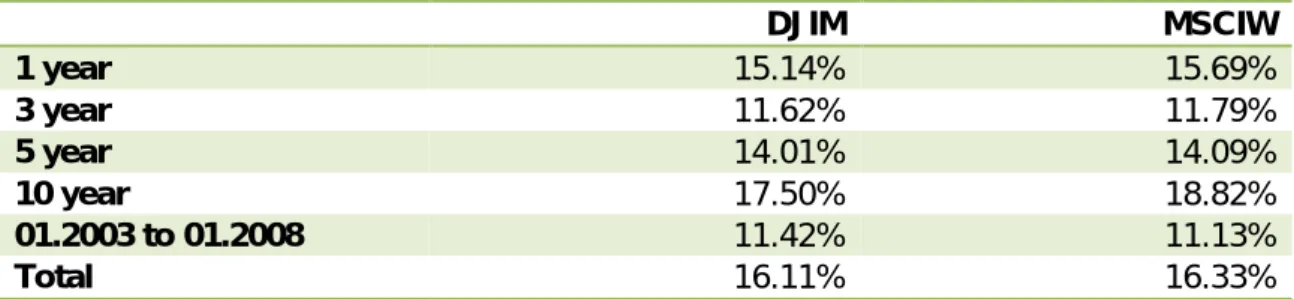
Table 8 - Global Equities Annualized Volatility
DJIM MSCIW 1 year 15.14% 15.69% 3 year 11.62% 11.79% 5 year 14.01% 14.09% 10 year 17.50% 18.82% 01.2003 to 01.2008 11.42% 11.13% Total 16.11% 16.33%
Source: adapted from Bloomberg data
To calculate the annualized volatility per index, we started with the daily returns already calculated. Then we used equation (4) to calculate the annualized volatility per period. We can observe that both indices have a very similar risk profile. These figures are in line with the results we expected.
4.3.4.3 Sharpe ratio
As mentioned before, volatility is associated with the amount of risk taken, but it can also be beneficial. We calculate the Sharpe ratio to know how much risk we are taking per unit of relative return.
We explained that the risk free rate is an important part of the Sharpe ratio. However there are several different rates that can be used and they can change daily. Since we wanted to calculate the Sharpe ratio to compare the risk-return profile of a Sharia-compliant index with a conventional index, we decided to use a risk free rate of 0. Both indices will be using the same rate, so using an assumption where the risk free rate would be 0 will not have any significant impact on our analysis.
Table 9 - Global Equities Sharpe Ratio
DJIM MSCIW 1 year -0.14 -0.36 3 year 1.71 1.04 5 year 0.30 0.22 10 year 0.24 0.11 01.2003 to 01.2008 1.32 1.45 Total 0.41 0.34
Equation (6) was used to calculate the Sharpe ratios in table 9 using annualized daily returns over each time horizon. As explained above, in our calculations, we assumed that Rrf was equal to zero.
Even though the volatility indicated in table 8 is very similar for both indices, DJIM has more favorable risk to return ratios. According to the Sharpe ratio, DJIM has had better returns while taking on the similar amounts of risk.
4.3.4.4 Maximum drawdown and days to recovery
In addition to calculating the risk-reward profiles above, we also took a look at the downside risks for each of the two indices. To do so, we calculated the maximum drawdown for each index, and the trading days to recover all the losses.
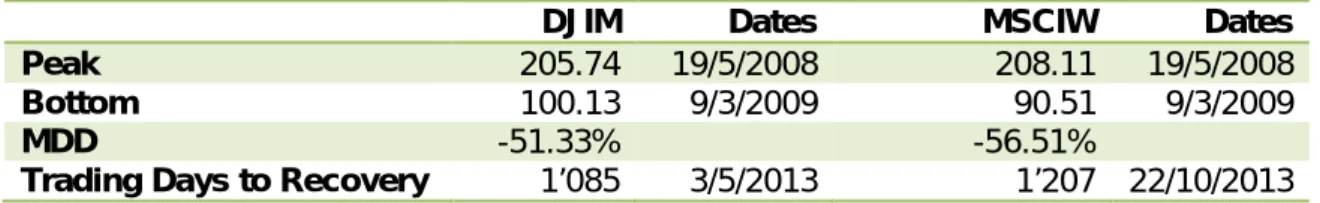
Table 10 - Global Equities Maximum Drawdown and Days to Recovery
DJIM Dates MSCIW Dates
Peak 205.74 19/5/2008 208.11 19/5/2008
Bottom 100.13 9/3/2009 90.51 9/3/2009
MDD -51.33% -56.51%
Trading Days to Recovery 1’085 3/5/2013 1’207 22/10/2013
Source: adapted from Bloomberg data
To calculate the above maximum drawdown figures, we started with calculating a rolling drawdown with a one year window. Our first drawdown window started from January 1st 2003 until December 31st 2003. For each window, we used the last day’s closing price as the Bottom value in equation (5). As for the Peak Value, we used the “max” function present in Microsoft Excel to provide us with the maximum index value during the one year window. In the case where the maximum value during the window is the value used for the Bottom, then the drawdown would equal to 0.
The method discussed above is not the correct way to calculate the drawdown over a given time horizon, as we always use the last day of the drawdown window as the
Bottom value, but because we calculate the drawdown for each day between
December 31st 2003 and June 30th 2016, we are sure to include all possible drawdown figures with a one year window.
After calculating the rolling drawdown, we used the “min” function in Microsoft Excel to find the maximum drawdown of our analysis window. Unsurprisingly, both indices’ maximum drawdown occurred during the recession that followed the Subprime bubble. However, we were a little surprised to see that the Peak dates and the Bottom dates for
both indices are exactly the same. This provides further evidence of some correlation between both indices.
Figure 7 - Global Equities Maximum Drawdown and Time to Recovery
Source: adapted from Bloomberg data
In table 10 and in figure 7 we can clearly see that the Peak and Bottom dates coincide perfectly. However, two differences exist, the percentage of loss and the days to recovery. For the former, MSCIW had a visibly higher loss rate than DJIM. As for the latter, DJIM recovered all of the losses following its maximum drawdown on May 3rd 2013, whereas MSCIW’s recovery took until October 22nd 2013. MSCIW need 122 more trading days to recover from its losses. These two observations demonstrate that MSCIW has a higher down side risk, while taking a longer to recover from the losses. The lower maximum drawdown observed for the Sharia-compliant index can be explained by the Sharia screening done. Firstly, DJIM has little exposure in the Financials sector, which performed very poorly in 2008. Secondly, the screening done for highly leveraged stocks provides a natural safeguard against downside risks. During
80 120 160 200 240 2008 2009 2010 2011 2012 2013
DJIM Peak DJIM Bottom DJIM
Peak Bottom Recovery 80 120 160 200 240 2008 2009 2010 2011 2012 2013
MSCIW Peak MSCIW Bottom MSCIW
Peak
Bottom
market turnarounds, highly leverage companies tend to perform very poorly, which in turn impacts the conventional index.
4.3.4.5 Percentage of positive months
Following our above observations, we decided to have a look at the consistency of the indices’ performance. We were able to observe in Table 7 that both indices have had positive returns in most time horizons, but we wanted to take a closer look at the consistence of these positive returns. We used the same time horizons, but we calculated the percentage of months with positive returns. We used daily returns to calculate the monthly returns with equation (2).
Table 11 - Global Equities Percentage of Postive Months
DJIM MSCIW 1 year 41.67% 33.33% 3 year 52.78% 52.78% 5 year 53.33% 53.33% 10 year 57.50% 54.17% 01.2003 to 01.2008 70.00% 68.33% Total 59.88% 58.02%
Source: adapted from Bloomberg data
We are able to observe that over the 3 year and 5 year horizons, both indices have the exact amount of positive months. This is interesting because both indices have different annualized returns and annualized volatility over the same time horizons. This further supports the theory that both indices are highly, but not completely, correlated. Another interesting observation is that between January 2003 and December 2007, DJIM had a higher percentage of positive months while having a lower annualized return and higher volatility.
4.4 United States equities
Following our analysis of the global equities market, we wanted to examine if we had the same results in the smaller regions. We started with the United States, as it is the biggest capital market in the world. In table 5, we can clearly see that the United States market is highly represented in the Global indices. In the DJIM index, the United States represents about 60.95% of the index, whereas all European countries represent only 19.12% of the index.
4.4.1 IMUS: Dow Jones Islamic Market U.S. Index
IMUS is part of the Dow Jones Islamic Market (DJIM) index family. It uses the same Sharia screening methodology explained earlier. The only difference is that it concentrates only on stocks from the United States. It is used to represent the United States Sharia-compliant equities universe.
4.4.2 SPX: Standard & Poor’s 500
Created in 1957, SPX is widely viewed as the best representation of United States stock market. Therefore, we decided to use it as our conventional U.S. equities benchmark. SPX is composed of 500 companies with the highest market capitalization traded in the United States.
4.4.3 Index composition
Discrepancies in the sector allocation exist due to the Sharia-screening done on the IMUS. This is the same issue presented in point 4.3.3 above.
Table 12 – U.S. Equities Sector Allocation
Sector IMUS SPX
Technology 27.17% 20.60%
Health Care 18.98% 15.10%
Consumer Goods & Services 24.92% 22.50%
Industrials 12.69% 9.90%
Oil & Gas 9.40% 7.00%
Basic Materials 3.48% 2.90%
Financials 3.36% 15.70%
Telecommunications - 2.90%
Utilities - 3.40%
We can see in the table above that some sectors are completely missing from IMUS, such as Telecommunications and Utilities. Furthermore, we can observe that the Technology sector is a higher contributor to the Sharia-compliant index; the same phenomenon was also present in table 6. We can deduct from the above table that the Sharia-compliant index is less diversified across the different sectors. As with all Sharia-compliant indices, the Financials sector is not well represented.
4.4.4 Risk and return profiles
We started our analysis of the United States equities market with a graphical representation of the historic price evolution with a base price of 100 starting in January 2003.
Figure 8 - U.S. Equities Historic Price
Source: adapted from Bloomberg data
In figure 8 above, we could visually see that both indices are highly correlated. The only difference observable is between mid-2007 and end of 2008 where SPX incurred higher losses than IMUS. In 2008 alone, SPX had a return of -38.49% whereas IMUS had a return of -33.32%. As explained in our analysis of the global market, the Sharia-compliant indices performed better during the financial crisis due to their lower exposure to the Financials sector.
4.4.4.1 Sharpe ratio
Our annualized returns and volatility analysis for the United States indices have very similar results as we had for our global indices as can be seen in table 20 and table 21
Error! Reference source not found.in the appendix.
60 100 140 180 220 260 300 IMUS SPX
Table 13 - U.S. Equities Sharpe Ratio IMUS SPX 1 year 0.03 0.10 3 year 2.23 2.28 5 year 0.56 0.62 10 year 0.32 0.23 01.2003 to 01.2008 0.92 0.82 Total 0.42 0.35
Source: adapted from Bloomberg data
However, we could find some small differences between the global analysis and the United States analysis in the Sharpe ratios calculated in table 13. We can observe that over the past five years the conventional index has had better annualized returns than the Sharia-compliant one. The differences can be explained by the better performance of the conventional index during stable and optimistic market conditions.
4.4.4.2 Maximum drawdown and days to recovery
Taking a look at the maximum drawdown and days to recovery, we can observe that IMUS performed better than SPX during the market crash. Furthermore, IMUS was able to recover from its maximum drawdown in a less than two years, whereas SPX needed three and a half years to recover. The difference of 406 trading days in recovery time is very significant from an investor’s point of view; in particular when we factor in the loss of about 50% during a period of less than a year.
Table 14 - U.S. Equities Maximum Drawdown and Days to Recovery
IMUS Dates SPX Dates
Peak 180.19 19/5/2008 162.15 19/5/2008
Bottom 97.02 9/3/2009 76.89 9/3/2009
MDD -46.16% -52.58%
Trading Days to Recovery 508 16/2/2011 914 6/9/2012
Figure 9 - U.S. Equities Maximum Drawdown and Time to Recovery
Source: adapted from Bloomberg data
Our observations are further emphasized in our graphical representation in figure 9. We could clearly see that the time to recovery is significantly longer for SPX. However, it is important to note that the recovery period for both United States indices was quicker than for both global indices observed earlier.
4.5 European equities
European equities are the second biggest contributors to the DJIM index, and the second biggest capital market in the world. We decided to concentrate our analysis of the European equities market on two indices provided by Dow Jones.
4.5.1 DJIEU: Dow Jones Islamic Market Europe Index
As with the two previous Sharia-compliant indices presented, DJIEU screens the European stock market for Sharia-compliant companies. The European equities
60 80 100 120 140 160 180 200 2008 2009 2010 2011 2012
IMUS Peak IMUS Bottom IMUS
Peak Bottom Recovery 60 80 100 120 140 160 180 200 2008 2009 2010 2011 2012 SPX Peak SPX Bottom SPX Peak Bottom Recovery
universe included in the index is smaller than the two previous indices. This is in line with the country allocation discussed earlier.
4.5.2 E1DOW: Dow Jones Europe Index
Dow Jones provides numerous indices with size and industry segmentation. We used the global European index that represents approximately 95% of Europe’s total market capitalization.
4.5.3 Index comparison
Our analyses of the European equities were very similar to our previous analysis, as can be seen in the various tables in the appendix. Visually, we can observe in figure 10 below that the European equities have had a historic price movement very similar to that of the Global market.
Figure 10 - European Equities Historic Price
Source: adapted from Bloomberg data
The only notably difference between the European market and the two others analyzed earlier is the maximum drawdown, or more precisely, the time to recovery. The conventional index, E1DOW, has yet to recover from its highs of 2007-2008. On the other hand, the Sharia-compliant index did recover, though barely, from its maximum drawdown on the April 30th 2014.
60 100 140 180 220 260 DJIEU E1DOW
4.6 Fixed Income
As presented in our study in the previous chapters, Sukuk certificates are in nature very distinct from conventional fixed income. They are structured very differently and they have differences in risk factors.
However, we wanted to observe if USD denominated Sukuk securities are priced similarly to conventional bonds or if they were in fact priced differently by the market. To do so, we decided to observe the risk and return profiles in a similar fashion to our previous analysis of the equities market.
As presented in table 4, we have selected two global indices for our analysis: • DowJones Sukuk Total Return Index (“DJSUKUK”)
• Bloomberg Barclays US Aggregate Index (“LBUSTRUU”)
Both indices cover a global market of USD denominated fixed income securities. To qualify for inclusion in both indices, the securities must have a rating of BBB-/Bbb3 by one of the three top rating agencies: Standard & Poor’s Ratings Service, Moody’s or Fitch.
It is interesting to note the difference in number of constituents. LBUSTRUU has 9’977 securities in the index, while DJSUKUK only has 71. The small figure for the latter demonstrates the young nature of the USD denominated Sukuk securities.
4.6.1 Risk and return profiles
When we first started our analysis of the fixed income indices which we considered for analysis, we didn’t know what to expect: Was there a visible correlation between both indices? When we extracted the historic prices from the Bloomberg Terminal and processed the data to have a base unit of 100 starting in January 2006, we were surprised to see that both indices followed a very similar trend.
Figure 11 - Fixed Income Historic Price Gross of Fees
Source: adapted from Bloomberg data
From the graphical representation of the performance over the past ten and a half years in figure 11 above, we can observe two things. Firstly, the Sharia-compliant index has had a more dramatic drop in value between 2008 and 2009. Secondly, the conventional bonds have slightly higher returns between 2010 and June 2016.
Table 15 - Fixed Income Annualized Returns and Volatility Gross of Fees
DJSUKUK LBUSTRUU
Returns Volatility Returns Volatility
1 year 4.36% 1.57% 6.00% 3.34%
3 year 4.80% 1.66% 4.06% 3.32%
5 year 4.42% 1.82% 3.76% 3.24%
Total 4.54% 7.12% 4.79% 3.74%
Source: adapted from Bloomberg data
Our observations are further confirmed by the annualized returns calculated in table 15. We can clearly see that DJSUKUK has a better three and five year return profiles than LBUSTRUU. Moreover, we can also see that DJSUKUK has lower annualized volatility over the same periods.
The annualized volatility of DJSUKUK is higher over the ten and a half years due to extreme volatility in 2008 and 2009 as can be observed in table 25 in the annex. In 2008, the Sharia-compliant index suffered losses of 18.73% but was able to quickly recover in 2009. 80 100 120 140 160 180 DJSUKUK LBUSTRUU
To further our analysis, we decided to take into consideration the additional fees that Sukuk investments often entail. We mentioned earlier that Sukuk usually involve additional costs due to their complex and non-standardized structures. To examine the impact of these higher charges, we decided to simulate a 1% per annum transaction fee on the DJSUKUK index paid daily. On average, we had 259.1 trading days in our data set consequently we charged approximately 0.00384% per day.
Figure 12 - Fixed Income Historic Price Net of Fees
Source: adapted from Bloomberg data
We can clearly see in figure 12 above that the 1% per annum fee we included has an adverse effect on the price movement of the Sharia-compliant index. The extra charges are further emphasized in the annualized returns presented in table 16 below. Whereas the returns over the past five years were higher for DJSUKUK on a gross of fees basis, we can observe that following the inclusion of the fees, LBUSTRUU performs better over the observed period.
Table 16 - Fixed Income Annualized Returns and Volatility Net of Fees
DJSUKUK LBUSTRUU
Returns Volatility Returns Volatility
1 year 3.33% 1.57% 6.00% 3.34%
3 year 3.76% 1.66% 4.06% 3.32%
5 year 3.39% 1.82% 3.76% 3.24%
Total 3.50% 7.12% 4.79% 3.74%
Source: adapted from Bloomberg data 80 100 120 140 160 180 DJSUKUK LBUSTRUU