HAL Id: inserm-00651122
https://www.hal.inserm.fr/inserm-00651122
Submitted on 12 Dec 2011
HAL is a multi-disciplinary open access
archive for the deposit and dissemination of
sci-entific research documents, whether they are
pub-lished or not. The documents may come from
teaching and research institutions in France or
abroad, or from public or private research centers.
L’archive ouverte pluridisciplinaire HAL, est
destinée au dépôt et à la diffusion de documents
scientifiques de niveau recherche, publiés ou non,
émanant des établissements d’enseignement et de
recherche français ou étrangers, des laboratoires
publics ou privés.
The ancient mammalian KRAB zinc finger gene cluster
on human chromosome 8q24.3 illustrates principles of
C2H2 zinc finger evolution associated with unique
expression profiles in human tissues.
Peter Lorenz, Sabine Dietmann, Thomas Wilhelm, Dirk Koczan, Sandra
Autran, Sophie Gad, Gaiping Wen, Guohui Ding, Yixue Li, Marie-Françoise
Rousseau-Merck, et al.
To cite this version:
Peter Lorenz, Sabine Dietmann, Thomas Wilhelm, Dirk Koczan, Sandra Autran, et al.. The ancient
mammalian KRAB zinc finger gene cluster on human chromosome 8q24.3 illustrates principles of C2H2
zinc finger evolution associated with unique expression profiles in human tissues.. BMC Genomics,
BioMed Central, 2010, 11 (1), pp.206. �10.1186/1471-2164-11-206�. �inserm-00651122�
Lorenz et al. BMC Genomics 2010, 11:206
http://www.biomedcentral.com/1471-2164/11/206
Open Access
R E S E A R C H A R T I C L E
© 2010 Lorenz et al; licensee BioMed Central Ltd. This is an Open Access article distributed under the terms of the Creative Commons Attribution License (http://creativecommons.org/licenses/by/2.0), which permits unrestricted use, distribution, and reproduction in any medium, provided the original work is properly cited.
Research article
The ancient mammalian KRAB zinc finger gene
cluster on human chromosome 8q24.3 illustrates
principles of C2H2 zinc finger evolution associated
with unique expression profiles in human tissues
Peter Lorenz
1, Sabine Dietmann
2, Thomas Wilhelm
3, Dirk Koczan
1, Sandra Autran
4, Sophie Gad
5, Gaiping Wen
6,7,
Guohui Ding
8, Yixue Li
8, Marie-Françoise Rousseau-Merck
4and Hans-Juergen Thiesen*
1Abstract
Background: Expansion of multi-C2H2 domain zinc finger (ZNF) genes, including the Krüppel-associated box (KRAB) subfamily, paralleled the evolution of tetrapodes, particularly in mammalian lineages. Advances in their cataloging and characterization suggest that the functions of the KRAB-ZNF gene family contributed to mammalian speciation. Results: Here, we characterized the human 8q24.3 ZNF cluster on the genomic, the phylogenetic, the structural and the transcriptome level. Six (ZNF7, ZNF34, ZNF250, ZNF251, ZNF252, ZNF517) of the seven locus members contain exons encoding KRAB domains, one (ZNF16) does not. They form a paralog group in which the encoded KRAB and ZNF protein domains generally share more similarities with each other than with other members of the human ZNF superfamily. The closest relatives with respect to their DNA-binding domain were ZNF7 and ZNF251. The analysis of orthologs in therian mammalian species revealed strong conservation and purifying selection of the KRAB-A and zinc finger domains. These findings underscore structural/functional constraints during evolution. Gene losses in the murine lineage (ZNF16, ZNF34, ZNF252, ZNF517) and potential protein truncations in primates (ZNF252) illustrate ongoing speciation processes. Tissue expression profiling by quantitative real-time PCR showed similar but distinct patterns for all tested ZNF genes with the most prominent expression in fetal brain. Based on accompanying expression signatures in twenty-six other human tissues ZNF34 and ZNF250 revealed the closest expression profiles. Together, the 8q24.3 ZNF genes can be assigned to a cerebellum, a testis or a prostate/thyroid subgroup. These results are consistent with potential functions of the ZNF genes in morphogenesis and differentiation. Promoter regions of the seven 8q24.3 ZNF genes display common characteristics like missing TATA-box, CpG island-association and
transcription factor binding site (TFBS) modules. Common TFBS modules partly explain the observed expression pattern similarities.
Conclusions: The ZNF genes at human 8q24.3 form a relatively old mammalian paralog group conserved in eutherian mammals for at least 130 million years. The members persisted after initial duplications by undergoing
subfunctionalizations in their expression patterns and target site recognition. KRAB-ZNF mediated repression of transcription might have shaped organogenesis in mammalian ontogeny.
Background
Evolution of tetrapodes coincides with the expansion of Krüppel-type C2H2 zinc finger (ZNF) genes leading to the largest gene family involved in transcriptional gene
regula-tion [1-7]. Members of the most prominent subfamily con-tain the Krüppel-associated box (KRAB) transcriptional repressor domain at their N-terminus [8-10]. The Krüppel-type zinc finger domain was originally identified in Xeno-pus laevis TFIIIA [11] and the Krüppel mutant of Droso-phila melanogaster [12]. It is known as nucleic acid interaction domain but can also contribute to protein-pro-* Correspondence: [email protected]
1 Institute of Immunology, University of Rostock, Schillingallee 70, 18055 Rostock, Germany
Lorenz et al. BMC Genomics 2010, 11:206
http://www.biomedcentral.com/1471-2164/11/206
Page 2 of 30
tein interactions [13-16]. The classical zinc finger fold con-sists of an approximately 30-amino acid unit of two antiparallel β strands linked to an amphipathic α-helix with two cysteines and two histidines coordinating a zinc ion to stabilize the structure [17]. DNA-binding-specificity relies on amino acids within the α-helix reaching into the major groove of DNA [18]. According to the crystal structure of DNA bound EGR1/Zif268, the residues most crucial for DNA binding are localized at positions -1, 3 and 6 with respect to the start of the α-helix. Position 2 is also involved in DNA binding, but makes contact to the complementary strand [13]. Zinc finger domains usually occur in arrays of multiple C2H2 zinc finger modules comprising from only a few up to more than thirty units [19]. The individual units are separated by a conserved sequence (consensus TGEKP) called HC link.
The KRAB domain was originally described as heptad repeat of leucines in KOX1/ZNF10 [8] and shown to be evolutionarily conserved [9], for review see [20]. The KRAB domain of KOX1 consists of a KRAB-A and a KRAB-B subdomain of which the KRAB-A subdomain mediates transcriptional repression [21-23] and the B part enhances the repression in conjunction with KRAB- KRAB-A [24]. Later on, different KRKRAB-AB-B subdomains with dif-ferent properties have been discovered [19,25,4]. The KRAB domain, early postulated as a protein-protein inter-action domain [8], has been shown to interact with the RBCC domain of TRIM28 (tripartite motif-containing 28, also known as KAP-1, KRIP-1, TIF1β; reviewed in [20]). This protein is considered essential for KRAB-mediated transcriptional repression and recruits various chromatin-modifying protein complexes, thus leading to a repressive chromatin state [26-28]. It is most likely that all KRAB C2H2 zinc finger proteins mediate transcriptional repres-sion in a sequence-specific manner. It is currently unre-solved how many target genes are regulated by an individual KRAB zinc finger protein. In case of KOX1/ ZNF10, initial knockdown experiments with KOX1 spe-cific antisense oligonucleotides combined with transcrip-tome analysis argued that a KRAB-ZNF protein might modulate the expression of 50 to 80 target genes in a direct or indirect manner [29].
Interestingly, functions of most KRAB-ZNF genes remain elusive so far. Recent reports showed evidence that KRAB-ZNF genes and TRIM28 are involved in differentia-tion and development [30-35]. Furthermore, genetic studies linked members of the KRAB-ZNF family to human dis-ease [36-39].
The PFAM protein family database states that KRAB-ZNF genes occur in all tetrapodes from amphibians to birds and in all mammalian species (see http://pfam.sanger.ac.uk/ family?entry=krab&type=Family), whereas fish species like Fugu do not appear to encode any KRAB-ZNF genes [3,6]. Noteworthy, less than 20 KRAB-ZNF genes are
found in the genome of amphibians (Xenopus laevis/tropi-calis) compared with the human genome for which compre-hensive studies list 300-400 KRAB-ZNF protein-coding genes [4,5,40,6]. Thus, KRAB-zinc finger genes presum-ably coevolved with or occurred shortly after the appear-ance of tetrapodes and underwent a huge expansion during mammalian evolution. It was hypothesized that KRAB-like sequences in the histone methyltransferase Meisetz date the origin of this domain back to the last common ancestor of chordates and echinoderms [41]. However, this KRAB-like domain is closely related to the KRAB-like domain of the SSX proteins that does not interact with TRIM28 and con-sequently does not initiate transcriptional repression [42].
Initial mapping data on KOX zinc finger genes already indicated that most ZNF genes are clustered in the human genome [43]. This was confirmed by detection of 23 chro-mosomal KOX gene ZNF loci [44]. Numerous ZNF gene clusters have been defined over the years [45-48,3,49] and catalogued to a total of about 60-90 genomic loci [4,5,40], depending on definition. Diversification of ZNF genes dur-ing evolution is reflected by duplication and deletion of zinc finger domains thereby modifying recognition speci-ficities for RNA/DNA binding [50,2,51]. Individual degen-erate non-functional zinc finger domains do occur within a sequence as well as after truncation by introduction of an in-frame stop codon (reviewed for KRAB-ZNFs in [52]). Lineage-specific expansions and losses within ZNF clusters contribute to evolutionary adaptation [2,3,49,51,5,6].
In this manuscript we focus on the human ZNF cluster at 8q24.3 that had not been investigated in detail. It was cho-sen because of the precho-sence of several KOX ZNF genes (ZNF7/KOX4, ZNF16/KOX9 and ZNF34/KOX32) for which we have a longstanding interest [44]. We sequenced the locus as part of the german HUGO initiative on chromo-some 8 and identified seven ZNF genes. These genes form a paralog group well separated from other ZNF subfamilies. We show here that subfunctionalization of the individual members occurred through the modification of structural properties (KRAB protein interaction domain; ZNF DNA binding domain) as well as through fine-tuned tissue expression patterns. Phylogenetic analysis in several mam-malian species indicated strong conservation and purifying selection of the KRAB and ZNF domains of these genes on one hand. On the other hand, gene loss and potential protein truncations in some species also denoted ongoing evolu-tion. RNA expression was found to prevail in tissues with high degree of differentiation, most notably in fetal brain. Our investigation of the human 8q24.3 ZNF locus illus-trates principles of ZNF gene evolution. The ZNF gene family provides a rich repertoire of transcription factors with distinct RNA/DNA binding specificities. In particular ZNF genes encoding the KRAB transcriptional repression domain represent a great regulatory potential to tune
Lorenz et al. BMC Genomics 2010, 11:206
http://www.biomedcentral.com/1471-2164/11/206
Page 3 of 30
expression of numerous target genes thus contributing to the biodiversity seen in tetrapod evolution.
Results
Organization of the ZNF cluster at chromosome 8q24.3
The ZNF cluster was initially determined by chromosome mapping of sixteen different ZNF PAC clones to genomic locus 8q24.3 of which thirteen were specific for this locus [44] whereas three clones showed signals of comparable intensities on other chromosomes as well. Fluorescence in situ hybridization (FISH) on interphasic nuclei and molecu-lar combing techniques allowed to approximate the size and the organization of the 8q24.3 ZNF cluster. A first approach on interphasic nuclei was employed to select the closer co-localizing PAC clones from the more distant mapping ones. Two Pac clones, RP5-1109M23 and RP4-698E23 were clearly delimiting the borders of the cluster. FISH on combed DNA, performed with two series of three PAC clones, confirmed the close proximity of the ZNF PAC clones all along the cluster and allowed to estimate an approximate size for each probe taking into account a 10% variability for the resolution. Overall alignment lengths of 209 kb and 383 kb were obtained for RP5-1124C13/RP1-291P5/RP4-718C10 and RP5-1109M23/RP4-626A24/RP4-698E23, respectively (Figure 1A).
The 16 different PAC clones were aligned to genomic sequence information confirming that 13 ZNF PAC clones belong to one contig. The sequence of the contig is formed by the PAC clones XX-P7B3, RP4-659B21, RP5-1056B24 and RP5-1109M23 over a total size of 430 kb (Figure 1B). The other nine ZNF PACs cover the same region. Sequence data analysis confirmed the exclusion of the three ambigu-ously mapping PAC clones from the 8q24.3 ZNF contig. The respective lengths of the thirteen overlapping PACs have been established and are in agreement with the data obtained with the combed DNA. The whole 8q24.3 ZNF contig has been filed under GenBank accession number AF235103. Individual sequence information of the PAC clones can also be accessed at the Genome Analysis center in Jena http://genome.imb-jena.de under human chromo-some 8q24.3 locus. The information obtained from sequencing of the PAC clones led to the identification of seven C2H2 Krüppel-type zinc finger genes in the 8q24.3 contig within a distance of nearly 300 kb (Figure 1B). With respect to orientation, two genes, ZNF517 and ZNF7, show a transcriptional direction towards the telomere whereas the five others, namely ZNF251, ZNF34, ZNF250, ZNF16 and ZNF252 are encoded on the complementary strand and are transcribed towards the centromere direction.
Gene models and protein domain organization of the ZNF genes on contig 8q24.3
BLAST analysis of the ZNF sequences against human tran-scribed sequences and ESTs as well as evaluation of the
Acembly and ENSEMBL databases resulted in the defini-tion of transcript sequences for the seven ZNF genes. The focus was the definition of the longest possible open read-ing frame, not takread-ing into account the possibility of differ-ent splice forms. All the gene models together encompass an approximately 282 kB piece of the qter region. The char-acteristics of the ZNF transcripts are given in Table 1. Out of the seven longest open reading frames for each gene five transcripts encode potentially functional Krüppel-associ-ated box (KRAB) domains in the setting KRAB-A and KRAB-B. The comparison of the defined transcripts with the human genome (see Methods section) resulted in the description of the individual genomic organization for each ZNF gene. The individual cDNA sequences of the gene models can be found in the supplementary material (Addi-tional file 1). A common theme among the seven ZNF genes are 5' untranslated exons, the coding of the C2H2 zinc finger modules all in one exon and, in the case of the five KRAB-containing ZNF genes, the typically separated KRAB-A and KRAB-B exons. Concerning ZNF252, we have been able to confirm both transcripts (see Figure 2A), the one with four 5' untranslated upstream exons as well as the one with only one 5' untranslated exon, by RT-PCR with specific primers that resulted in exon spanning products (data not shown). Both transcripts encode the same amino acid sequences from within the last exon. Interestingly, the amino terminus of the largest open reading frame contains a KRAB-B domain disrupted by a stop codon and exon 2 of the 5-exon form encodes a KRAB-A peptide. In between resides an additional exon, unusual for KRAB-ZNF genes. However, there is currently no evidence for a transcript that links KRAB-A and zinc finger domains in the same open reading frame. Noteworthy, the ZNF252 3' untranslated region contains a row of eleven complete as well as degen-erate zinc fingers motifs after the stop codon of the longest open reading frame (see Additional file 2 for sequence). The stop codon is confirmed in the human genome sequence (e.g. in our PAC clone RP5-1109M23 GenBank AC087815), in cDNA and EST sequences (e.g. AK128723, BX505655, CD251662).
Searches for further KRAB-A, KRAB-B and C2H2 sequences on contig AF235103, besides the ones in the above described genes, revealed (Figure 1B) a pseudogene with potentially a complete set of KRAB-A, KRAB-B and zinc finger sequences at the centromeric end of the cluster (krab A1, krab B1, pseudo 1), truncated KRAB-A and KRAB-B sequences near each other (krab A2, krab B2), an isolated KRAB-B sequence (krab B3) and zinc finger sequences at the telomeric end of the cluster (pseudo 2). With the exception of krabA1 and krabB1, all these sequences are characterized by numerous stop codons and degenerate domain structure (nucleic acid sequences included in Additional file 1).
Lorenz et al. BMC Genomics 2010, 11:206
http://www.biomedcentral.com/1471-2164/11/206
Page 4 of 30
Figure 1 Genomic organization of the human ZNF cluster at chromosomal region 8q24.3 and its syntenic regions in mouse and rat. A. FISH
of ZNF gene PAC clones on combed DNA. Orientation is given by indicating the centromeric (centr) and telomeric (tel) directions. Numbers on the depicted DNA indicate sizes within the piece of combed DNA. B. Map of the sequenced individual PAC clones at the 8q24.3-8qter locus (open bars) and their alignment/assembly within the whole contig (genomic assemblies with respective GenBank accessions shown as grey bars). Range, size and chromosomal position of the whole contig is reflected in the depicted chromosomal region on top. The ZNF gene models (see Table 1, Figure 2 and text) are indicated as colored boxes encompassing the sequence stretch from first to last exon. Genomic regions syntenic to human 8q24.3 in mouse and rat are depicted at the bottom. Same coloring designates orthologs. The three human genes depicted in black lack orthologs in mouse and rat (exception: presumable KRAB-B remnant of ZNF252 ortholog in rat, see text). Isolated, often degenerate sequences for KRAB-A ("pin" with square head), KRAB-B ("pin" with round head) and C2H2 zinc fingers (open rectangle with label "pseudo") are displayed at their respective position. Two other well characterized genes (RPL8, COMMD5) in the region are shown by striped boxes. The coding strand of each element is indicated by positioning above or below the depicted chromosomal region. Based on genome assemblies UCSC hg18 (human), mm9 (mouse) and rn4 (rat).
71 193 273 383 kb RP1-291P5 RP4-718C10 209 kb 209 kb 127 127 106 106 40 40 169169 tel tel centr centr
A
RP5-1124C13 RP1-291P5 RP4-718C10 RP5-1109M23 RP4-626A24 RP4-698E23 AF235103 RP5-1109M23 RP5-1124C13 RP5-1111B24 RP5-1047A19 RP4-718C10 RP4-626A24 RP4-686B16 RP1-291P5 RP4-659B21 RP1-316H24 RP5-1056B24 AF186192 RP4-698E23 XX-P7B3Zinc finger gene cluster at 8q24.3-8qter
B
146.2 146.1 146.0 145.9 ZNF251 ZNF34 ZNF517 ZNF7 ZNF250 ZNF16 ZNF252 Mb tel centr RPL8 COMMD5 77.2 76.8 76.7 76.6 Mb tel centr8
15
Human Mouse ZNF251/Zfp251 ZNF7/Zfp7 ZNF250/Zfp647ZNF16 pseudogene RPL8 COMMD5 115.1 114.8 Mb tel centr7
Rat krab A1 krab B1 pseudo 1 krab A2 krab B3 pseudo 2 krab B2 115.0 114.9 ZNF251 ZNF7 ZNF250 ZNF16 pseudogene RPL8 COMMD5 “rnZNF252 krab B”Lorenz et al. BMC Genomics 2010, 11:206
http://www.biomedcentral.com/1471-2164/11/206
Page 5 of 30
The domain organization of the proteins predicted from the gene models is presented in Figure 2B (see Additional file 2 for amino acid sequences). The KRAB-A and -B boxes of the five KRAB zinc finger proteins are located near the amino terminus followed by non-conserved linker sequences and numerous C2H2 zinc finger modules. Most of them are in a consecutive order joined by the conserved HC link sequences and equipped with the two cysteines and two histidines in the correct spacing. In some circumstances the consecutive zinc finger array is broken by gaps, e.g in the case of ZNF251, in such a way that the twelfth finger is isolated. In addition, some motifs are more degenerated, i.e. they lack one of the hallmark cysteine or histidine amino acid residues at the right position or are not complete (see e.g. ZNF7). Comparison of the KRAB-B domains of the 8q24.3 ZNF proteins to several other KRAB-B domains defining the KRAB AB or Ab subfamilies [19] clearly indi-cated that they belong to the KRAB AB subfamily (data not shown). ZNF252 and the KRAB-less ZNF16 are character-ized by considerable stretches of peptide sequence without known conserved domain at the amino terminus followed by consecutive zinc finger arrays of seventeen or eleven zinc fingers, respectively.
Phylogeny of the ZNF genes in the human 8q24.3 cluster in mammals
As a first step to analyze evolutionary conservation of the human 8q24.3 locus we searched for orthologs in other mammalian species by reciprocal BLAST searches and inspection of the syntenic regions. The region syntenic to human 8q24.3 (AF235103) in chimpanzee (Pan troglo-dytes, PanTro2) contains all seven ZNF genes defined in the human and spans about 355 kB on chromosome 8 (bases 149.153.255-149.508.639; still numerous gaps). The gene structures of the chimpanzee ZNF orthologs are identical to the human ones. As expected sequence similarities between the human and chimpanzee orthologs are very high, ranging from 96 to 99% identity on the amino acid level (data not shown).
The murine syntenic regions of the human 8q24.3 ZNF region are on mouse chromosome 15 between approxi-mately 76.682 and 76.766 Mb and on rat chromosome 7 between approximately 114.897 and 114.983 Mb. Using various search tools like BLAST, BLAT and the ENSEMBL database (as described in Material and Meth-ods) and the human sequences as input, we were able to define three likely functional orthologs for the human ZNF genes from 8q24.3 in mouse and rat (Figures 1B, 2C). The mouse genes were well supported by cDNA and EST sequences. With the help of the mouse sequences we defined the corresponding rat orthologs from genomic sequences and adjusted the predicted gene models in Gen-Bank for further phylogenetic examinations (see below). The rat gene models have the disadvantage not to be built
on cDNA sequences due to the rat cDNA/EST databases being far less comprehensive in comparison to mouse or human. The nucleotide and peptide sequences we intro-duced in the analysis are again given in Additional files 1 and 2 and cornerstones of mouse/rat 8q24.3 ZNF orthologs are summarized in Additional file 3.
The three mouse and rat ZNF genes in the syntenic region of human 8q24.3 are all KRAB-A and -B box-containing genes. Like in human, KRAB-A and KRAB-B as well as the C2H2 coding genomic sequences are organized in sepa-rate exons. Gene organization and protein structure (Figure 2B, D) clearly reflect the closely related mouse/rat ortholog pairs and also correspond to the human ortholog. In addi-tion to the three funcaddi-tional ZNF genes we found sequences homologous to human ZNF16 in the mouse and rat regions syntenic to human 8q24.3 by BLAT searches and HMMER search of C2H2 domains: There are continuous stretches on the reverse strand of the respective chromosome that are homologous to sequences of the zinc finger exon of ZNF16. If translated, the mouse as well as the rat genomic pieces would result in "broken" protein sequences of canonical mixed with degenerate C2H2 zinc fingers, disrupted by stop codons and jumping between reading frames. These findings support the notion, that the ZNF16 relatives in mouse and rat are pseudogenes without functional polypep-tides. HMMER searches did not unravel any other KRAB box or C2H2 zinc finger fragments in these mouse and rat genomic regions syntenic to human 8q24.3. The only exception was an isolated sequence at the 3'-end of the ZNF locus in the rat genome that would potentially encode KRAB-B-like amino acid sequences. Since the best hit was the dog ZNF252 KRAB-B box using BLASTp against mammalian sequences, this might be the rat remnant of ZNF252 (designation "rnZNF252_krab_B"; see Figure 1B; sequences in Additional files 1, 2). Interestingly, it resides on the opposite strand with respect to the ZNF16 pseudo-gene. Because of its shortness the sequence was not included in further analyses.
Comparison of locus organization in mouse/rat and human shows that the mouse/rat region encompassed by the conserved non-ZNF genes RPL8 and COMMD5 is inverted in human such that the two genes reside on the opposite strand with ZNF7 and the human specific ZNF517 in between (Figure 1B).
The phylogenetic analysis was extended to all orthologs of the human 8q24.3 ZNF genes detected in respective genome assemblies of other mammalian species, namely, rhesus monkey, dog, cow and opossum (for nucleotide and amino acid sequences see Additional files 1 and 2; genome assembly references given in Methods). With respect to ZNF16 orthologs, rhesus monkey, dog as well as cow appear to have, like the primates, fully functional genes in contrast to mouse and rat (see above). Since ZNF34, ZNF517 and ZNF252 orthologs are likely to exist in other
Lorenz et a l. BMC Ge nomic s 20 10, 11 :206 htt p :// w w w .b iom e dcentr al. com/147 1-21 64/1 1 /206 Pa g e 6 o
f 30 Table 1: ZNF genes and transcriptsa in the human 8q24.3 ZNF cluster on contig AF235103 (chr 8:145.893.231 -- 146.238.749)
Gene name (HUGO)
Locationb Strand Nucleotide
sequencec RefSeqd Gene IDe ENSEMBL tran-script ID.f No of exons cDNA (bp) Amino acids (aa) Remarks ZNF251 145 917 103 --145 951 786 (34 684 bp) - AK000435 AK091638 XM_291262 BC006258 NM_138367 90987 ENST00000 292562 5 3018 671 KRAB-A KRAB-B ZNF34 145 968 415 --145 983 530 (15 116 bp) - AK096508 AL833814 BC028136 BC004480 NM_030580 80778 ENST00000 343459 6 2830 539 KRAB-A KRAB-B alias Kox32 ZNF517 145 995 065 --146 006 265 (11 201 bp) + AK097278 AK096527 AK131440 XM_291261 AX721108 NM_213605 340385 ENST00000 359971 6 >2536 >527 KRAB-A KRAB-B ZNF7 146 023 815 --146 039 409 (15 595 bp) + M29580 AK096025 NM_003416 7553 ENST00000 325241 5 2345 686 KRAB-A KRAB-B alias: Kox4 ZNF250 146 077 336 --146 097 650 (20 315 bp) - AK054888 BC017091 AK095705 X16282 NM_021061 NM_001103159 58500 ENST00000 292579 6 2168 560 KRAB-A KRAB-B alias: ZNF647 ZNF 16 146 126 577 --146 147 078 (20 502 bp) - BC010996 AK096815 AF244088 X52340 AL834451 NM_006958 NM_001029976 7564 ENST00000 276816 4 >2501 >715 no KRAB alias: Kox9
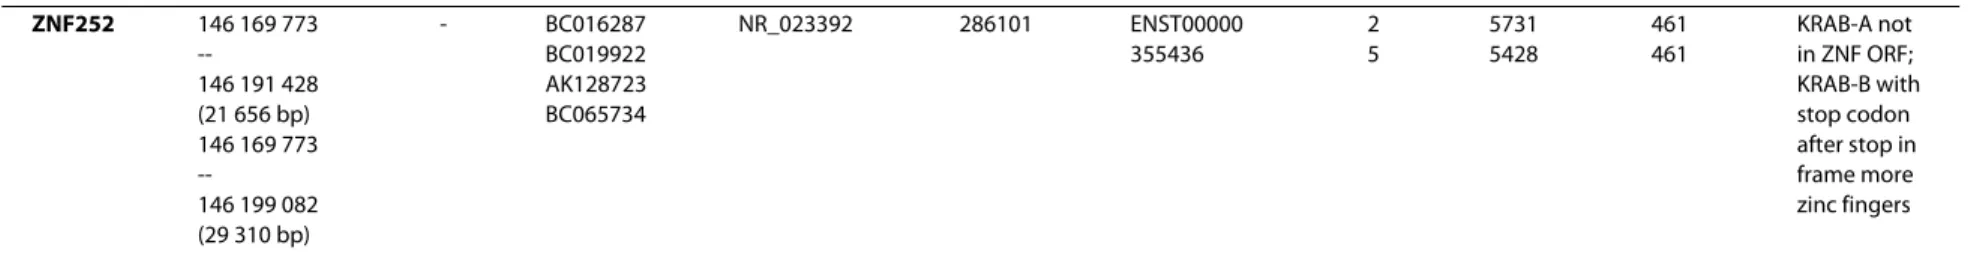
Lorenz et a l. BMC Ge nomic s 20 10, 11 :206 htt p :// w w w .b iom e dcentr al. com/147 1-21 64/1 1 /206 Pa g e 7 o f 30 ZNF252 146 169 773 --146 191 428 (21 656 bp) 146 169 773 --146 199 082 (29 310 bp) - BC016287 BC019922 AK128723 BC065734 NR_023392 286101 ENST00000 355436 2 5 5731 5428 461 461 KRAB-A not in ZNF ORF; KRAB-B with stop codon after stop in frame more zinc fingers
a Description of the largest transcript of the respective gene model
b Chromosomal position according to human genome build hg18 (UCSC browser at http://genome.ucsc.edu; derived from NCBI genome assembly 36.1)
c Selected NCBI GenBank and
d Reference sequence collection accession numbers of representative cDNA/EST sequences
e Entrez GeneID
f Transcript proposed at http://www.ensembl.org
Lorenz et al. BMC Genomics 2010, 11:206
http://www.biomedcentral.com/1471-2164/11/206
Page 8 of 30
mammals (e.g. dog and cow for ZNF34, dog for ZNF517, dog and opossum for ZNF252), it seems that these genes were lost in the murine genomes.
ZNF252 in the evolution of eutheria
The peculiar open reading frame with broken KRAB domain and premature stop codon of human ZNF252 inspired us to carry out a more detailed comparison of the mammalian ZNF252 orthologs (Figure 3). The chimpanzee has the same 5' exon structure as the human ZNF252, i.e. out-of-frame KRAB-A and B exons with an additional exon inserted in between as well as a stop codon. However, the transcript apparently does not even encode any complete C2H2 zinc finger since a stop codon disrupts already the first would-be C2H2 domain between the C2 and H2 parts.
Additional stops can be found just before sequences that would encode zinc fingers 9, 10 and 11. Thus, the chimpan-zee ZNF252 protein, if expressed at all, is devoid of KRAB effector and ZNF DNA binding domains.
By using the tool RepeatMasker (A.F.A. Smit, R. Hubley & P. Green at http://repeatmasker.org) we found sequences homologous to Long and Short Interspersed Elements (LINE/SINE repeats) in the KRAB-A and the following exon and the interjacent intron of the human and chimpan-zee ZNF252 transcripts (data not shown). This raises the possibility, that insertion of repeat sequences was responsi-ble for the frame shift between the KRAB-A and the more downstream protein-encoding sequences. In contrast, the ZNF252 orthologs in rhesus monkey, dog (cDNA experi-mentally defined; GenBank: AJ388557) and opossum
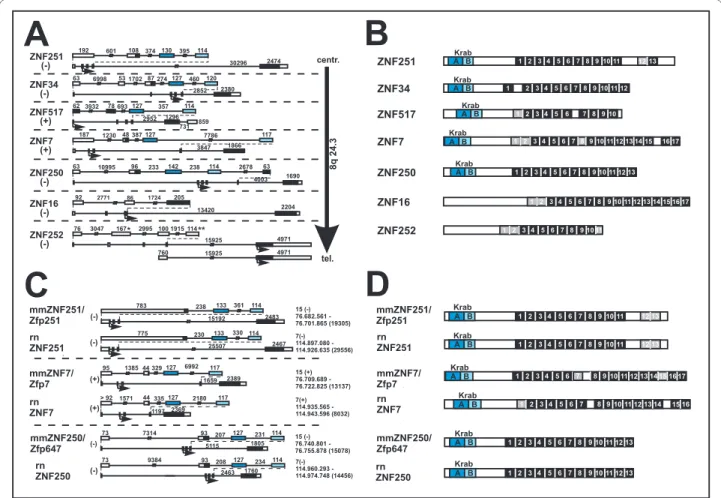
Figure 2 Gene models (A, C) and protein domain organization (B, D) of the seven human ZNF genes at 8q24.3 (A, B) and their murine or-thologs (C, D). In the gene models (A, C) exons are shown as boxes (white parts are untranslated, filled parts are translated), introns as solid lines.
KRAB-A, KRAB-B and non-KRAB domain encoding sequences are shaded in dark blue, light blue and black, respectively. Numbers above exons/introns indi-cate their size (bp). Genes are drawn to scale with smaller exons additionally magnified for more detail. Introns interrupted by two perpendicular bars are not fully drawn out. Names of genes and proteins are given on the left of each model. Mouse and rat orthologs are indicated by prefixes mm (Mus
musculus) or rn (Rattus norvegicus). * in the ZNF252 5-exon model indicates out of frame A coding sequence, ** designates a degenerate
KRAB-B box disrupted by a stop codon. The genes' direction of transcription is given by "+" or "-" (towards telomere or centromere, respectively). Genomic order of the human genes is indicated by the arrow in A. Exact genomic locations are displayed for mouse and rat genes (based on UCSC assemblies mm9 and rn4). Small arrows denote positions of presumable translational starts. Drawn to scale protein architectures (B, D) depict KRAB-A (dark blue), KRAB-B (light blue) and C2H2 ZNF domains (numbered boxes; black boxes represent complete, grey boxes degenerate or non-canonical fingers). Only fingers with at least two of the four conserved C2H2 residues were considered.
Lorenz et al. BMC Genomics 2010, 11:206
http://www.biomedcentral.com/1471-2164/11/206
Page 9 of 30
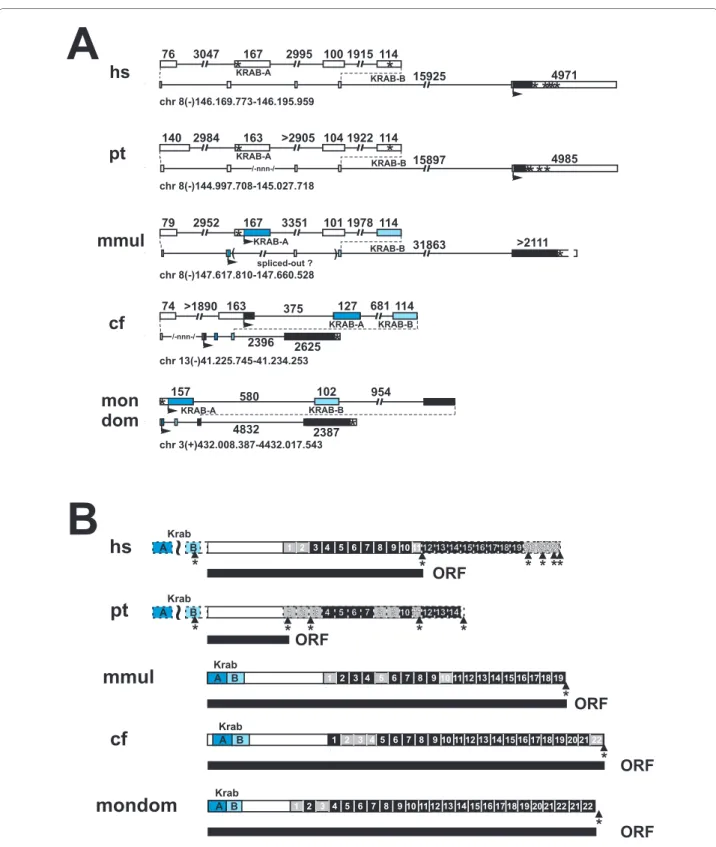
Figure 3 Evolutionary changes in the ZNF252 ortholog group. Gene (A) and protein domain (B) organization depicted for the mammalian
ZNF252 ortholog group (see Additional files 1 and 2 for sequences). For legend see Figure 2. Gaps in the genomic sequence are indicated by --nnn-. An asterisk indicates a stop codon. Dashed lines in (B) illustrate potential coding sequences that are probably untranslated because of stop codons. The tilde denotes a shift in the open reading frame. The presumably longest predicted ORF are shown as black bars under the protein domain depic-tion. Species abbreviations: hs, Homo sapiens; pt, Pan troglodytes; mmul, Macaca mulatta; cf, Canis familiaris; mondom, Monodelphis domestica.
A
hs
1 2 3 4 5 6 7 8 910 11 Krab A B*
*
13 12 14 15 16 17 18 19 20 21 22*
* * *
~
pt
1 2 3 4 5 6 7 8 910 11 Krab A B*
*
13 12 14*
*
*
~
ORF
ORF
mmul
1 2 3 4 5 6 7 8 910 11 Krab A B 121314 15 16 17 18 19* ORF
cf
1 2 3 4 5 6 7 8 910 11 Krab A B 121314 15 16 17 18 19* ORF
20 21 22mondom
1 2 3 4 5 6 7 8 910 11 Krab A B 121314 15 16 17 18 19*
ORF
20 21 22 21 22B
Lorenz et al. BMC Genomics 2010, 11:206
http://www.biomedcentral.com/1471-2164/11/206
Page 10 of 30
clearly harbor a fully developed KRAB-AB domain in the same open reading frame as the zinc fingers. In addition, the zinc fingers of ZNF252 extend to a number of 19-22 without disruption by any stop codon. The unusual addi-tional exon between the KRAB-A and -B exons appears to be primate-specific. In conclusion, ZNF252 is an example for ongoing evolution in the mammalian lineage from fully functional KRAB zinc finger protein (e.g. dog) to residual protein fragment without KRAB and zinc fingers (chimpan-zee) with recent considerable changes occuring after the divergence from the common ancestor of rhesus monkey and human/chimpanzee.
Phylogenetic relationship of the human 8q24.3 cluster ZNF genes
In order to characterize the evolutionary relationships, we constructed phylogenetic trees after alignment of the seven human 8q24.3 ZNF genes along with their mouse and rat predicted orthologs. The analysis also contained the Xeno-pus KRAB-ZNF gene Xfin as outlier and human KRAB zinc finger genes from different genomic locations. The lat-ter included seven ZNFs from locus 19q13.2, recently ana-lyzed in detail [3], as reference group for comparison and in order to assess the stability of resulting clades. Alignments were performed with the cDNA sequences, the total amino acid sequences, the overall zinc finger DNA binding domains and the KRAB effector domains of the proteins. Phylogenetic relationships were then predicted by tree con-struction methods (see Methods).
The analysis of the 8q24.3 members revealed that, in gen-eral, the genes disperse into well separated clades/subclades with long branch lengths and often with many nodes in between (Figure 4), indicating relatively large phylogenetic distances and thus divergence times. This was the case for trees based on all four different alignments. In particular ZNF16 and ZNF252 exhibit a very distant relationship to the other 8q24.3 ZNF genes and stay closest to each other but well separated by long branches. This behavior of the 8q24.3 ZNFs is different from the members of the human ZNF locus at 19q13.2 that form a closed clade with much narrower relationships. We also did a second series of anal-yses with extended mammalian ortholog sequences of the human 8q24.3 ZNF genes as well as the above mentioned pseudogene sequences at our 8q.24.3 locus. The results were qualitatively similar to the one described above in that the different 8q24 ZNF genes with their respective orthologs were always clearly separated in their own clades and not intermingling, indicating significant phylogenetic distance from each other (see Additional file 4). With respect to the residual ZNF sequences on the pseudogenes named pseudo 1 and pseudo 2, the phylogenetic analysis did not indicate close relationships to any 8q24.3 ZNF gene.
The 8q24.3 genomic sequences encoding isolated or dis-rupted KRAB domains (krab A1B1, A2B2) separated in the phylogenetic analysis of the KRAB domain from the other genes of that locus (Figure 4D and Additional file 4D). However, the krab A1B1 putative KRAB domain displayed the highest score with sequence identities of 56% (36/64) with ZNF251 when using TBLASTN. The krab A2B2 8q24.3 piece that represents a more degenerated KRAB domain showed best matches with two predicted ZNF genes (XM_498167 30/73 = 41%; XM_938315 28/67 = 41%) and then with ZNF7 (28/72 = 38%). Thus, these KRAB domains, especially krab A1B1 with the nearby pseudo1 ZNF sequence appear to be distant relatives of the other 8q24.3 KRAB domains. They might originally have been part of ancient locus members that lost their function long ago.
Despite the distant relationship TBLASTN searches of the reference human mRNA database with the different 8q24.3 ZNF protein sequences indicated that another mem-ber of the 8q24.3 locus was in general the closest relative based on overall sequence similarity. The closest human paralog of ZNF34 was ZNF250 (identities 268 out of 554 residues = 48%), that of ZNF517 was ZNF251 (identities 220/499 = 44%), and ZNF16's closest human relative was ZNF252 (identities 333/677 = 49%). The most similar para-log based on TBLASTN of ZNF250, ZNF251 and ZNF7 was ZNF184 at 6p21.3, that of ZNF252 was ZNF167 at 3p22.3-p21.1. Still, 8q24.3 members were not far off with respect to score (data not shown).
As part of the phylogenetic analysis, synonymous and nonsynonymous substitution rates within an ortholog group of each 8q24.3 ZNF gene were determined with focus on the analysis of differences between the rates for the differ-ent domains, KRAB-A, KRAB-B, non-conserved linker and zinc finger array. Estimation of these rates was carried out using maximum likelihood (software PAML, [53,54] see Methods). The results for the individual pairwise com-parisons of the four domains for each ortholog group are listed in Additional file 5. In order to generalize the find-ings, the average non-synonymous/synonymous substitu-tion rate ratios were calculated for each domain (Figure 5). Overall, the zinc finger array of each ortholog group showed strong purifying selection (ω = dN/dS around 0.1) with mostly highly significant p-values. This result was not surprising since the conserved zinc finger framework resi-dues need to be maintained in order to adopt the correct 3D structure. The KRAB domain appeared to be under purify-ing selection as well. However, our calculation argues that the purifying evolutionary pressure was generally stronger on the KRAB-A (ω around 0.15) compared to the KRAB-B domain (ω around 0.4). The linker part of the ZNF genes/ proteins, which in case of the 8q24.3 ZNF sequences and their orthologs does not contain any conserved domain, fol-lowed neutral evolution (ω near 1). When we restricted the
Lorenz et al. BMC Genomics 2010, 11:206
http://www.biomedcentral.com/1471-2164/11/206
Page 11 of 30
analysis to a stretch of sequence encoding the amino acids that mainly determine DNA binding specificity (see next paragraph), again, the values obtained showed strong puri-fying selection as for whole zinc fingers.
Comparative analysis of zinc finger DNA binding domains
Specific amino acid residues positioned in the C2H2 zinc finger domain play a key role in determining their nucleic acid binding specificities. Based on the EGR1/Zif268 pro-tein-DNA crystal structure, helical positions -1, 3 and 6 with respect to the start of the α-helix are especially impor-tant for DNA-binding specificity [17]. When comparing
Figure 4 Phylogenetic relationships between the human ZNF genes from 8q24.3, their murine orthologs and other human ZNF genes. The
analysis relied on alignments of full nucleotide cDNA sequences (A), of whole polypeptide sequences (B), of the array of all C2H2 zinc finger domains of each protein and of the KRAB domains using the neighbor-joining method. The analysis also included Xenopus Xfin as a distant outlier and as ref-erence group seven KRAB-ZNFs from human 19q13.2 and eight KRAB-ZNFs from other genomic locations. Numbers indicate bootstrap values in per-cent based on 1000 replicates. To the right of the different clades the genomic localizations of the human genes are given. Note that the two KRAB domains of presumable pseudogenes (krab A1B1, krab A2B2) within 8q24.3 as well as an artificially combined human ZNF252 KRAB domain (labeled "art") have been added; see text for more details. Since the ZNF16 ortholog cDNAs from mouse and rat do most likely not give rise to a functional protein, protein sequences were not included in the analyses. The full nucleotide and protein sequences are given in Additional files 1 and 2, respec-tively.
Lorenz et al. BMC Genomics 2010, 11:206
http://www.biomedcentral.com/1471-2164/11/206
Page 12 of 30
these important residues along each group of orthologs (from opossum to human, as available), it became immedi-ately evident, that they are highly conserved (see graphical depiction in Additional file 6). Analysis of the mutational trends in this region of the α-helix between the 8q24.3 ZNF paralogues should help to clarify likely duplication scenar-ios and functional, i.e. nucleic acid binding residue, vari-ability. To that purpose, principal component analysis of the conservation profile of the individual zinc finger sequences was performed. The analysis is based on the multiple align-ment of the region encompassing the 8-residue long stretches from positions -2 to 6 with respect to the α-helix of each C2H2 zinc finger. Principal component analysis identifies new axes in a multiple alignment matrix by weighting positions with high co-variation and deemphasiz-ing positions that show little co-variation with other posi-tions. Positions in the stretch of binding residues most tightly connected with one another thus reflect correlated mutations that are under evolutionary selection and are more likely to be important for nucleic acid binding. The first principal component, plotted on the x-axis of Figure
6A, contains position 6 (weight -0.82) and the correlated position 5 (weight -0.44). The second principal component, plotted on the y-axis, is based on position -2 0.92) and 1 (-0.27). For both axes, zinc-finger domains sharing the preva-lent amino acids in the respective positions are in the nega-tive and genes with mutations in these positions in the positive regions. The sequences assigned to the different regions with the plotted matrix values are given in Addi-tional file 7. Region I contains all zinc finger domains with a significantly overrepresented motif S [Q, R]S---IQ (a dash stands for any amino acid) with frequencies S(49%), [Q(35%), R(19%)], S(45%), I(44%), and Q(49%). S---IQ is found in nearly all 8q13.4 genes (only ZNF7 has the mutational variant R---IQ). The subgroups in region I rep-resent the motif SQ----IQ prep-resent in individual zinc fingers of human/mouse/rat ZNF250, human ZNF16, ZNF34 and ZNF252, and its relative, the motif SR----IQ present in human/mouse/rat ZNF251 as well as human ZNF517 zinc fingers. Region I also includes the motif S-S---IQ found in C2H2 domains of human/mouse/rat ZNF251, and human ZNF34 and ZNF16. In zinc finger domains of region II the
Figure 5 Estimation of the evolutionary selection pressure on the different domains of the ZNF genes/proteins from 8q24.3 and their or-thologs. The histogram plots the average ω (= ratio between dN, the number of non-synonymous substitutions per non-synonymous site, and dS,
the number of synonymous substitutions per synonymous site) for each domain, KRAB-A, KRAB-B, linker (LINK) and zinc finger array (ZNF, the consec-utive sequence of all C2H2 zinc fingers of the gene/protein) of the ZNF genes/proteins. The data labeled 7AA DBD only consider the sequences -2 to 6 with respect to the a-helix of each C2H2 zinc finger for analysis, except for conserved position 4. The ω values of smaller than 1, equal to 1 or larger than 1 refer to negative purifying selection, neutral evolution or positive selection, respectively. Error bars represent the respective standard deviations. The means of the different domains were statistically compared by a T-test, the asterisks indicate the high significance (p < 0.0001).
0.0
0.2
0.4
0.6
0.8
1.0
1.2
1.4
1.6
1.8
KRAB-A KRAB-B
LINK
ZnF
7AA
DBD
A
ver
ag
e
O
meg
a
(d
N
/d
S
)
***
***
***
***
***
***
***
ZNF
Lorenz et al. BMC Genomics 2010, 11:206
http://www.biomedcentral.com/1471-2164/11/206
Page 13 of 30
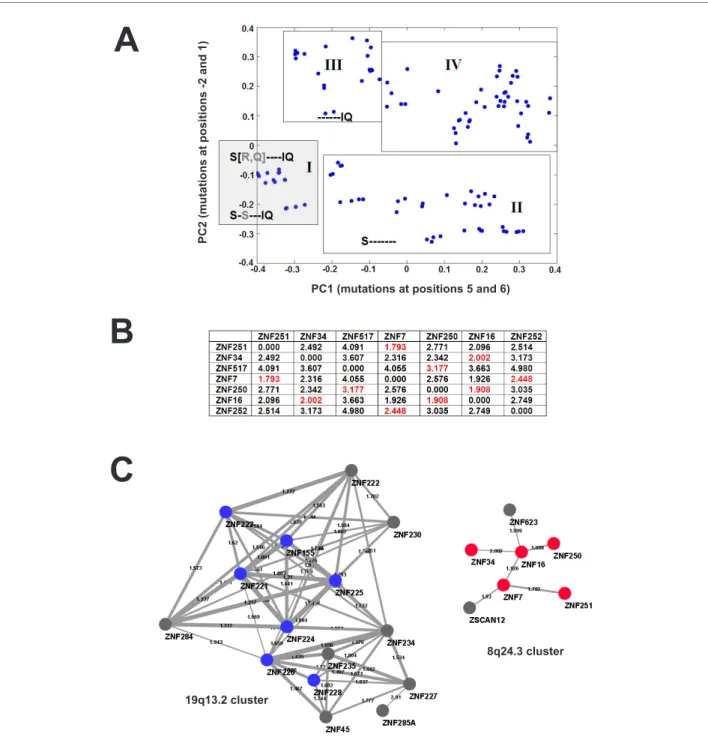
Figure 6 Evaluation of the conservation of the C2H2 ZNF DNA binding domains. (A) Principal component analysis of ZNF domains for
conser-vation based on the 8-amino acid region from -2 to 6 with respect to the start of the α-helix of each finger (see text). Included are all individual fingers from the 8q24.3 ZNF proteins and their mouse and rat orthologs. The plot shows the first (PC1) against the second (PC2) principal component repre-senting the variation in position 5 and 6 or -2 and 1, respectively. Negative values are indicative of lower variability and thus higher conservation. Plot areas that contain the same or similar 8-residue regions are boxed. Conserved amino acids are highlighted in single letter code at respective positions. Dashes indicate non-conserved residues. Additional file 7 details all peptides and their values/coordinates based on the boxed areas. (B) Pairwise ZNF matrix similarities between the 8q24.3 ZNF locus members (see text). Numbers in red indicate lowest values, i.e. highest similarities of each ZNF gene. (C) Detail of a paralog network founded on pairwise ZNF sequence similarities between all human C2H2 ZNF genes (see text). Nodes represent the individual genes (labeled by name), the edges describe their similarity. The thickness of the edges is proportional to the similarity and the value is given as label. A decrease in the value means an increase in similarity. Shown are the isolated 8q24.3 and 19q13.2 clusters of the network with 8q24.3 ZNF member nodes in red, and nodes of 19q13.2 members included in Figure 2 in blue. Network restricted to similarity values ≤ 2.01.
A
B
C
PC1 (mutations at positions 5 and 6)
PC2 (mutations at positions -2 and 1) 8q24.3 cluster 19q13.2 cluster
Lorenz et al. BMC Genomics 2010, 11:206
http://www.biomedcentral.com/1471-2164/11/206
Page 14 of 30
serine is still at position -2; however, mutations in positions 5 and 6 have occurred (e.g. zinc fingers ZNF7-12 SQ----IY, ZNF7-2 SD----KH, while in region III the serine at -2 is lost, but the IQ at position 5 and 6 is conserved (e.g. ZNF7-4 RL----IQ). As expected, residues in the binding region of the 8q24.3 zinc finger domains are frequently modified to alter or refine their binding specificity; yet, specific amino acids at positions -2, 1 and 5, 6 are significantly overrepre-sented in the 8q23.4 sub-family of zinc fingers pointing to a common conserved framework of DNA binding.
Multiple alignments are a means to compare and relate zinc finger domains. However, the search for the best align-ment is often complicated if different numbers of the highly conserved zinc finger motif are present in the sequences to be aligned. Therefore, we sought an alternative way to com-pare zinc finger sequence similarity and thus DNA binding specificity: We computed ZNF motif matrices for each 8q24.3 ZNF gene based on the codon-aligned individual zinc finger sequences (see Methods). These matrices were then used to calculate a pairwise similarity table between the genes (Figure 6B). The results argued that the closest relatives with respect to their DNA binding domain were ZNF7 and ZNF251. Yet several other similarities were not that far off, e.g. those between ZNF250 and ZNF16, ZNF7 and ZNF16 and ZNF34 and ZNF16. In contrast ZNF252 and ZNF517 exhibited the most distantly related matrices. In order to define the closest paralogs in human with respect to the ZNF domain we extended the analysis to all human C2H2 genes in the SysZNF database [40]. The com-puted pairwise similarity tables were used to construct ZNF similarity networks. The graphical display allowed us to visualize the closest paralogs with respect to ZNF matrix similarity in a cluster-wise fashion. In order to avoid over-crowding and pinpoint the closest relationships between ZNF genes we limited the network by chosen thresholds. With a threshold of 2.01 we found five of the seven 8q24.3 genes (ZNF7, ZNF16, ZNF34, ZNF250, ZNF251) within one sparse isolated cluster of the network construction (Fig-ure 6B). In this cluster another member of the locus was always nearest neighbor as indicated by the similarity val-ues. Thus, no other human ZNF gene was found that was more closely related in the ZNF domain. The cluster con-tained two additional ZNF genes with close similarities, ZSCAN12 from chromosome 6 (NCBI GeneID:9753) and ZNF623 (GeneID:9831) that, interestingly, is located upstream not far from our 8q24.3 locus at approximately 144.8 Mb. ZNF517 and ZNF252 are missing from the clus-ter and have closest relationships in their ZNF matrix with ZNF324B (GeneID:388569, at 19q13.43; similarity 2.466) and ZNF184 (GeneID:7738, at 6p21.3; similarity 2.189). As reference group we looked at the genes from cluster 19q13.2 again. They too were grouped within one cluster (Figure 6C) and displayed higher ZNF matrix similarities among themselves than the 8q24.3 sequences. The closer
relationship within the group was also obvious from the higher interconnectivity, i.e. the gene nodes had a higher number of connecting edges. Thus, despite clear diver-gence, the analyses of the ZNF DNA binding domains pro-vide epro-vidence for a common evolutionary history of the 8q24.3 zinc finger genes.
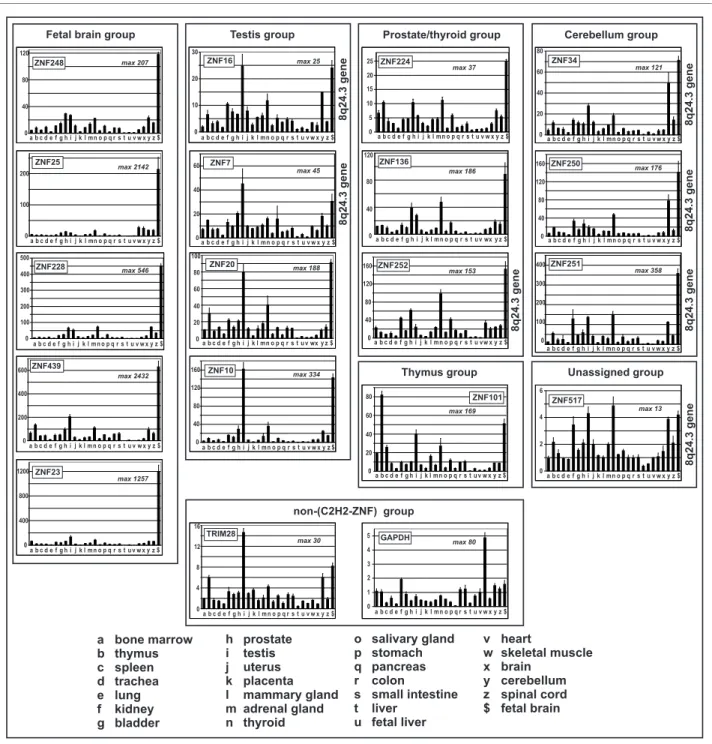
Tissue expression profiles of the ZNF genes in the 8q24.3 cluster
The profiling of expression signatures provides a means to functionally compare the transcription regulatory sequences of the 8q24.3 ZNF genes. Therefore we recorded the gene expression profiles of the 8q24.3 ZNF genes in twenty-seven human tissues by quantitative RT-PCR and compared them to those of ZNF genes at other chromosomal localiza-tions (Figure 7, see also individual data in Additional file 8). We also included the analysis of the KRAB-ZNF co-repressor gene TRIM28 and the housekeeping gene GAPDH. Each gene-specific assay gives a measure of the relative expression in the different tissues (fold changes with respect to the value in heart tissue that was set to 1). Transcripts of all 8q24.3 ZNF genes turned out to be detect-able in all tissues, though, the results indicated overall strong expression differences in individual tissues for most of the genes. For the 8q24.3 genes the smallest overall devi-ations between tissues were seen with ZNF517 (maximal factor of 13.5: lung 0.36 and thyroid 4.86), whereas the highest differences were observed with ZNF251 (maximal factor of 358: heart 1 and fetal brain 358.31). Interestingly, in most cases the maximal relative expression levels of the 8q24.3 ZNF genes were reached in fetal brain, testis, cere-bellum and thyroid. On the other hand, the 8q24.3 ZNF genes were generally the least abundant in heart, liver, fetal liver and lung. Noteworthy, similar expression profiles were also observed for the non-8q24.3 ZNF genes tested but not for the housekeeping gene GAPDH. Visual inspec-tion of the profiles led us to subgroup the ZNF genes into 3 groups, based on tissues with the highest expression. ZNF7 and ZNF16 fell into the testis group, ZNF34, ZNF250 and ZNF251 into the cerebellum group and ZNF252 into the prostate/thyroid group. These expression signatures may hint at more prominent roles of these genes in the respective tissues. ZNF517 was left unassigned since overall expres-sion changes were relatively small compared to the other genes. With respect to TRIM28 we recorded a profile that parallels the testis subgroup of ZNF expression signatures, yet the absolute expression changes between tissues were smaller (maximal factor ~ 30: liver 0.49, testis 14.65). Since relative quantification of the number of transcript molecules was performed, absolute differences in expres-sion levels between different genes could only be estimated by the values of the respective threshold cycles (Ct; lower values mean higher number of starting RNA molecules; note the exponential relationship). Assuming similar PCR
Lorenz et al. BMC Genomics 2010, 11:206
http://www.biomedcentral.com/1471-2164/11/206
Page 15 of 30
Figure 7 Human tissue expression profiles of the 8q24.3 ZNF genes. RNA expression profiles (labeled by gene names) of the seven 8q24.3 zinc
finger genes compared to those of ten other C2H2 zinc finger genes, the KRAB domain-interacting partner TRIM28 and of the housekeeping gene GAP-DH. Relative expression levels with the respective value for heart tissue set to 1 were determined with gene-specific assays by quantitative RT-PCR. The ordinate displays fold changes compared to heart. The different tissues as source for total RNA are labeled with letters and are indicated on the bottom of the bar plots. The maximal fold change between the tissue with the highest and the lowest values is indicated in the histograms ("max"). Bars represent means of three replicates ± SD within one assay. The profiles are arranged in subgroups: Strong overrepresentation in fetal brain com-pared to all other tissues ("fetal brain group"); values in testis similar or larger to those in fetal brain ("testis group"), prominent thyroid and prostate expression ("prostate/thyroid group"); highest expression in thymus ("thyroid group"); at least 50fold increased expression in cerebellum compared to heart and ratio fetal brain/cerebellum < 3.5 ("cerebellum group"). ZNF517 was unassigned, TRIM28 and GAPDH were put into a non-ZNF group.
a bone marrow b thymus c spleen d trachea e lung f kidney g bladder o salivary gland p stomach q pancreas r colon s small intestine t liver u fetal liver h prostate i testis j uterus k placenta l mammary gland m adrenal gland n thyroid v heart w skeletal muscle x brain y cerebellum z spinal cord $ fetal brain 0 50 100 150 200 250 300 350 400 450 1 Bone
mar r ow2 Thy mus3 Spleen4 Tr ache a5 Lung6 Ki dney7 Bl adder8 Pr ost ate9 Tes ti s1 0 Uter us1 1 Pl acen ta1 2Ma mmar ygl and
1 3 Adr enalgl and1 4 Thy r oi d 1 5 Sali var ygl and1 6 StomachPan cr eas1 8 Col on1 7 1 9 Smal li nte st i ne20 Li ver21 Fetall i ver22 Hear t23 Skel eta lmuscl e24 Br ai nCer ebel l um26 Spinal25chor d27 Fetalbr ai n
0 100 200 300 400 a b c d e fg hij k l mn o p q r s t u v w x y z $ ZNF251 0 10 20 30 40 50 60 70 80 1 Bone marrow
2 Thymus3 Spleen4 Trachea5 Lung6 Kidney7 Bladder8 Prostate9 Testis10 Uterus11 Placenta 12 Mammary gland 13 Adrenal gland 14 Thyroid15 Salivary
gland 16 Stomach 17 Pancreas18 Colon19 Small
intestine 20 Liver21 Fetal liver22 Heart23 Skeletal
muscle 24 Brain25 Cerebellum26 Spinal
chord 27 Fetal brain ZNF34 20 0 40 60 80 a b c d e fg hij k l mn o p q r s t u v w x y z $ 0 1 2 3 4 5 6 1 Bone marrow
2 Thymus3 Spleen4 Trachea5 Lung6 Kidney7 Bladder8 Prostate9 Testis10 Uterus11 Placenta 12 Mammary gland 13 Adrenal gland 14 Thyroid15 Salivary
gland 16 Stomach 17 Pancreas18 Colon19 Small
intestine 20 Liver21 Fetal liver22 Heart23 Skeletal
muscle 24 Brain25 Cerebellum26 Spinal
chord 27 Fetal brain a b c d e fg hij k l mn o p q r s t u v w x y z $ ZNF517 2 0 4 6 0 10 20 30 40 50 60 70 1 Bone
marr ow2 Thymus3 Spleen4 Trachea5 Lung6 Kidney7 Bladder8 Prost ate9 Testis10 Uter us11 Placenta12 Mammarygland13 Adr enalgland14 Thyr oid15 Salivar ygland16 Stomach17 Pancr eas18 Colon19 Smallint esti ne20 Liver21 Fetal li ver22 Heart23 Skelet almuscle24 Brai n25 Cer ebell um26 Spinalchord27 Fetal br ain
a b c d e fg hij k l m n o p q r s t u v w x y z $ ZNF7 0 20 40 60 0 20 40 60 80 100 120 140 160 180
1Bonemarrow2Thymus3Spleen4Trachea5Lung6Kidney7Bladder8Prostate9Testis10Uterus11Placenta12Mammarygland13Adrenal gland14Thyroid15Salivarygland16Stomach17Pancreas18Colon19Small intestine20Liver21Fetal liver22Heart23Skeletalmuscle24Brain25Cerebellum26Spinalchord27Fetal brain
a b c d e fg hij k l m n o p q r s t u v w x y z $ ZNF250 160 120 80 40 0 0 5 10 15 20 25 30
1Bonemarrow2Thymus3Spleen4Trachea5Lung6Kidney7Bladder8Prostate9Testis10Uterus11Placenta12Mammarygland13Adrenal gland 14
Thyroid15Salivarygland16Stomach17Pancreas18Colon19Small intestine20Liver21Fetal liver22Heart23Skeletalmuscle24Brain25Cerebellum26Spinalchord27Fetal brain
a b c d e fg hij k l mn o p q r s t u v w x y z $ ZNF16 30 0 20 10 0 5 10 15 20 25 oear 1Bn mro w2 Thymus 3Spleen a4Trchea5 Lugn6 Kieydn7 Bl
deadr 8 Prostate 9Testis0 u 1 Uters 11 Plae ta cn2amag 1 Mm ry land 13Are nl gl n da ad 14T hyrodi 5l a 1 Saivaryg lnd 61 Stomac h 17Panr as ce81 Colon 9 lnt 1 Smal tesin e i 02 Liver 1 av 2 Fetl lier 22Har t e 3 e 2 Skele tal msc lu 24B ra in 5 l 2 Cerebel um 6 ic 2 Spnal hord 7a a 2 Fet l brin a b c d e fg h j k l m n o p q r s t u v w x y z $i ZNF224 20 15 10 5 0 25 0 50 100 150 200 250 300 350 400 450 500 1 ne maow Bo rrT2hymu s 3 en SpleTra a 4 che5ug Ln ny
6 Kide7 Bladerd8ostate Pr 9Tessti1 Uteru0 s 1 n 1 Placeta 1 Mammay land 2 r g 1 Adren al glad 3 n14Thr yod i 1 Salivary gland 5 1 Smac6to h1 Pancres 7 a18 Colo n S l inte e 19 mal stin 2 Ler 0iv21ea Ftl lve
ir 2 Heart223 Skleta muscleel
2 Brain 4 2 Cerebellum5 S c 26 pinal hord Ft i 27eal bra n a b c d e fg h j k l m n o p q r s t u v w x y z $i ZNF228 200 300 100 500 0 400 0 20 40 60 80 100 120 140 160 180
1Bonemarrow2Thymus3Spleen4Trachea5Lung6Kidney7Bladder8Prostate9Testis10Uterus11Placenta12Mammarygland13Adrenal gland14Thyroid15Salivarygland16Stomach17Pancreas18Colon19Small intestine20Liver21Fetal liver22Heart23Skeletalmuscle24Brain25Cerebellum26Spinalchord27Fetal brain
a b c d e fg hij k l mn o p q r s t u vw x y z $ ZNF252 0 40 80 120 160 0 20 40 60 80 100 120 140 160 180
1Bonemarrow2Thymus3Spleen4Trachea5Lung6Kidney7Bladder8Prostate9Testis10Uterus11Placenta12Mammarygland13Adrenal gland14Thyroid15Salivarygland 16Stom
ach17Pancreas18Colon19Small intestine20Liver21Fetal liver22Heart23Skeletalmuscle24Brain25Cerebellum26Spinalchord27Fetal brain
a b c d e fg hij k l mn o p q r s t u v w x y z $ ZNF10 0 40 80 120 160 0 20 40 60 80 100 120 abc defghijklmnopqrstuvwxyz$ a b c d e fg hij k l mn o p q r s t u v w x y z $ ZNF248 40 80 120 0 0 200 400 600 800 1000 1200 abc defghijklmnopqrstuvwxyz$ a b c d e fg hij k l m n o p q r s t u v w x y z $ ZNF23 0 400 800 1200 0 10 20 30 40 50 60 70 80 90 100 abc defghijklmnopqrstuvwxyz$ a b c d e fg hij k l mn o p q r s t u v wx y z $ ZNF20 20 40 60 80 100 0 0 10 20 30 40 50 60 70 80 90 abc defghijklmnopqrstuvwxyz$ 20 40 60 80 0 ZNF101 a b c d e fg hij k l mn o p q r s t u v w x y z $ 0 100 200 300 400 500 600 700 abc defghijklmnopqrstuvwxyz$ a b c d e fg hij k l m n o p q r s t u v w x y z $ ZNF439 0 200 400 600 0 1 2 3 4 5
1Bonemarrow2Thymus3Spleen4Trachea5Lung6Kidney7Bladder8Prostate9Testis10Uterus11Placenta12Mammarygland13Adrenal gland14Thyroid15Salivarygland 16Stom
ach17Pancreas18Colon19Small intestine20Liver21Fetal liver22Heart23Skeletalmuscle24Brain25Cerebellum26Spinalchord27Fetal brain
a b c d e fg hij k l m n o p q r s t u v w x y z $ GAPDH 5 3 4 2 0 1 0 50 100 150 200 250 abc defghijklmnopqrstuvwxyz$ a b c d e fg h j k l mn o p q r s t u v w x y z $i ZNF25 100 200 0 0 20 40 60 80 100 120 1 Bone marrow
2 Thymus3 Spleen4 Trachea5 Lung6 Kidney7 Bladder8 Prostate9 Testis10 Uterus11 Placenta 12 Mammary gland 13 Adrenal gland 14 Thyroid15 Salivary
gland 16 Stomach17 Pancreas18 Colon19 Small
intestine 20 Liver21 Fetal liver22 Heart23 Skeletal
muscle 24 Brain25 Cerebellum 26 Spinal
chord 27 Fetal brain a b c d e fg hij k l m n o p q r s t u v wx y z $ 120 0 40 80 ZNF136
Fetal brain group Testis group Prostate/thyroid group Cerebellum group
Thymus group 8q24.3 gene 8q24.3 gene 8q24.3 gene 8q24.3 gene 8q24.3 gene 8q24.3 gene 8q24.3 gene 0 2 4 6 8 10 12 14 16 abc defghijklmnopqrstuvwxyz$ a b c d e fg hij k l m n o p q r s t u v w x y z $ TIF1beta 0 4 8 12 16 TRIM28 Unassigned group non-(C2H2-ZNF) group max 207 max 2142 max 546 max 2432 max 1257 max 25 max 45 max 188 max 334 max 30 max 80 max 169 max 153 max 186 max 37 max 121 max 176 max 358 max 13
Lorenz et al. BMC Genomics 2010, 11:206
http://www.biomedcentral.com/1471-2164/11/206
Page 16 of 30
efficiencies, the RT-PCR data indicate that transcripts of all 8q24.3 ZNF genes were much less abundantly expressed than those of TRIM28 or GAPDH (see Additional file 8 for the primary quantitative PCR data). In heart tissue, e.g., most 8q24.3 ZNF gene transcripts were detectable at Ct values between 30 and 31 whereas TRIM28 and GAPDH displayed values of 22.9 and 19.13, respectively. In testis, the 8q24.3 ZNF RNAs were detected earlier at Ct values of about 24-26, demonstrating the higher expression in this tissue. Here, TRIM28 and GAPDH were detectable at Ct 19 and 19.6, respectively.
The different gene expression patterns were compared using hierarchical cluster analysis. Clustering was done for the genes under study as well as for the different tissues (values for distance measures are given in Additional files 9 and 10). As noted above, we observed overall high similari-ties of the ZNF expression profiles. Expression of 8q24.3 and non-8q24.3 ZNF genes is similar, but different from a group of unrelated genes (see Additional file 10). The heat-map in Figure 8 visualizes the results for the ZNF genes. Based on gene expression similarity clustering different subgroups can be identified, corresponding to the manually compiled ones in Figure 7. The genes of our 8q24.3 locus spread into several well-separated clades. Among the locus members, ZNF250 and ZNF34 displayed the closest tissue expression profiles. Furthermore, ZNF251 was the next related ZNF gene of 8q24.3. Similarly, ZNF16 and ZNF7 were closest neighbors. ZNF252 is the most distant with respect to the other 8q24.3 ZNF genes. This more distant relationship is indicated by a lower expression in cerebel-lum and a higher expression in prostate and thyroid. This places ZNF252 into a clade with ZNF136 and ZNF224. The data implicate that many KRAB-ZNF genes display similar tissue expression profiles. Genes from the same genomic locus with close profiles like ZNF250/ZNF34 or ZNF16/ ZNF7 might share common regulatory sequences.
Considering tissue clustering, fetal brain and testis sepa-rate most from the other tissues. The latter fall into three tis-sue groups: Group I with usually high expression comprises prostate, thyroid, thymus, cerebellum and kidney. Group II with usually low expression consists of pancreas, salivary gland, liver, heart, fetal liver, lung and placenta. Group III shows moderate expression compared to the others. In terms of the three germ layers there does not seem to be overrepresentation of a particular one in a group. Still, the tissues are made up of different cell types and it remains unknown which cell types contribute most to the ZNF expression levels.
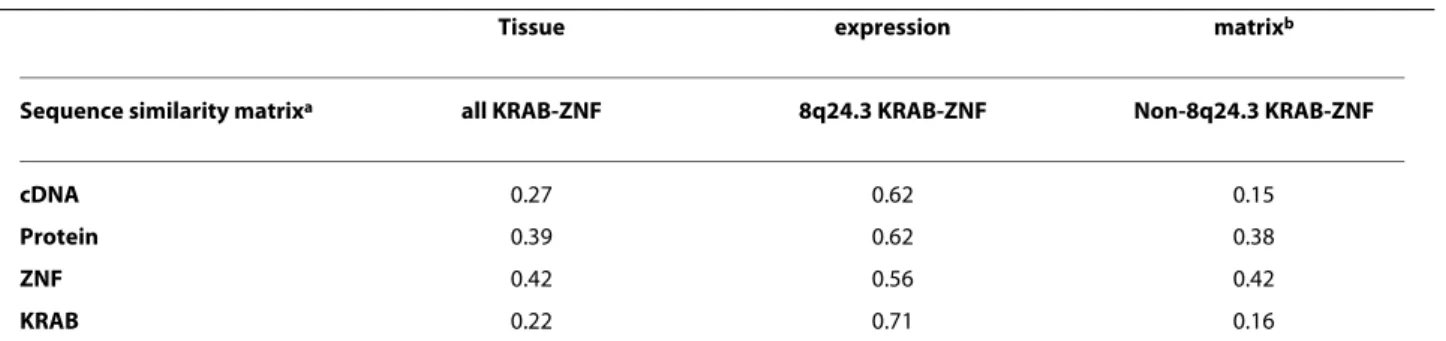
Sequence similarity implies expression profile similarity
We compared the four different sequence similarity matri-ces with the expression profile similarity matrimatri-ces. We con-centrated on those KRAB domain encoding genes that are also included in the phylogenetic sequence comparisons
(Figure 4). The results are summarized in Table 2. The three columns correspond to all sixteen ZNF genes, 8q24.3 and non-8q24.3 genes, respectively. Generally, there is a moder-ate, but nevertheless significant, positive correlation between sequence and expression profile similarities. Con-sidering all sixteen genes, the ZNF domain sequence simi-larity correlates best with gene expression simisimi-larity (0.42). Interestingly, the correlation between sequence and expres-sion similarity is highest for the six 8q24 KRAB-ZNF genes. This holds for all four different sequence similarities (all four rows), but is most striking for the KRAB domain sequence. So we conclude that KRAB-ZNF genes from the 8q24.3 locus with similar KRAB domain sequence have a very similar expression profile implying involvement in connected biological processes.
Computational comparison of the promoter regions of the seven human 8q24.3 ZNF genes
To investigate if expression profile similarities were due to promoter similarities (same transcription factor binding sites (TFBS)), we analyzed the proximal promoter regions of the seven ZNF genes for (i) general properties and espe-cially (ii) common TFBS (see Methods for details).
The basic characteristics of the seven promoter regions are summarized in Table 3 (promoter sequences are given in Additional file 11): With the exception of ZNF34 the ZNF genes exhibit more than one major transcriptional start site (TSS) in the analyzed regions, three of them even four. The promoter regions overlap with CpG islands and experi-mentally defined binding regions of the RNA polymerase II core enzyme (see Additional file 12). Concerning classical core promoter elements, the seven ZNF promoter regions do neither contain classical Initiator (INR) elements, nor a TATA-box, a downstream promoter element (DPE) or a TFIIB recognition element (BRE) in a typcial configuration in relation to a TSS. Interestingly, an INR-DPE module can be found in the ZNF34 promoter region, although in an atypical constellation upstream of the TSS. The motif ten element (MTE), originally identified in Drosophila appears to act synergistically with INR [55]. Though lacking the INR, the ZNF34 promoter region displays this element in a typical position downstream of the TSS. Also the promoter regions of ZNF7, ZNF16 and ZNF517 show such an ele-ment less than 50 bp from the default location (for a detailed list of the sequence elements see Additional file 13). Finally, an X core promoter element (XCPE1) is found properly spaced to a TSS in the ZNF16 and ZNF252 pro-moter regions. This element can utilize free TATA-binding protein or the complete TFIID complex, usually in TATA-less genes and in conjunction with sequence-specific tran-scriptional activators [56].
Next we looked for common sequence-specific TFBS among the promoter regions of the seven ZNF genes. We searched for predefined functional transcription factor
mod-Lorenz et al. BMC Genomics 2010, 11:206
http://www.biomedcentral.com/1471-2164/11/206
Page 17 of 30
Figure 8 Comparison of the tissue expression patterns of the seven 8q24.3 ZNF genes and those of ten ZNF genes located on other human chromosomes by hierarchical cluster analysis. The RNA expression profiles are based on quantitative RT-PCR with total RNA from the indicated
tissues as input (see Figure 7). The trees were calculated with the original relative expression data. The gene tree is based on the Pearson correlation distance and the tissue tree on Euclidian distance, both with single linkage. For the visual heatmap the data were standardized in order to fit them into the same scale, however, without changing the trees. Pseudo-color dark blue marks lowest, dark red highest expression. In addition to the gene names chromosomal localizations are indicated. The assignment of ZNF genes into tissue subgroups is based on subclades of the gene clustering and is consistent with Figure 7.
ZNF136 ZNF101 ZNF20 ZNF439 ZNF251 ZNF34 ZNF517 ZNF10 ZNF250 ZNF7 ZNF248 ZNF23 ZNF252 ZNF16 ZNF25 ZNF224 8q24.3 19p13.2-p13.3 19p13.2 19p13.3-p13.2 19p13.11 10p11.2 10p11.2 16q22.2 12q24.33 8q24.3 ZNF228 19q13.2 19q13.2 Bone marrow Thymus Spleen Mammary gland T rachea Colon Small intestine Liver Fetal liver Heart Skeletal muscle Lung Adrenal gland Pancreas
Bladder Placenta Uterus
Kidney
Salivary
gland
Spinal
cord Brain Prostate Thyroid Stomach
T estis Cerebellum Fetal brain Fetal brain group Cerebellum group
Prostate/ thyroid group
Te s ti s group Thymus group -1.12 -0.45 -0.25 0.25 4.91
ules using Genomatix ModelInspector (see Methods). This approach is based on the occurrence of usually two com-bined TFBS that have been experimentally shown to be functionally connected [57]. This strategy increases the likelihood to detect TFBS of biological relevance. Using a simple counting strategy on the thus obtained data we found eight module families that were shared in at least three of the seven ZNF promoter regions (Table 4; further details in Additional file 14). The lowest number of common
mod-ules was found in the ZNF34 promoter region. The eight module families cover 46 out of a total of 93 defined indi-vidual modules. The module families ETSF_SP1F, EGRF_SP1F and SP1F_ETSF occurred in six of the seven analyzed sequences. Certain families of TFBS like SP1-, ETS- und EGR-families occurred with high frequency in these modules. In order to pinpoint the involved elements we separated the eight module families into TFBS families and individual TFBS (Table 5). The most frequent TFBS