Bioresorbable Scaffold Thrombosis: Multicenter Comprehensive Analysis of Clinical Presentation, Mechanisms and Predictors
Serban Puricel*, Florim Cuculi*, Melissa Weissner, Axel Schmermund, Peiman Jamshidi, Tobias Nyffenegger, Harald Binder, Holger Eggebrecht, Thomas Münzel,
Stephane Cook*, Tommaso Gori*
Methods Devices
Absorb BVS were available in Mainz starting from May 2012, in Frankfurt in March 2013, in Fribourg in June 2012 and in Luzern in Juli 2013. The database includes all patients treated with BVS until January 2015.
Quantitative coronary angiography
Digital angiograms were analysed with the use of an automated edge-detection system (Xcelera, Philips, the Netherlands). Quantitative measurements included lesion length, MLD (minimum lumen diameter), RVD (reference vessel diameter) and TIMI (thrombolysis in myocardial infarction) flow before and after BVS implantation using standardized definitions. Repeatability and reproducibility data are reported elsewhere(1). The % stenosis before implantation and % residual stenosis after BVS implantation were calculated as
100 ∗ (𝑅𝑅𝑅 − 𝑀𝑀𝑅) 𝑅𝑅𝑅
The maximum “footprint”, i.e. the maximum % of the vascular circumference occupied by struts, was calculated as:
100 ∗ 𝑂𝑂𝑂𝑂𝑂 𝐵𝑅𝐵 𝑠𝑂𝑂𝑠𝑠𝑠𝑂 𝐵𝑅𝐵 𝑙𝑂𝑙𝑙𝑂ℎ ∗ (π 𝑀𝑀𝑅)
That is, the outer BVS surface per mm divided by the lumen circumference at the level of the MLD.
As such, the maximum footprint reflects the ratio of the outer surface of the BVS struts to the vascular circumference at the level of the MLD. In a OCT cross-section, this would be the ratio of the white to the blue line.
Data on the outer BVS surface were kindly provided by Dr Rapoza of Abbott Vascular.
The scaled residual stenosis was calculated as
100 ∗ (𝑙𝑛𝑛𝑛𝑙𝑠𝑙 𝐵𝑅𝐵 𝑑𝑛𝑠𝑛𝑂𝑂𝑂𝑂 − 𝑀𝑀𝑅) (𝑙𝑛𝑛𝑛𝑙𝑠𝑙 𝐵𝑅𝐵 𝑑𝑛𝑠𝑛𝑂𝑂𝑂𝑂)
and reflects the degree of deployment of the BVS as compared to the theoretical nominal value. Of note, in cases where the BVS is implanted or postdilated to a diameter larger than the nominal (MLD larger than nominal BVS diameter), this value becomes negative. The scaled residual stenosis reflects the expansion of the BVS
rather than that of the vessel and therefore provides information that is slightly different from % residual stenosis: a negative scaled stenosis, for instance, reflects the expansion of the BVS above its nominal value, independently of the whether the RVD was reached or not.
“Undersizing” was defined as the implantation of a BVS with a nominal diameter 20% or more smaller than the RVD, and calculated as the ratio of
𝑙𝑛𝑛𝑛𝑙𝑠𝑙 𝐵𝑅𝐵 𝑑𝑛𝑠𝑛𝑂𝑂𝑂𝑂
𝑅𝑅𝑅 < 0.8 Correspondingly, oversizing was
𝑙𝑛𝑛𝑛𝑙𝑠𝑙 𝐵𝑅𝐵 𝑑𝑛𝑠𝑛𝑂𝑂𝑂𝑂
𝑅𝑅𝑅 > 1.2
Further definitions and reproducibility data are presented in a recent publication(1).
Selection of the control group and matching
For the selection of the control group, 2 patients with BVS implantation and no ScT were matched for each ScT patient. For matching, the clinical variables which showed a P<0.05 in the multivariable analysis were used. As well, patients were matched using the following criteria which clearly interfere with QCA measurements: BVS diameter and length, acute coronary syndrome and complete occlusion at the index procedure. Patients and controls were identical for these variables. Analyses were performed treating the two groups as independent samples. For the assessment of stent implantation, standardized definitions were used(2). While intracoronary imaging
methods allow acquisition at a higher resolution and are in principle better suited for this analysis, definitions are as yet less standardized and these methods are less suited for large databases such as the present one.
The impact of a BVS-specific implantation protocol
Triggered by the initial observations of an unexpectedly high incidence of ScT(3), and based on preliminary findings of incomplete BVS expansion in cases of ScT(4) and improved acute results using 1:1 ballon:vessel predilation and postdilation(5), a major focus was put internationally on strenghtening BVS implantation recommendations. By review of the internal mortality and morbidity conferences, a precise timepoint (January 2014) was identified, in which these recommendations were put into place in our Institutions. The outcome of patients treated during 2012 and 2013 (“early experience”) was compared to that of patients treated in 2014 (“BVS-specific protocol”). In order to limit the effect of confounders, this analysis was restricted to a subgroup of 4 expert operators who consistently applied the same implantation techniques.
Description of implantation procedures:
During 2012 and 2013 (“early experience”), BVS were implanted using traditional “metal DES” methods, consisting of predilation using undersized semicompliant balloons and no systematic use of postdilation.
Starting January 2014, the following set of recommendations, which was later partially included in the 2015 experts review(6), was implemented:
1- Predilation using a noncompliant balloon of the same size as the RVD (several dilations were allowed until a 1:1 ratio angiographically was achieved).
2- BVS implantation only in case of full expansion of the PTCA balloon as demonstrated by angiography in two orthogonal planes (i.e. absence of any indentation >10%).
3- Implantation of a BVS with pressures of the same size as the RVD (1:1:1 ratio RVD:predilation ballon:BVS) at a pressure comprised between 10 and 12 ATM. 4- Postdilation with NC Balloons of the same size or, when necessary based on
reassessment of RVD, up to a maximum of 0.5mm larger at a pressure of 14-16ATM.
The implantation strategy did not mandate the use of imaging techniques, which was left to the operator´s discretion. Even though not systematically used, it needs to be acknowledged here that optical coherence tomography allows detecting stent underexpansion, malapposition, and, at later time points, the presence of evaginations, uncovered struts, and neoatherosclerosis as risk factors for stent thrombosis(7) and might therefore be of further help. Further, intracoronary imaging provides information on the nature of coronary lesion, the presence of calcifications and the need of postdilation(6).
Statistical analysis
Continuous variables are presented as mean±SD or median[interquartile range - IQR] and were compared using a Student’s unpaired t-test, Mann-Whitney, Kruskall-Wallis or analysis of variance based on the inspection of the Q-Q plots. Categorical
variables are presented as counts and percentages, and were compared using chi-square or Fisher’s exact tests, as appropriate. Kaplan-Meier curves were built to derive the event rates and plot time-to-event curves. Cox proportional hazards analysis was performed to identify the clinical and procedural parameters relevant for the endpoint
(the covariates screened in univariate models are listed in Tables 1, 2, 4, 5). A multivariable analysis of parameters selected at P<0.20 by univariate analysis was performed to identify the independent predictors of ScT and to estimate adjusted hazard ratios (HRs) and 95% confidence intervals (CIs). Similar uni- and multivariable analysis was repeated to address the hypothesis that the introduction of a BVS-specific implantation strategy would be associated with a reduction in the incidence of ScT. To address potential bias due to non-random assignment to implantation strategies, a propensity score model was built from a logistic regression model, using the implantation strategy as an outcome. Covariates were first screened at P<0.20, and the covariates meeting this criterion were jointly entered into a multivariable model, subjected to backward elimination, using the Akaike information criterion as a selection and stopping criterion. The resulting propensity score was subsequently used for adjustment in the Cox models.
The impact of QCA parameters was assessed using a nested case-control design. Two control patients were matched for each ScT patient as described above. Apart from these criteria, the patients were randomly chosen from the overall database. Conditional logistic regression models were used for univariate screening with P<0.20, to obtain covariates for subsequent adjustment when evaluating QCA parameters in multivariable models. Since these parameters are mathematically correlated with each other, separate analyses
were performed for MLD, RVD, and % scaled residual stenosis. To investigate potentially promising cutoffs, we dichotomized QCA parameters, and for each a grid of values of sensitivity and specificity were calculated using ROC analysis, using observation weights proportional to the number of potential controls available for each case to accommodate the nested case-control design. The positive predicted value was calculated based on the prevalence of 3% observed in the general database. Statistical tests and analyses were performed with Medcalc (Mariakerke, Belgium), SPSS22 (IBM, USA), and using the R statistical environment (R version 3.1.3).
Results
QCA analysis
Uni- and multivariable Cox regression analyses were conducted to assess the association of QCA parameters with ScT (Tables 2-10S). These analyses confirmed that MLD post-PCI, RVD, residual scaled stenosis, and maximum footprint are
independently associated with the risk of ScT, the largest effect being associated with footprint. In contrast, the % residual stenosis was not significantly associated with ScT.
Implantation protocol analysis
Prior to enactment of BVS-specific implantation recommendations (“early experience” group), 369 patients were treated with 542 BVS. This represented 20% of the patients undergoing PCI and 19% of the stents implanted during the same period. Following the implementation of the BVS-specific implantation protocol, 415 BVS were implanted in
292 patients, i.e. 24% of the patients undergoing PCI and 26% of the stents used (both P=0.01).
A number of clinical or procedural characteristics showed relevant differences between the two periods (Tables 6 and 7S): the prevalence of hypertension, hyperlipidemia and diabetes, as well as the prevalence of lesions requiring overlapping scaffolds were higher in the patients treated in 2014. In contrast, the LVEF of patients treated in 2014 was lower. Prasugrel was prescribed more frequently and ticagrelor less frequently in 2014. Most importantly, postdilation was performed more systematically in 2014. In multivariable analysis, while none of the clinical and procedural characteristics (except for treatment of ostial lesions) was associated with differences in the incidence of ScT, the implementation of a BVS-specific implantation strategy was associated with ~ 70% reduced incidence of events, corresponding to a HR of 0.26[0.08-0.90] (Table 4).
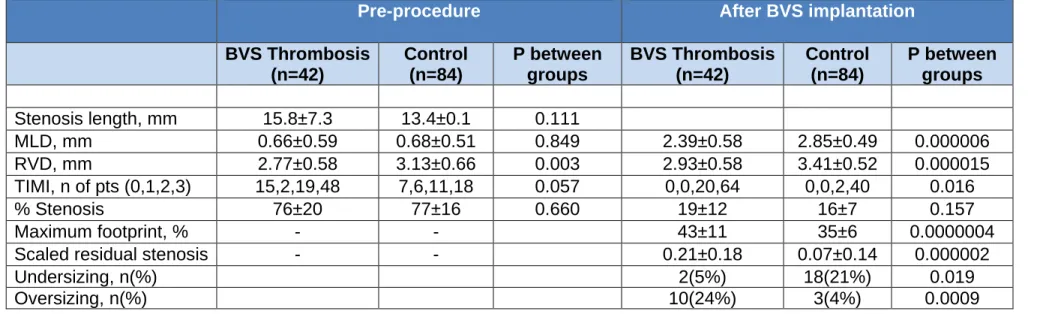
Table 1. Quantitative coronary analysis – descriptive statistics. All in-BVS analysis.
Pre-procedure After BVS implantation
BVS Thrombosis (n=42) Control (n=84) P between groups BVS Thrombosis (n=42) Control (n=84) P between groups Stenosis length, mm 15.8±7.3 13.4±0.1 0.111 MLD, mm 0.66±0.59 0.68±0.51 0.849 2.39±0.58 2.85±0.49 0.000006 RVD, mm 2.77±0.58 3.13±0.66 0.003 2.93±0.58 3.41±0.52 0.000015 TIMI, n of pts (0,1,2,3) 15,2,19,48 7,6,11,18 0.057 0,0,20,64 0,0,2,40 0.016 % Stenosis 76±20 77±16 0.660 19±12 16±7 0.157 Maximum footprint, % - - 43±11 35±6 0.0000004
Scaled residual stenosis - - 0.21±0.18 0.07±0.14 0.000002
Undersizing, n(%) 2(5%) 18(21%) 0.019
Oversizing, n(%) 10(24%) 3(4%) 0.0009
Table 2. Analysis of the predictors of ScT in the QCA population. Covariate P HR 95%Cl Male 0.644 0.81 0.33-1.99 Age years 0.237 1.02 0.99-1.06 Diabetes 0.061 0.33 0.11-1.05 Family History 0.732 0.84 0.3-2.34 GPIIbIIIA 0.268 0.54 0.19-1.6 Hyperlipidemia 0.793 1.11 0.51-2.39 Hypertension 0.357 0.66 0.27-1.61 Smoking 0.472 1.37 0.58-3.19
Prior stroke TIA 0.726 0.67 0.07-6.41
Prior CABG 0.488 2.00 0.28-14.2 Prior PCI 0.189 1.78 0.75-4.21 eGFR 0.83 1.00 0.99-1.01 N of vessels treated 0.79 0.89 0.39-2.02 Vessel treated 0.011 0.58 0.37-0.88 Lesion type B2 or C 0.312 0.68 0.32-1.44 Bifurcation 0.910 1.07 0.32-3.59 Proximal 0.545 1.25 0.61-2.54 Mid-coronary 0.454 0.75 0.37-1.59 Distal 0.850 0.90 0.29-2.75
ACS 0.868 0.92 0.35-2.45 Overlap 0.054 3.93 0.98-15.77 Prasugrel 0.04 0.39 0.16-0.96 Ticagrelor 0.147 1.89 0.8-4.48 MLD 0.826 0.92 0.41-2.02 RVD 0.001 0.22 0.08-0.55
% Stenosis before PCI 0.618 0.99 0.97-1.02
MLD after PCI 0.000 0.09 0.03-0.28
RVD after PCI 0.000 0.1 0.03-0.31
Residual stenosis 0.182 1.03 0.991.07
Scaled residual stenosis 0.000 462.92 20.15-10634.73
Maximum footprint 0.000 1.16 1.08-1.25
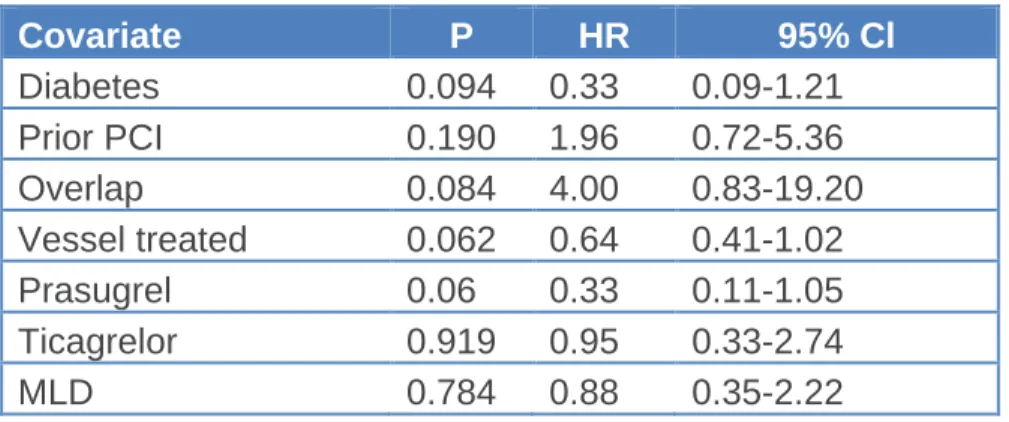
Table 3. Multivariable analysis including MLD before PCI.
Covariate P HR 95% Cl Diabetes 0.094 0.33 0.09-1.21 Prior PCI 0.190 1.96 0.72-5.36 Overlap 0.084 4.00 0.83-19.20 Vessel treated 0.062 0.64 0.41-1.02 Prasugrel 0.06 0.33 0.11-1.05 Ticagrelor 0.919 0.95 0.33-2.74 MLD 0.784 0.88 0.35-2.22
Table 4. Multivariable analysis including RVD before PCI
Covariate P HR 95% Cl
Prior PCI 0.198 1.94 0.71-5.35 Overlap 0.064 4.86 0.91-25.81 Vessel treated 0.167 0.70 0.42-1.16 Prasugrel 0.208 0.48 0.15-1.51 Ticagrelor 0.797 1.16 0.37-3.67 RVD 0.014 0.27 0.1-0.77
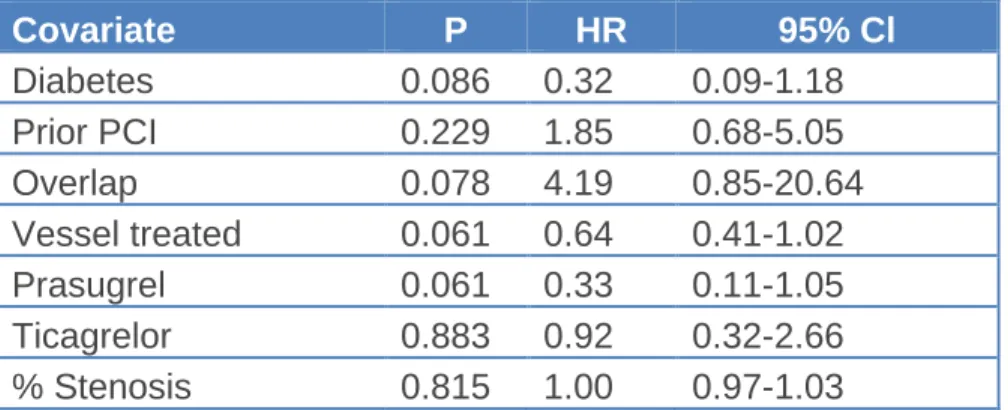
Table 5. Multivariable analysis including the % stenosis before PCI
Covariate P HR 95% Cl Diabetes 0.086 0.32 0.09-1.18 Prior PCI 0.229 1.85 0.68-5.05 Overlap 0.078 4.19 0.85-20.64 Vessel treated 0.061 0.64 0.41-1.02 Prasugrel 0.061 0.33 0.11-1.05 Ticagrelor 0.883 0.92 0.32-2.66 % Stenosis 0.815 1.00 0.97-1.03
Table 6. Multivariable analysis including the MLD after PCI
Covariate P HR 95% Cl Diabetes 0.157 0.35 0.08-1.51 Prior PCI 0.162 2.40 0.70-8.19 Overlap 0.106 4.31 0.74-25.32 Vessel treated 0.247 0.72 0.41-1.26 Prasugrel 0.354 0.55 0.15-1.97 Ticagrelor 0.33 2.06 0.49-8.65 POST MLD 0.001 0.05 0.01-0.28
Table 7. Multivariable analysis including the RVD after PCI
Covariate P HR 95% Cl
Diabetes 0.184 0.41 0.11-1.53
Prior PCI 0.453 1.51 0.52-4.42
Vessel treated 0.459 0.82 0.48-1.39
Prasugrel 0.315 0.53 0.15-1.83
Ticagrelor 0.542 1.48 0.42-5.26
POST RVD 0.002 0.13 0.04-0.46
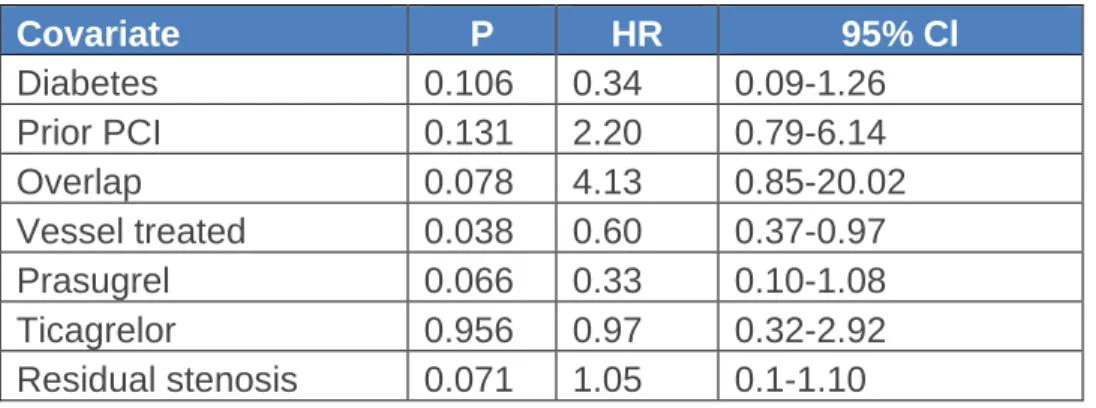
Table 8. Multivariable analysis including the residual stenosis after PCI
Covariate P HR 95% Cl Diabetes 0.106 0.34 0.09-1.26 Prior PCI 0.131 2.20 0.79-6.14 Overlap 0.078 4.13 0.85-20.02 Vessel treated 0.038 0.60 0.37-0.97 Prasugrel 0.066 0.33 0.10-1.08 Ticagrelor 0.956 0.97 0.32-2.92 Residual stenosis 0.071 1.05 0.1-1.10
Table 9. Multivariable analysis including the scaled residual stenosis after PCI
Covariate P HR 95% Cl Diabetes 0.192 0.39 0.09-1.61 Prior PCI 0.146 2.36 0.74-7.49 Overlap 0.072 5.40 0.86-33.93 Vessel treated 0.179 0.69 0.4-1.19 Prasugrel 0.255 0.48 0.14-1.69 Ticagrelor 0.401 1.81 0.45-7.23 Scaled residual stenosis 0.001 1714.38 20.07-146454.09
Talble 10. Multivariable analysis including the maximum footprint
Covariate P HR 95% Cl Diabetes 0.136 0.30 0.06-1.47 Prior PCI 0.152 2.43 0.72-8.2 Overlap 0.149 3.81 0.62-23.47 Vessel treated 0.176 0.68 0.39-1.19 Prasugrel 0.371 0.54 0.14-2.06 Ticagrelor 0.393 1.85 0.45-7.65 Maximum footprint 0.001 1.20 1.08-1.33
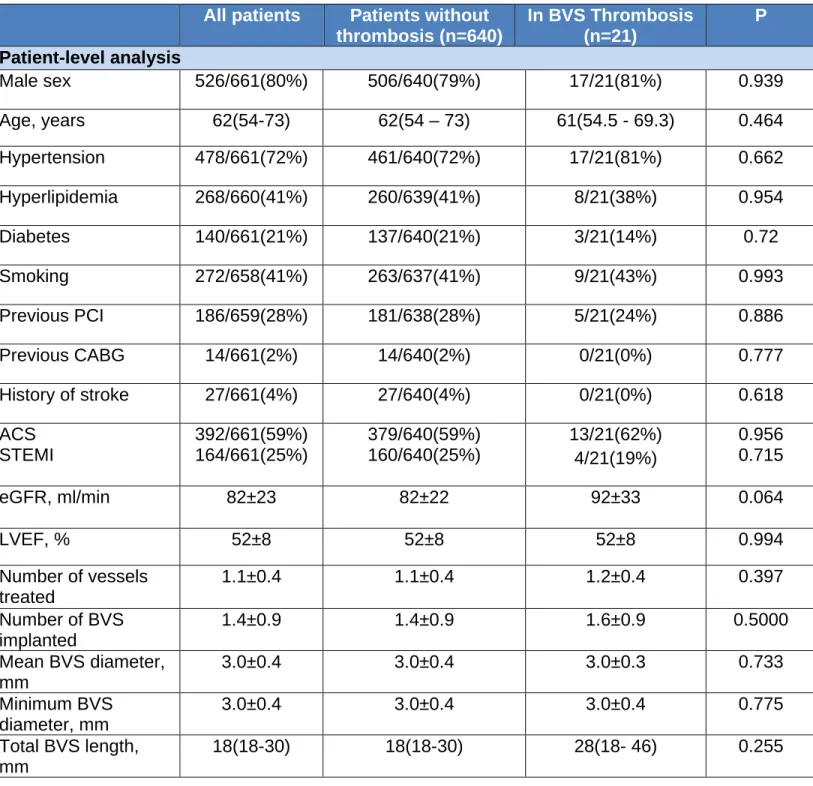
Table 11. Implantation protocol analysis – patient and lesion characteristics divided by the presence or absence of ScT during follow-up.
All patients Patients without
thrombosis (n=640) In BVS Thrombosis (n=21) P Patient-level analysis Male sex 526/661(80%) 506/640(79%) 17/21(81%) 0.939 Age, years 62(54-73) 62(54 – 73) 61(54.5 - 69.3) 0.464 Hypertension 478/661(72%) 461/640(72%) 17/21(81%) 0.662 Hyperlipidemia 268/660(41%) 260/639(41%) 8/21(38%) 0.954 Diabetes 140/661(21%) 137/640(21%) 3/21(14%) 0.72 Smoking 272/658(41%) 263/637(41%) 9/21(43%) 0.993 Previous PCI 186/659(28%) 181/638(28%) 5/21(24%) 0.886 Previous CABG 14/661(2%) 14/640(2%) 0/21(0%) 0.777 History of stroke 27/661(4%) 27/640(4%) 0/21(0%) 0.618 ACS STEMI 392/661(59%) 164/661(25%) 379/640(59%) 160/640(25%) 13/21(62%) 4/21(19%) 0.956 0.715 eGFR, ml/min 82±23 82±22 92±33 0.064 LVEF, % 52±8 52±8 52±8 0.994 Number of vessels treated 1.1±0.4 1.1±0.4 1.2±0.4 0.397 Number of BVS implanted 1.4±0.9 1.4±0.9 1.6±0.9 0.5000 Mean BVS diameter, mm 3.0±0.4 3.0±0.4 3.0±0.3 0.733 Minimum BVS diameter, mm 3.0±0.4 3.0±0.4 3.0±0.4 0.775 Total BVS length, mm 18(18-30) 18(18-30) 28(18- 46) 0.255
Overlap 86/650(13%) 82/630 4/20 0.567 Total BVS surface, cm2 1.97(1.81-3.08) 1.97(1.81-3.08) 2.76(1.81 - 4.69) 0.066 Total outer BVS surface, cm2 0.58(0.52-0.91) 0.58(0.52-0.91) 0.79(0.52 - 1.36) 0.067 IIbIIIa inhibitors 176/660(27%) 172/640 4/20 0.666 DAPT Type Clopidogrel Prasugrel Ticagrelor 200/661(30%) 331/661(50%) 128/661(19%) 197/640 319/640 122/640 3/21 12/21 6/21 0.548 0.168 0.663 0.421 Predilation 656/661(99%) 636/640 20/21 0.2869 Postdilation 365/656(56%) 354/636 11/20 0.865 Lesion-level analysis N=764 N=21 Lesion type B2 or C 327/785(42%) 315/764 12/21 0.217 Bifurcation lesion 96/673(14%) 94/655 2/18 0.926 Ostial lesion 60/785(8%) 55/764 5/21 0.016
Table 12. Implantation protocol – patient and lesion characteristics divided by treatment group.
Early experience group (n=369) BVS implantation protocol (n=292) P Patient-level analysis Male sex 293/369(80%) 230/292(79%) 0.788 Age, years 62(54–73) 62(54-72) 0.775 Hypertension 252/369(68%) 226/291(78%) 0.008 Hyperlipidemia 135/369(37%) 133/290(46%) 0.020 Diabetes 68/369(18%) 72/291(25%) 0.061 Smoking 161/369(44%) 111/290(38%) 0.182 Previous PCI 101/368(27%) 85/291(29%) 0.168 Previous CABG 11/368(3%) 3/291(1%) 0.146 History of stroke 16/367(4%) 11/291(4%) 0.86 ACS STEMI 215/369(58%) 100/369(27%) 177/292(61%) 64/292(22%) 0.572 0.150 eGFR, ml/min 84±24 81±22 0.116 LVEF, % 54±8 51±9 0.001 Number of vessels treated 1.1±0.4 1.1±0.4 0.182 Number of BVS implanted 1.5±0.9 1.4±0.9 0.493 Mean BVS diameter, mm 3.0±0.4 3.0±0.4 0.172 Minimum BVS diameter, mm 2.90.4 3.0±0.4 0.193 Total BVS length, mm 27.8±18.5 27.7±19.3 0.944 Overlap 35/365(10%) 51/285(18%) 0.003
Total BVS surface, cm2 1.97(1.81 – 3.08) 1.81(1.35 – 2.76) 0.637 Total outer BVS surface, cm2 0.58(0.52 – 0.91) 0.58(0.40 – 0.79) 0.647 IIbIIIa inhibitors 99/368(27%) 77/291(26%) 0.485 Clopidogrel Prasugrel Ticagrelor 112/369(30%) 169/369(46%) 87/369(24%) 88/292(30%) 162/292(55%) 41/292(14%) 0.511 0.017 0.003 Predilation 367/368(100%) 289/292(99%) 0.330ǂ Postdilation 111/364(30%) 254/292(87%) 4*10-51 Lesion-level analysis Lesion type B2 or C 193/430(45%) 137/355(39%) 0.089 Bifurcation lesion 74/343(21%) 22/330(7%) 0.001 Ostial lesion 31/430(7%) 29/354(8%) 0.712 ǂFisher´s test
Figures
Figure 1. Incidence of ScT in the four centers. No difference was observed.
1. Gori TS, E; Hink, U; Kress, M; Weiers, N; Weissner, M; Jabs, A; Wenzel, P; Capodanno, D; Münzel, T. Clinical, Angiographic, Functional and Imaging Outcomes 12 Months after Implantation of Drug-Eluting Bioresorbable Vascular Scaffolds in Acute Coronary Syndromes. JACC
Cardiovascular interventions 2015.
2. Garcia-Garcia HM, Serruys PW, Campos CM et al. Assessing bioresorbable coronary devices: methods and parameters. JACC Cardiovascular imaging 2014;7:1130-48.
3. Gori T, Schulz E, Hink U et al. Early outcome after implantation of Absorb bioresorbable drug-eluting scaffolds in patients with acute coronary syndromes. EuroIntervention : journal of EuroPCR in collaboration with the Working Group on Interventional Cardiology of the European Society of Cardiology 2014;9:1036-41.
4. Gori T, Schulz E, Munzel T. Immediate, acute, and subacute thrombosis due to incomplete expansion of bioresorbable scaffolds. JACC Cardiovascular interventions 2014;7:1194-5.
5. Brown AJ, McCormick LM, Braganza DM, Bennett MR, Hoole SP, West NE. Expansion and
malapposition characteristics after bioresorbable vascular scaffold implantation. Catheterization and cardiovascular interventions : official journal of the Society for Cardiac Angiography & Interventions 2014;84:37-45.
6. Tamburino C, Latib A, van Geuns RJ et al. Contemporary practice and technical aspects in coronary intervention with bioresorbable scaffolds: a European perspective. EuroIntervention : journal of EuroPCR in collaboration with the Working Group on Interventional Cardiology of the European Society of Cardiology 2015;10.
7. Ong DS, Jang IK. Causes, assessment, and treatment of stent thrombosis-intravascular imaging insights. Nature reviews Cardiology 2015.