HAL Id: hal-01096408
https://hal-iogs.archives-ouvertes.fr/hal-01096408
Submitted on 17 Dec 2014
HAL is a multi-disciplinary open access
archive for the deposit and dissemination of
sci-entific research documents, whether they are
pub-lished or not. The documents may come from
teaching and research institutions in France or
abroad, or from public or private research centers.
L’archive ouverte pluridisciplinaire HAL, est
destinée au dépôt et à la diffusion de documents
scientifiques de niveau recherche, publiés ou non,
émanant des établissements d’enseignement et de
recherche français ou étrangers, des laboratoires
publics ou privés.
Revisiting of LED pumped bulk laser: first
demonstration of Nd:YVO4 LED pumped laser
Adrien Barbet, François Balembois, Amandine Paul, Jean-Philippe Blanchot,
Anne-Lise Viotti, Jacques Sabater, Frédéric Druon, Patrick Georges
To cite this version:
Adrien Barbet, François Balembois, Amandine Paul, Jean-Philippe Blanchot, Anne-Lise Viotti,
et al..
Revisiting of LED pumped bulk laser: first demonstration of Nd:YVO4 LED pumped
laser. Optics Letters, Optical Society of America - OSA Publishing, 2014, 39 (23), pp.6731-6734.
�10.1364/OL.39.006731�. �hal-01096408�
Revisiting of LED pumped bulk laser: first
demonstration of Nd:YVO
4
LED pumped laser
Adrien Barbet,1,* François Balembois,1 Amandine Paul,2 Jean-Philippe Blanchot,2 Anne-Lise Viotti,2 Jacques Sabater,2 Frédéric Druon,1 and Patrick Georges1
1Laboratoire Charles Fabry, UMR 8501, Institut d’Optique, CNRS, Université Paris-Sud, 2 Avenue Augustin Fresnel, 91127
Palaiseau Cedex, France
2Effilux, 7 Avenue de l’Atlantique, 91940 Les Ulis, France
*Corresponding author: adrien.barbet@institutoptique.fr
We describe here what is, to the best of our knowledge, the first LED pumped Nd:YVO4 laser. Near-IR LED arrays with a
wavelength centered close to 850 nm were used to pump transversely the crystal. By pulsing LEDs, with a duration of the order of the laser transition lifetime, we obtained sufficient pump intensities to reach the laser threshold. At a frequency of 250 Hz, we obtained an output energy of 40 µJ at 1064 nm for an input pump energy of 7.4 mJ, which corresponds to an optical efficiency of 0.5%. Experimental results of small signal gain are compared with theoretical analysis. © 2014 Optical Society of America
OCIS Codes: (140.3530) Lasers, neodymium, (140.3580) Lasers, solid-state, (140.3460) Lasers, (140.3410) Laser resonators, (230.3670) Light-emitting diodes
http://dx.doi.org/10.1364/OL.39.006731
After the first demonstration of the flashlamp pumped ruby laser by Maiman [1], LED pumping was demonstrated for the first time in 1964 in Dy:CaF2 crystal
[2]. In the 1970s, different works on neodymium lasers (such as Nd:YAG or Nd-pentaphosphate) were published with LED as the pump source [3–8]. Laser effect was also demonstrated with an LED pumped Yb:YAG crystal [9]. LED pumped solid-state lasers were generally cooled below room temperature to increase the emission cross section of the gain media, LEDs’ efficiency, and hence the laser efficiency.
At the beginning of the 1980s, LED pumping was progressively forsaken with the emergence of laser diodes. Thanks to their high efficiency and brightness, they rapidly became the favorite way to pump solid-state lasers. However, driven by the lighting market, LED performance have been recently improved by order of magnitudes. Starting from intensity of 0.1 to 10 W/cm2 at
cryogenic temperatures in the 70s, it now reaches up to 100 W/cm2 (in continuous wave at 1 A) at room
temperature with efficiencies greater than 200 lm/W [10]. In parallel, LED prices experienced a dramatic drop because of a massive production. Moreover, contrary to laser diodes, LEDs are less sensitive to electrostatic discharges and have a lifetime 3 to 4 times higher than laser diodes.
Those improvements have triggered a new interest and LED pumping has started to be revisited since 2008. Turnbull and co-workers [11,12] took the opportunities offered by high performance visible blue LED to pump
polymer lasers. By pulsing LEDs during few tens of ns, they succeeded to inject up to 160 A, leading to a LED optical intensity of 255 W/cm2 at 450 nm and
demonstrated a laser effect at 568 nm from a polymer distributed feedback laser. Htein et al. [13,14] used a white LED to exploit all absorption bands of erbium and neodymium doped fibers in the visible range. They obtained 12 dB (at 1550 nm) and 6 dB (at 1400 nm) of amplification gain. Liu et al. [15] demonstrated a laser effect from a semiconductor monolithically pumped by a LED which operates in a thermoelectrophotonic regime.
Surprisingly, LED pumping of bulk crystals as in the pioneer ages has not been revisited yet. Recently, a Korean team studied theoretically the pumping of five gain media (Nd:YAG, Nd:glass, Nd/Cr:YAG, Ti:sapphire and solid dye) by two types of LEDs, white and blue [16], but gave no experimental demonstration of laser effect.
Furthermore, it is worth noting that many results were reported on LED pumped Nd:YAG lasers but nothing with Nd:YVO4 crystals (probably partly because a YVO4
matrix appeared after the vanishing of LED pumping). Compared to Nd:YAG, the product of the emission cross section by the lifetime is still two times higher and can, therefore, produce a much higher optical gain. Consequently, Nd:YVO4 lasers combined with new
intensities of today’s LEDs should result in promising performance. In this Letter, we investigate both experimentally and theoretically an Nd:YVO4 laser
Fig. 1. Spectral deformation with respect to the injected current and Nd:YVO4 absorption bands for 1 at. %
doping concentration [23].
Fig. 2. Evolution of the pump energy emitted by the two LED arrays as a function of the repetition rate. Inset: illustration of the LED array.
Fig. 3. Experimental setup.
As pump source, we used near-IR LEDs centered at 850 nm from Light Avenue. A dice of 1 mm by 1 mm emits an intensity of 25 W/cm2 at a continuous drive current of 1 A.
Basic calculations based on small signal gain (see below for theory) show that this value is currently too low to reach the laser threshold. Therefore, we operated the LEDs in pulsed regime. The current driven by PCO-6131 (Directed Energy, Inc) injected into the LEDs had a square shape, with a pulse duration of 100 µs (in accordance to the Nd:YVO4 lifetime). By increasing the
current, each chip emits a peak output intensity of 200 W/cm2 at 40 A, eight times higher than in the CW
operation. Beyond this current, the one mil (≈ 25 µm) gold wires between the dices and the electrical track evaporated. In pulsed operation, we measured the emission spectrum (Fig. 1) and found that the spectral width increases from 35 nm to 60 nm between 10 and 40 A. This effect can be explained by the temperature increase of the LEDs at high current values.
An LED array consists in a line of 18 1 mm x 1 mm chips. We used two arrays of LED, on two opposite sides of the laser crystal. Each chip is separated by 0.3 mm from each other (illustrated in the inset of the Fig. 2). Each LED array is placed on a water cooled copper mount to reduce the LED heating. We studied the energy contained in a 100 µs pulse at 40 A as a function of the repetition rate of the LEDs. Figure 2 illustrates this measurement for all the LEDs. We observed that, at this current, the energy was stable (around 7.4 mJ) for frequencies below 250 Hz and began to drop slightly for higher frequencies to finally stop to emit above 400 Hz. At
this frequency and this current, the gold wires melt. This is why all our measurements have been done far below this value (namely 250 Hz).
As the emission diagram of LED is lambertian, it is very difficult to collect all the emitted flux with optics. It is nearly impossible to focus the LED beam with a higher intensity (in W/cm2) than the intensity at the surface of
the dice itself. Therefore, we chose to design a pumping configuration without optics, the LED beam being close coupled in the laser crystal. To increase the number of LED, we use a transverse pumping configuration to distribute the LED all along the crystal faces in a setup described on Fig. 3.
The laser crystal is an a-cut 20 mm long Nd:YVO4
crystal with a doping concentration of 1 at.% and a 2 mm x 2 mm square section. The orientation of the crystal has been picked to maximize the absorption, that is to say that the pumping is done along the (a,c) axes. The doping concentration has been chosen to be as high as possible while avoiding concentration quenching [17,18]. Two transverse faces are polished for the pumping. However, the transverse faces are not AR coated. The two other faces are used to cool the crystal. As the large emission cross section of Nd:YVO4 is very sensitive to temperature
changes [19,20], the crystal is held by two water cooled copper mounts to extract the heat induced by the pumping. Both crystal laser facets are AR coated with a reflectivity below 0.1% at 1064 nm. We designed a plano-concave cavity with an HR coated end mirror having a radius of curvature of 500 mm and a plane output coupler. The cavity length can be adjusted from 200 to 500 mm to optimize the output energy.
First, we measured the performance of our system for different transmissions of the output coupler (Fig. 4). Our best results have been obtained with a 1% transmission output coupler. In this configuration, we found a pump energy threshold of 1.84 mJ and obtained nearly 40 µJ of laser energy for an input energy of 7.4 mJ at a repetition rate of 250 Hz. This corresponds to an optical efficiency between the laser energy and the total energy emitted by the LEDs of 0.5%. Additionally, we studied the spatial profile of our laser by imaging the beam waist with a 75 mm focal length lens in a 2f-2f configuration. We measured an M2 factor of 19, corresponding to the large
pump volume related to the transverse pumping configuration. We have also monitored the laser pulse shape (Fig. 4). For a pump pulse duration of 100 µs, the laser pulse is about 65 µs long at 40 A. We clearly observe the transient buildup of the laser with the spiking behavior at the beginning of the pulse. Then, the laser converges to a continuous value in the second half of the pulse, corresponding to the quasi-continuous regime.
Fig. 4. Evolution of the output energy as a function of the input pump energy. Inset: spatial and temporal profiles of the laser beam at a pump energy of 7.4 mJ.
Fig. 5. Theoretical and experimental small-signal gain as a function of the pump energy Eem,th needed to reach
the laser threshold for, different output couplers.
Fig. 6. Transversal view of the pumping scheme with the crystal at the center and the LED arrays on two opposite sides. X & Y are two key spatial parameters.
Subsequently, to explore the maximal gain available, we progressively increased the transmission of the output coupler and noted the corresponding pump energies required to reach the laser threshold. Figure 5 illustrates the small-signal gain G0 as a function of the pump energy
at the laser threshold. We obtained a single pass small signal gain G0 up to 1.042. The solid and dash curves
represent the theoretical evolutions from our simulations presented in the following paragraph.
To calculate the small signal gain available with this LED pumped system, we used the gain coefficient (cm-1)
described by Eq. (1), taking into account that LEDs are non-monochromatic sources: 𝑔 = 𝑛𝑡𝜎𝑒𝑙𝜏 ℎ𝑐 ∫ 𝜎𝑎𝑝(𝜆𝑝)𝜆𝑝 𝑑𝐼𝑝 𝑑𝜆𝑝𝑑𝜆𝑝 𝜆𝑝2 𝜆𝑝1 (1)
where 𝑛𝑡 is the total population density of Nd3+ ions in the
YVO4, 𝜎𝑎𝑝 is the absorption cross section at the pump
wavelength, 𝜎𝑒𝑙 is the emission cross section at the laser
wavelength, 𝐼𝑝 is the pump intensity (in W/cm2), 𝜆𝑝 is the
pump wavelength, ℎ is the Planck constant, 𝑐 is the speed of light in vacuum, and 𝜏 is the lifetime of the laser transition. Finally, as the pump pulse duration (100 µs) is the same order as the lifetime of Nd in YVO4 (90 µs), the
real gain is not the steady-state gain. To take the transient buildup into account, we defined a gain coefficient 𝑔′ at the end of the pump pulse to be
𝑔′= 𝑔 (1 − 𝑒−∆𝑡𝜏) (2)
where Δt is the pump pulse duration. Considering L as the crystal length, we can now calculate the small-signal gain G0 (in single pass):
𝐺0= 𝑒𝑔′𝐿 (3)
Crystal losses 𝛼 were assumed to be negligible. Thus, we deduce from the relations (1) and (3) that we need to know 𝐼𝑝 at any point in the crystal to have access to G0.
Thereby, we have used a ray tracing software (LightTools) which allowed us to simulate our system numerically [21]. After entering all the parameters, we have access to the pump intensity at any points in the crystal and are able to determine the repartition of laser gain inside the crystal.
These simulations allow us to highlight the effects of the LED’s spectrum on the gain. Indeed, on the Fig. 5, the dashed line represents the theoretical evolution of the small signal gain when we consider a 35 nm wide spectrum (corresponding to 10 A driving current) regardless of the injected current, while the solid line is the result when we take into account the broadening of the spectrum versus the driving current. Thus, we deduce from our simulations that the LED spectral broadening is a critical parameter, strongly limiting the small signal gain and hence the laser performance.
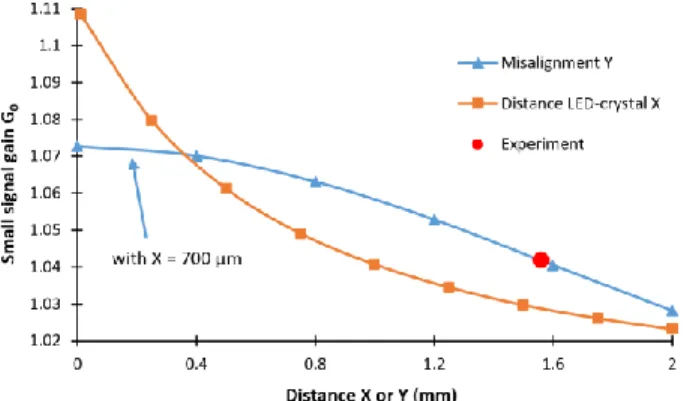
Since the simulation was validated by experimental data in Fig. 5, it became a tool to investigate the influence of other key parameters coming from the pump geometry, namely the distance between the LED and the crystal (parameter X described in Fig. 6) and the misalignment between the two LED arrays, called Y.
First, Fig. 7 shows that the small signal gain is very sensitive to the distance X between the LED arrays and the crystal; since the incident pump intensity (W/cm²) depends on the square of the distance to the crystal, a small increase of the LED-crystal distance can lead to an important decrease of the gain inside the crystal. In our setup, the working distance cannot be less than 700 µm due to the protective glass and the bond line (see Fig. 6); this reduces the gain by a factor of 0.5 compared to the maximum value (reached when the LEDs and the crystal are very close).
Gain evolution with a misalignment Y between the LEDs is less sensitive. However, one has to control this parameter carefully since a misalignment of 1 mm
Fig. 7. Evolution of the theoretical small signal gain G0
as a function of the misalignment between the two LEDs (Y) and the distance between LEDs and the crystal (X). This calculations are used to estimate the misalignment Y in our experiment.
(namely half of the crystal size) between each LED array and the crystal can reduce the gain by 20%. This curve has been done with X set to 700 µm (the real distance between the crystal and LEDs), allowing us to place our experimental point on this curve. This gives an estimation of the LED misalignment in our setup: close to 1.5 mm. This high value can be explained by the setup itself having no controlled adjustment to move the LED arrays precisely.
Our simulation can also estimate the absorbed energy. Indeed, only 78% of the LED energy reaches the crystal because of the distance between the latter and the LEDs. Then, another 10% are lost because of the non-AR coated pumped crystal faces. Moreover, as anticipated in Fig. 1, the absorption is relatively weak. It is partially compensated by the optical path inside the crystal by non-perpendicular rays or rays being trapped by total internal reflection. Taking in account all the rays coming from the LEDs, we estimated using LightTools that 30% of the pump energy is absorbed. Hence, from the 7.4 mJ emitted by the LED, only 1.5 mJ is really absorbed. This leads to an optical efficiency of 2.6% related to the absorbed energy.
To increase the output energy and efficiency, there are several possible axes of improvement. As presented in Fig. 7, a chip on board LED with shorter working distance would allow a better pump coupling into the crystal. Also, LEDs with same intensity but with a spectrum centered near the 808 nm absorption band instead of 850 nm could widely improve the results.
Energy scaling may also be considered by using double stack LEDs emitting 1.6 times more than single LEDs for the same emitting area [22]. In addition, it could be possible to use 2 lines of 18 LEDs to have a pump area as large as the transverse dimension of the crystal. It may be also possible to use dices with bigger gold wires, which would allow to operate the LED at higher currents and higher repetition rates.
In conclusion, we have demonstrated that it is possible to create a laser effect, at a room temperature, from a Nd:YVO4 laser transversely pumped by LED near
850 nm. To the best of our knowledge, this gain medium was never LED pumped before this work and represents
the first LED pumped Nd:YVO4 laser. We obtained 40 µJ
at a frequency of 250 Hz. The corresponding optical efficiency is about 0.5% (2.6% related to the absorbed energy). LED lighting is a very active and growing market, constantly improving the LED performance. This first demonstration with Nd:YVO4 shows that it will be
worth to consider LED pumping of bulk crystals in the future, particularly in the visible range where LED are highly optimized.
The authors acknowledge the Agence Nationale de la Recherche (EDELVEIS project), the Labex PALM and the Conseil Régional d’Ile de France for the funding of this research.
References
1. T. Maiman, Nature, 187, 494 (1960).
2. S. A. Ochs and J. I. Pankove, in Proceedings of the IEEE, p. 713 (1964).
3. R. B. Allen and S. J. Scalise, Appl. Phys. Lett., 14, 188 (1969).
4. F. W. Ostermayer, Appl. Phys. Lett., 18, 93 (1971).
5. G. I. Farmer and Y. C. Kiang, J. Appl. Phys., 45, 1356 (1974).
6. M. Saruwatari, T. Kimura, T. Yamada, and J. Nakano, Appl. Phys. Lett., 27, 682 (1975).
7. J. Stone, C. a. Burrus, a. G. Dentai, and B. I. Miller, Appl. Phys. Lett., 29, 37 (1976).
8. V. Bilak and I. Goldobin, Sov. J. Quantum Electron., 11, 1471 (1981).
9. A. R. Reinberg, L. A. Riseberg, R. M. Brownn R. W. Wacker, W. C. Holton, Appl. Phys. Lett., 19, 11 (1971). 10. Led. Magazine, “Lab record: red LED breaks through the
200 lm/W barrier” (2011).
11. Y. Yang, G. a. Turnbull, and I. D. W. Samuel, Appl. Phys. Lett., 92, 163306 (2008).
12. J. Herrnsdorf, Y. Wang, J. J. D. McKendry, Z. Gong, D. Massoubre, B. Guilhabert, G. Tsiminis, G. a. Turnbull, I. D. W. Samuel, N. Laurand, E. Gu, and M. D. Dawson, Laser Photon. Rev., 7, 1065 (2013).
13. L. Htein, W. Fan, P. R. Watekar, and W.-T. Han, Opt. Lett., 37, 4853 (2012).
14. L. Htein, W. Fan, P. Wateker, and W. Han, IEEE Photonics Technol. Lett., 25, 1081 (2013).
15. X. Liu, G. Zhao, Y. Zhang, and D. G. Deppe, Appl. Phys. Lett., 102, 081116 (2013).
16. K. Lee, S. Bae, J. S. Gwag, J. H. Kwon, and J. Yi, J. Korean Phys. Soc., 59, 3239 (2011).
17. Z. Huang, Y. Huang, Y. Chen, and Z. Luo, JOSA B, 22, 2564 (2005).
18. A. Sennaroglu, Opt. quantum Electron., 32, 1307 (2000). 19. X. Délen, F. Balembois, and P. Georges, J. Opt. Soc. Am.
B, 28, 972 (2011).
20. Y. Sato and T. Taira, Opt. Mater. Express, 2, 1076 (2012). 21. S. O. Solutions, “LightTools.”
22. OSRAM Opto Semiconductors, “LED SFH 4715S.” 23. L. Mcdonagh, R. Wallenstein, R. Knappe, and A. Nebel,