HAL Id: hal-02613756
https://hal.archives-ouvertes.fr/hal-02613756
Submitted on 19 Jun 2020
HAL is a multi-disciplinary open access
archive for the deposit and dissemination of
sci-entific research documents, whether they are
pub-lished or not. The documents may come from
teaching and research institutions in France or
abroad, or from public or private research centers.
L’archive ouverte pluridisciplinaire HAL, est
destinée au dépôt et à la diffusion de documents
scientifiques de niveau recherche, publiés ou non,
émanant des établissements d’enseignement et de
recherche français ou étrangers, des laboratoires
publics ou privés.
Conformational Landscape of Oxygen-Containing
Naphthalene Derivatives
Manuel Goubet, Marie-Aline Martin-Drumel, Florent Réal, Valérie Vallet,
Olivier Pirali
To cite this version:
Manuel Goubet, Marie-Aline Martin-Drumel, Florent Réal, Valérie Vallet, Olivier Pirali.
Conforma-tional Landscape of Oxygen-Containing Naphthalene Derivatives. Journal of Physical Chemistry A,
American Chemical Society, 2020, 124, pp.4484-4495. �10.1021/acs.jpca.0c01188�. �hal-02613756�
Conformational Landscape of Oxygen-Containing
Naphthalene Derivatives
Manuel Goubet
1, Marie-Aline Martin-Drumel
2, Florent Réal
1, Valérie Vallet
1, and Olivier Pirali
21Université Lille, CNRS, UMR 8523-PhLAM-Physique des Lasers, Atomes et Molécules, F-59000 Lille, France 2Université Paris-Saclay, CNRS, Institut des Sciences Moléculaires d’Orsay, 91405 Orsay, France
Contact corresponding author(s):[email protected],[email protected]
Accepted article
Polycyclic aromatic compounds (PACs) constitute an important class of molecules found in various environ-ments and are considered important pollutants of the Earth’s atmosphere. In particular, functionalization of PACs modify the ring aromaticity, which greatly influences the chemical reactivity of these species. In this work we studied several oxygen-containing PACs, relevant to atmospheric chemistry. We investigated the conforma-tional landscape of four naphthalene-derivative molecules — namely ,1- and 2-hydroxynaphthalene and 1- and 2-naphthaldehyde — by means of rotational and vibrational spectroscopy supported by quantum chemical calcu-lations. For 1-hydroxynaphthalene and 1-naphthaldehyde, intramolecular hydrogen bonding and steric effects drive the conformational preferences while for 2-hydroxynaphthalene and 2-naphthaldehyde, the charge distribu-tions allow us to understand the conformational landscape. This work not only demonstrates how the localization of the substitution group in the ring influences the conformational relative energies and but also constitutes a step toward a better understanding of the different chemical reactivity of such functionalized PACs.
1. Introduction
Polycyclic aromatic compounds (PACs), which represent about two-thirds of the so far known chemical compounds [1], are of high relevance in diverse fields ranging from astrophysics and atmospheric chemistry to combustion science. Within this very rich class of molecules, purely carbonaceous species (also called polycyclic aromatic hydrocarbons, PAHs) may be those that have received the most attention in the laboratory so far, in part driven by astrophysical motivations (see, e.g., the re-view by Tielens [2]). Indeed, since the early hypothesis for-mulated by Léger & Puget [3] and Allamandola etal. [4], PAH molecules are suspected to be abundantly present in the inter-stellar medium. Their neutral, ionized, and radical forms have been suggested as carriers of many broad absorption and emis-sion features observed in various objects of the universe (see, e.g., Ref 5). Besides PAHs, functionalized variants are rele-vant to many scientific fields as well. Recently, several pure rotational transitions of a functionalized aromatic compound, benzonitrile (C6H5– CN), have been unambiguously detected
in the spectrum of the TMC-1 molecular cloud [6], confirming the presence of PACs in the interstellar medium.
PAC molecules also constitute an important class of
pollu-tants of the Earth’s atmosphere; they originate mainly from incomplete combustion processes (e.g., residential heating, ve-hicle exhausts) and can be found both in gas and in particle phases [7]. Functionalized species can either be direct products of such combustion processes or secondary products resulting from oxidation of primary PAH species. Recent studies that aimed at measuring the seasonal variations in the abundances of more than 80 PACs in an urban environment highlighted both the importance of such species for Earth’s atmosphere sci-ence and the concern raised by their influsci-ence on atmospheric chemistry and, to some extent, human health [8]. In the at-mosphere, oxygen-containing PACs are almost as abundant as PAHs while their vapor pressures are about 10 times lower than their corresponding parent PAH species and therefore consti-tute an important class of aerosol precursors [9,10]. Despite their relevance to Earth’s atmosphere, very little is known con-cerning the spectroscopy and structural information on these compounds, preventing both their efficient tracking and a better understanding of their formation/destruction chemical networks. Aside from the importance of PACs in atmospheric science and astrophysics, fundamental questions regarding the influ-ence of a functional group on aromaticity remain open. Indeed,
while PAHs are relatively chemically stable compounds, when functionalized their reactivity either increases or decreases dras-tically. Substitution of a hydrogen by a functional group, either electron-withdrawing or electron donor, obviously breaks the symmetric electronic distribution over the ring, modifying its affinity for electrophilic attack. For instance, PACs containing hydroxyl or amino groups (activating groups) are more reactive than the corresponding, nonfunctionalized, PAHs. Conversely, PACs containing aldehyde or nitro groups (deactivating groups) are less reactive than their parent PAHs. In addition to their influence on chemical reactivity, functionalized PACs tend to be more easily adsorbed than their PAHs counterparts [11], reveal-ing an increased affinity for long-range polar interactions. At the molecular level, the addition of functional groups decreases the degree of symmetry of most PACs. If the functional group is itself asymmetric, at least two conformers (distinct by a 180° rotation around the bond linking the functional group to the PAHs fragment) will coexist but will not be isoenergetic for reasons that deserve elucidation. Such conformational energy differences are particularly small and can only be captured by highly accurate quantum chemical calculations.
In this work, pure rotation spectroscopy in the centime-ter and millimecentime-ter wave regions together with vibrational spectroscopy in the infrared (IR) range have been used to characterize four oxygen containing (two hydroxyls and two aldehydes) functionalized naphthalene molecules, namely, 1- and 2-hydroxynaphthalene (C10H7– OH), and 1- and
2-naphthaldehyde (C10H7– C(O)H). Electronic structure
calcu-lations have been undertaken not only to support the spectral analyses but also to elucidate the conformational preferences. The present study provides valuable data enabling the confident search for these species in the Earth’s atmosphere and interstel-lar medium. Finally, in light of the experimental and theoretical results, the stability of the different isomers and conformers is discussed in terms of asymmetric charges distribution, pro-viding some insights into the influence of functional groups on aromaticity at the molecular level.
2. Laboratory Methods
2.1. Quantum Chemical Calculations
2.1.1. Structures and Zero Point Energies
All the calculations were performed using Gaussian 16 rev B.01 software [12] on the PhLAM laboratory computing cluster. The equilibrium geometries of each of the two stable conform-ers (cis and trans, Figure1) of the studied compound were fully optimized both using second order Møller-Plesset per-turbation theory (MP2) and density functional theory (B97-1) with Dunning’s correlation consistent basis sets (aug-)cc-pVXZ (X=D,T,Q) [13] using the tight convergence option. Following these optimizations, harmonic frequencies calculations were performed using a tight SCF convergence criterion, the ultrafine integral grid option, and the “vibrot” option to obtain harmonic vibrational frequencies — (thus zero-point energy (ZPE) cor-rection to the energies) — and the vibration-rotation coupling (quartic centrifugal distortion) constants.
2.1.2. Vibrational Frequencies and Rotational Constants
Anharmonic vibrational frequencies and rotational constants in the ground and vibrationally excited states have been estimated from a “hybrid” method [14,15], recently used with success on other oxygen-containing species [16,17]. Briefly, since vibra-tional second-order perturbation theory (VPT2) calculations at the MP2 level as implemented in Gaussian 16 are not affordable for relatively large molecules as those of interest here, “hybrid” rotational constants of a given vibrational state v are estimated by adding the DFT anharmonicity corrections (B97-1/cc-pVTZ) to the MP2 equilibrium constants (MP2/cc-pVTZ). Once the experimental constants in the ground vibrational state (GS) are known, the predicted constants in vibrationally excited states (ES) can further be corrected to take into account the vibra-tional GS errors, a method that has proven useful in the past to support the analyses of the vibrational ES spectra of many molecules, as for instance PAHs [18]. This correction was par-ticularly useful to assign the pure rotation lines involving ES of trans-1-hydroxynaphthalene as shown further in the text.
2.1.3. Isomeric and Conformational Landscapes
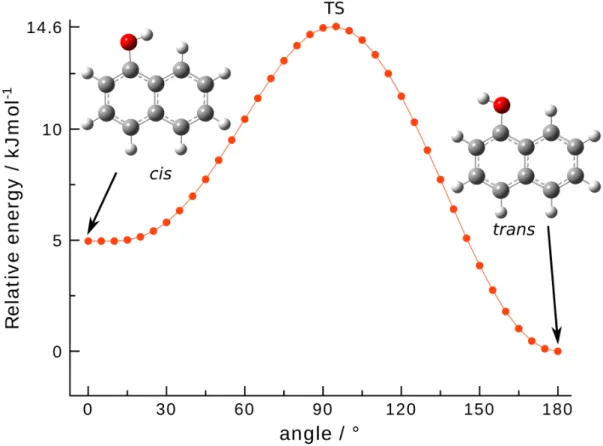
For 1-hydroxynaphthalene, a MP2/cc-pVTZ potential energy curve (PEC) along the C – O torsional angle has been calculated by means of a relaxed scan procedure along the C – C – O – H dihedral angle with 5° steps. The resulting PEC permitted us to ensure that the torsion is a very classical nonequivalent 2-fold potential with the functional group in the plane of naphthalene at equilibria and perpendicular to the plane at transition states (TS), TS mirror images being strictly equivalent in energy (see Figure S1 in the Supporting Information). Therefore, only TS searches (using the QST method as implemented in Gaussian 16) have been performed for the three other compounds. The rel-ative ZPE corrected energies of each conformer and the height of the barriers between them (i.e., torsion of the alcohol or alde-hyde group) have been estimated at the “hybrid” level described above and are presented in Figure1and Tables S1 and S2 in the Supporting Information.
Since the computed relative energies between iso-mers/conformers are rather small (few kJ mol−1in most cases), it is relevant to estimate the uncertainty relative to the choice of both the correlated electronic structure method and the size of the atomic basis sets. In quantum chemistry, the most accu-rate estimation of the dynamic correlation is achieved by using complete basis set (CBS) extrapolation and the gold standard coupled-cluster method with iterative inclusion of single and double excitations and perturbative inclusion of triple excita-tions (CCSD(T)). In the case of functionalized naphthalene compounds, the precision of the hybrid method can be esti-mated from single-point calculations of the relative energies. Such calculations have been performed on naphthaldehyde com-pounds with the MOLPRO 2019 package [19] using various wave function methods [MP2, CCSD(T)] extrapolated to the CBS limit, as well as localized explicit-correlated method PNO-LCCSD(T)-F12 (PNO being pair natural orbitals) [20,21]. The results of this comparison (see Table S3 in the Supporting In-formation) show that no notable differences in relative energies are obtained compared to the hybrid level (changes by few %
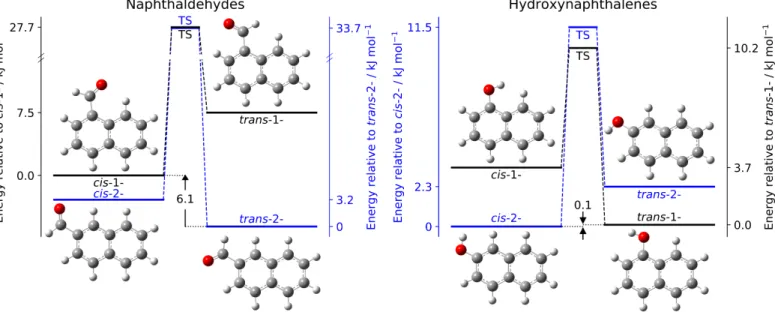
Fig. 1. Schematic view of the conformational landscapes of the naphthaldehyde (left trace) and hydroxynaphthalene (right trace)
compounds. The isomers of lower energy, i.e., 2-naphthaldehyde and 2-hydroxynaphthalene, are plotted in blue and the energy difference between the 1- and 2- compounds is reported (in kJ mol−1). Relative zero point energies have been calculated by using the hybrid method described in the text.
only). Thus, for all other compounds, the discussion is based on the results of the hybrid method only.
2.1.4. Charges Distributions and Molecular Orbitals
The natural bond orbital (NBO) analysis program (version 6.0) [22] has been used to compute the atomic charge distri-bution and pinpoint the presence of intramolecular hydrogen bonds. Indeed, NBO transforms the delocalized, many-electron wave function into optimized electron pair bonding subunits, i.e., in a set of Lewis-type (such as bonds and lone pairs) and non-Lewis-type (such as Rydberg and antibond) NBOs. Since a hydrogen bond can be viewed as a charge transfer from a donor (oxygen lone pair) to an acceptor (antibonding C – H), its strength can be quantified by the stabilization energy E(2) com-puted at the second-order perturbation-theory by the NBO anal-ysis, when larger than the default threshold 2 kJ mol−1. Naph-thaldehyde isomers were used to test the variations caused by various method/basis set associations (MP2 and B97-1 methods, cc-pVXZ and aug-cc-pVXZ basis sets, with X = D,T,Q). Abso-lute values of atomic charges are notably changing according to the method/basis set used. However, all tendencies discussed hereafter from results at the MP2/aug-cc-pVQZ level (consid-ered as the highest one) stay the same, from a relative point of view, whatever the method used. NBO calculations have been subsequently performed on hydroxynaphthalene, naphthalene, benzaldehyde, and hydroxybenzene.
2.2. Chemical Samples
All four samples, 1- and hydroxynaphthalene and 1- and 2-naphthaldehyde, have been purchased from Aldrich and used without further purification.
2.3. Centimeter Wave Spectroscopy
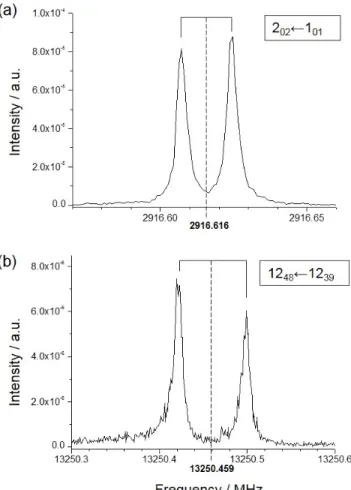
The pure rotation spectra of 1- and 2-hydroxynaphthalene and 1- and 2-naphthaldehyde have been recorded in the 2–20 GHz frequency range using a supersonic jet Fourier transform mi-crowave (FTMW) spectrometer located at the PhLAM Labora-tory (see refs23,24for details). A heated nozzle [25] allowed to mix the sample vapor with the carrier gas (neon) at a backing pressure of about 0.3 MPa. Temperatures ranging from 393 to 413 K were found to optimize the signal-to-noise ratio (SNR) depending on the amplitude of the recorded lines. The spectral resolution was set to 1.8 kHz, subsequently considered as the line accuracy. Examples of observed signals are displayed in Figure2.
2.4. Millimeter Wave Spectroscopy
Room temperature millimeter-wave absorption spectra of each of the four species were recorded at ISMO laboratory. The spectrometer, described in Ref. [26], is composed of a radio fre-quency synthesizer driving a commercial frefre-quency multiplier source from Virginia Diodes Inc. In the present study, all spectra were recorded in the 140–220 GHz range using similar experi-mental conditions: a 49 kHz frequency modulation of the signal with a modulation depth of 300 kHz, a 25 ms time constant, 30 kHz frequency steps, and a second harmonic lock-in detection were used. The collimated radiation was injected in a 2.25 m absorption cell equipped with Teflon windows. The output radi-ation was focused onto a Schottky diode detector from Virginia Diodes Inc. A constant flow of sample at a pressure lower than 0.1 Pa was used to record the spectra. Under these experimental conditions, the line center frequency accuracy ranges from 50 to 75 kHz, based on the SNR.
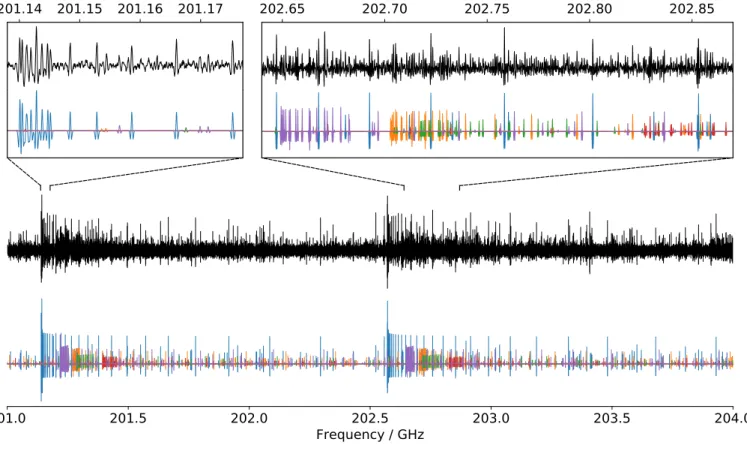
Figure3shows a small portion of the 1-hydroxynaphthalene absorption spectrum. Several clusters of lines corresponding
Fig. 2. Examples of FTMW lines (in the shape of Doppler
doublets resulting from the coaxial arrangement of the cavity and the supersonic expansion) of 2-hydroxynaphthalene: (a) strongqR-type and (b) weakpQ-type transitions of the cis con-former. These spectra correspond to 100 and 1000 acquisitions, respectively. Assignments are in the format JK00
aKc0 ← J”K”aK”c.
Center frequency for each doublet is taken as the average of the two Doppler components.
toqR-type transitions within GS and several ES are clearly identified. The simulated spectrum is obtained using the final set of rotational constants as given in Tables3and S6 in the Supporting Information.
2.5. Fourier-Transform IR Spectroscopy
In addition to the pure rotation measurements, the vibrational spectra of the two naphthaldehyde species were recorded in the 50–3500 cm−1spectral range. The absorption spectra were recorded using the Bruker IFS125HR Fourier-transform (FT) interferometer located on the AILES beamline of the SOLEIL synchrotron. Room temperature vapor pressure of each sample (typically of the order of a few Pa) was injected in a White-type multipass cell with optics set to obtain 150 m path length [27]. We attempted to record the absorption spectra of the two hy-droxynaphthalene molecules in the same conditions but their lower vapor pressure prevented from any vibrational band detec-tion. For the naphthaldehydes spectra, the rotational structures
of the vibrational bands could not be resolved at the ultimate resolution of the FT interferometer (0.001 cm−1), we chose a spectral resolution of 0.5 cm−1to record the vibrational signa-tures. Since such relatively low spectral resolution does not require the use of synchrotron radiation as a continuum source for the interferometer, a globar source was used instead. A 6 µm mylar beamsplitter and a liquid He cooled bolometer were used to record the spectra in the 50–600 cm−1 range. For the 600–3500 cm−1range, a KBr beamsplitter was used together with a liquid nitrogen cooled HgCdTe detector.
3. Results
The quantum chemical relative energies of the conformers allow to evaluate their population at 300 K. For 1-naphthaldehyde, 95 % of the population is in the cis form while for 2-naphthaldehyde 79 % of the population is in the trans form. Concerning 1-hydroxynaphthalene, 82 % of the population is in the trans form while for 2-hydroxynaphthalene, 71 % is in the cisform (see Tables S1 and S2 in the Supporting Information).
3.1. Vibrational Spectra of 1- and 2-Naphthaldehyde
All four naphthaldehyde compounds (cis and trans of both 1- and 2-species) belong to the Cs symmetry point group and
possess 37 A0and 17 A00vibrational modes. Vibrational bands of A0symmetry are of a/b-type while those of A00symmetry are of c-type.
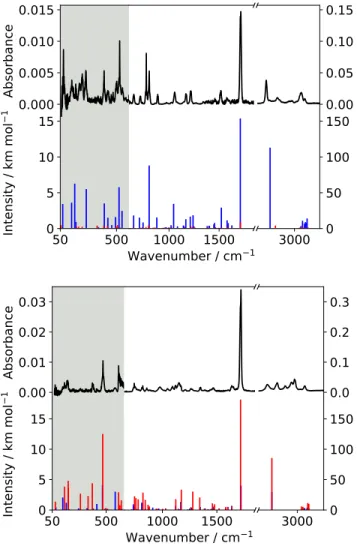
Using the experimental conditions described in the previ-ous section, the vibrational bands observed for both 1- and 2-naphthaldehyde samples come out as unresolved rotational envelopes (spreading over about 20 cm−1, Figure4). Most of the IR bands are relatively weak and many possible overlapping bands complicate the vibrational assignment, in particular in the mid-IR. The experimental band frequencies are obtained by measuring the maximum absorption of the relatively sharp Q-branch for the out-of-plane modes (c-type bands). For the in-plane modes (a/b-type bands), we used the Q-branch when the latter was clearly observed but, in many cases these bands appear as broad, structureless envelopes in which cases the band frequency was measured at the maximum of the band. The resulting frequency accuracy ranges from about 1 cm−1for well-defined Q-branches to several cm−1otherwise.
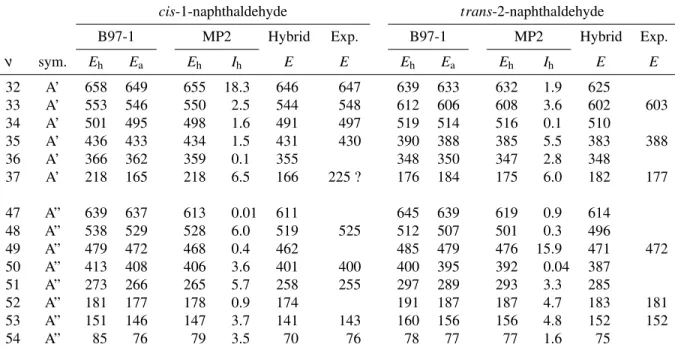
Only the most stable conformers of each compound, cis-1-naphthaldehyde and trans-2-cis-1-naphthaldehyde, whose IR bands dominate the experimental spectra, have been detected using our room temperature experimental setup (Figure4). Table1reports the proposed vibrational assignments and the comparison with the calculations of the far-IR bands (below 700 cm−1) while the full IR assignment is reported in Table S4 in the Support-ing Information. The comparison between experimental and calculated IR spectra of 1- and 2-naphthaldehyde species are displayed on Figure4.
Due to the relatively low vapor pressure of the naphthalde-hyde samples at room temperature, our detection was limited to the most intense mid- and far-IR bands (of calculated intensities larger than about 3 km.mol−1). In the far-IR, the vibrational bands involve in-plane and out-of-plane deformations of the carbon skeleton of the molecules. Assignments are proposed on
201.0
201.5
202.0
202.5
203.0
203.5
204.0
Frequency / GHz
202.65
202.70
202.75
202.80
202.85
201.14 201.15 201.16 201.17
Fig. 3. Portions of the room temperature experimental millimeter spectrum of 1-hydroxynaphthalene (top traces, in black) and
comparison with a simulation (bottom traces) of the pure rotational transitions within the ground state (in blue) and within several low-lying vibrational excited states (various colors; see the Supporting Information). The broader portion of the spectrum displays two consecutiveqR series with J00+Ka00=139/140 and 140/141 (unresolved asymmetric splitting). The PGOPHER software was used to simulate the spectrum at 300 K using the rotational constants in each state derived in this work. Relative intensities of the ES rotational lines are modeled using the calculated (hybrid method) energies of each mode and a Boltzmann distribution at 300 K. The second derivative of the obtained traces was subsequently calculated to allow better comparison with the experimental spectrum.
the basis of the the agreement with the calculated frequencies (hybrid method), the relative harmonic intensities of the modes (MP2 calculation), and the rotational contour of the band (since out-of-plane modes are c-type and thus display distinctive sharp and intense Q-branches). It is worth noting that for most of the calculated vibrational modes, the anharmonic corrections are relatively small (typically of order of a few cm−1), at the notable exception of some bands (see, e.g., in Table1the comparison between harmonic and anharmonic energies of v37=1 of
cis-1-naphthaldehyde molecule for which the anharmonic shift is larger than 50 cm−1 making the assignment rather insecure). For most of the bands, the agreement between observed and calculated bands (both in terms of frequency and intensity) is quite good (corresponding to a few wavenumbers difference) supporting the use of such hybrid calculations (as already shown in previous papers, see e.g., ref28and references therein) to pre-dict relatively accurately IR spectra of large and rigid molecules at a low computational cost.
3.2. Pure Rotation Spectra
The analysis procedure used in this work is similar to the one used in previous investigations of rotationally resolved spectra
of N-substituted PAHs [28]. Briefly, the theoretical calcula-tions provide a first set of rotational constants enabling the search for the centimeter-wave jet-cooled rotational transitions of the molecules. Once the most intense lines are observed and assigned, an accurate set of parameters can be derived that then allows a relatively straightforward assignment of the millimeter-wave room-temperature spectra using a combination of Loomis-Wood [29], PGOPHER [30], and Pickett’s suite of programs [31].
The ground-state conformer of each of the studied com-pounds is a nearly prolate asymmetric top belonging to the Cs
symmetry point group with a permanent dipole moment along both the a and b axis (see Tables2and3for dipole-moment val-ues). The rotational transitions were fitted to a Watson Hamilto-nian in the A-reduction and Irrepresentation. For the four most stable species studied here, both a-type and b-type transitions were observed in the FTMW spectra while the lower spectral resolution of the room temperature millimeter-wave spectra, together with the limited SNR, did not allow to resolve these different components. Typically, transitions involving quantum numbers up to J∼ 150 and Ka∼ 40 were assigned. Owing to
rota-Table 1. Calculated Far-IR Fundamental Vibrational Modes of cis-1-Naphthaldehyde and trans-2-Naphthaldehyde and Comparison
with Proposed Experimental Assignments. Energies are given in cm−1and intensities in km mol−1.
cis-1-naphthaldehyde trans-2-naphthaldehyde
B97-1 MP2 Hybrid Exp. B97-1 MP2 Hybrid Exp.
ν sym. Eh Ea Eh Ih E E Eh Ea Eh Ih E E 32 A’ 658 649 655 18.3 646 647 639 633 632 1.9 625 33 A’ 553 546 550 2.5 544 548 612 606 608 3.6 602 603 34 A’ 501 495 498 1.6 491 497 519 514 516 0.1 510 35 A’ 436 433 434 1.5 431 430 390 388 385 5.5 383 388 36 A’ 366 362 359 0.1 355 348 350 347 2.8 348 37 A’ 218 165 218 6.5 166 225 ? 176 184 175 6.0 182 177 47 A” 639 637 613 0.01 611 645 639 619 0.9 614 48 A” 538 529 528 6.0 519 525 512 507 501 0.3 496 49 A” 479 472 468 0.4 462 485 479 476 15.9 471 472 50 A” 413 408 406 3.6 401 400 400 395 392 0.04 387 51 A” 273 266 265 5.7 258 255 297 289 293 3.3 285 52 A” 181 177 178 0.9 174 191 187 187 4.7 183 181 53 A” 151 146 147 3.7 141 143 160 156 156 4.8 152 152 54 A” 85 76 79 3.5 70 76 78 77 77 1.6 75
Note. h and a subscripts stand for harmonic and anharmonic, respectively.
tional constants (A, B,C) and the quartic centrifugal distortion terms were required to fit the data to their experimental accu-racy. Tables2and3contain the results of our analysis and the comparison with the hybrid calculations. The full tables of rotational constants obtained at each stage of the calculations are provided in Table S5 in the Supporting Information. The GS rotational constants calculated using this hybrid method are in very good agreement with the experimental values, with errors below 0.5 % for the A, B, and C rotational parameters. However, as such rigid molecules have relatively small quartic centrifugal distortion constants, the agreement between the measured and calculated parameters is significantly worse (in particular the δJ
and δK parameters can show opposite signs).
For all species, only the conformer of lowest energy was observed unambiguously in the experimental spectra. In the millimeter-wave region, where broad surveys were recorded, the lack of detection of the high-energy conformer is imputed to the low vapor pressure at room temperature, which results in relatively limited SNR, despite the relatively large value of the permanent dipole moments of each species. In the case of the millimeter-wave spectrum of trans-1-hydroxynaphthalene, the SNR is somewhat larger than for the three other species, allowing pure rotational lines involving four different ES to be assigned. Unambiguous assignments of these ES pure rota-tion spectra are allowed thanks to the good predicting power of the calculated constants by comparison with anharmonic calculations (Figure3and Tables S6 and S7 in the Supporting Information).
4. Discussion
The relative stability of the species in the naphthaldehyde / hy-droxynaphthalene families warrants further discussion. Calcu-lated energies performed in this work show that the substitution in position 2- is the most stable for the – COH isomers while the – OH are almost isoenergetic, and the cis vs. trans conformer stability is completely different for both the two considered substitutions ( – COH and – OH) and their isomers (1- and 2-, Figure1). The latter point is unambiguously confirmed by the experimental measurements since for all pure compounds studied, only the conformer predicted to be the most stable by the calculations has been observed. In order to shed some light into the physical and chemical factors that govern these confor-mational landscapes, in this section we discuss the differences between all species in terms of electrostatic interactions (steric repulsion and local charges) that we found in agreement with the relative stabilities.
4.1. Isomeric Considerations
Prior to a detailed conformational analysis, only the most stable conformer of each species will be considered here. The charges derived from the NBO calculations (see Tables S8 and S9 in the Supporting Information) together with molecular structures (see Figure5for the most relevant topological parameters) are useful indicators to assess the relative isomeric stability, by verify-ing their agreement with relative energies and well-established chemical considerations: (i) an aldehyde is an electrophilic group; (ii) an hydroxy group can either be electron sharing or withdrawing (by resonant or inductive effect, respectively); and (iii) a hydroxy is an activating group while an aldehyde is a deactivating group. On one hand, steric effects within isomers
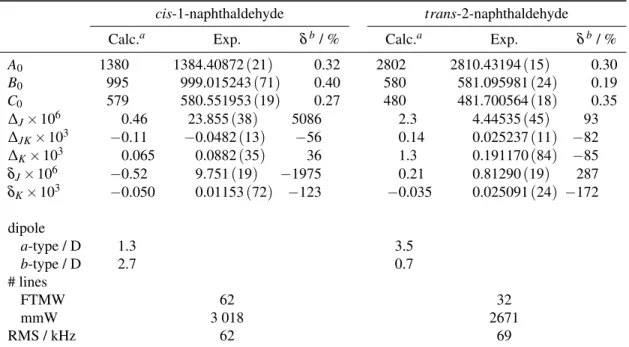
Table 2. Experimental and Calculated Rotational Parameters (in MHz) for the Naphthaldehyde Species. Error (1σ ) on parameters
are given between parenthesis in units of the last digit.
cis-1-naphthaldehyde trans-2-naphthaldehyde
Calc.a Exp. δb/ % Calc.a Exp. δb/ %
A0 1380 1384.40872(21) 0.32 2802 2810.43194(15) 0.30 B0 995 999.015243(71) 0.40 580 581.095981(24) 0.19 C0 579 580.551953(19) 0.27 480 481.700564(18) 0.35 ∆J× 106 0.46 23.855(38) 5086 2.3 4.44535(45) 93 ∆JK× 103 −0.11 −0.0482(13) −56 0.14 0.025237(11) −82 ∆K× 103 0.065 0.0882(35) 36 1.3 0.191170(84) −85 δJ× 106 −0.52 9.751(19) −1975 0.21 0.81290(19) 287 δK× 103 −0.050 0.01153(72) −123 −0.035 0.025091(24) −172 dipole a-type / D 1.3 3.5 b-type / D 2.7 0.7 # lines FTMW 62 32 mmW 3 018 2671 RMS / kHz 62 69
aHybrid rotational constants and MP2 centrifugal distorsion terms, see text bδ = (B
Exp.− BCalc)/BCalc.× 100
Table 3. Experimental and calculated rotational parameters (in MHz) for the hydroxynaphthalene species. Error (1σ ) on parameters
are given between parenthesis in units of the last digit.
trans-1-hydroxynaphthalene cis-2-hydroxynaphthalene
Calc.a Exp. δb/ % Calc.a Exp. δb/ %
A0 1934 1942.100623(53) 0.42 2837 2849.155543(64) 0.43 B0 1132 1133.623211(21) 0.14 823 824.632161(25) 0.20 C0 714 716.017762(14) 0.28 638 639.723697(15) 0.27 ∆J× 106 18 17.90338(92) −0.54 6.6 8.2474(19) 25 ∆JK× 103 0.010 0.0159910(44) 60 0.071 0.014844(25) −79 ∆K× 103 0.050 0.044395(14) −11 0.22 0.185375(72) −16 δJ× 106 6.6 6.43578(37) −2.5 1.3 2.05543(90) 58 δK× 103 0.034 0.0351740(62) 3.5 0.040 0.030525(43) −24 dipole a-type / D 1.2 0.2 b-type / D 0.2 1.0 # lines FTMW 50 82 mmW 3 636 1248 RMS / kHz 62 37
aHybrid rotational constants and MP2 equilibrium centrifugal distortion terms, see text bδ = (B
0.000
0.005
0.010
0.015
Absorbance
50
500
0
5
10
15
Int
en
sit
y /
km
m
ol
11000 1500
Wavenumber / cm
10.00
0.05
0.10
0.15
3000 0
50
100
150
0.00
0.01
0.02
0.03
Absorbance
50
500
0
5
10
15
Int
en
sit
y /
km
m
ol
11000 1500
Wavenumber / cm
10.0
0.1
0.2
0.3
3000 0
50
100
150
Fig. 4. Experimental infrared spectra (in black) of 1- (top plot)
and 2-naphthaldehyde (bottom plot), and comparison with a stick spectrum of the predicted fundamental bands (hybrid level for positions and MP2/VTZ for harmonic intensities) of the cis (in blue) and trans (in red) conformers of each species. For the sake of clarity, all intensities are multiplied by a factor 10 in the low frequency part of the spectrum (gray background areas). Intensity ratios between isomers of each species are calculated from the estimated population at room temperature.
might be estimated from the electrostatic interaction (Coulomb type) between the H atom i of the functional group and the closest H atom j attached to the ring (repulsive): Eq=
qi×qj ri j
where q are the calculated charges and ri jis the calculated
dis-tance between charges centers. Then, the difference of these electrostatic energies between isomers∆Eqmight be used to
account for the destabilization of one compared to the other. On the other hand, atomic charges of bare naphthalene (calculated using the same method: NBO6 at the MP2/aug-cc-pVQZ level) can be used to point out at which position (1- or 2-) the attack of a functional group might be favored. Atomic charges are gathered in Tables S8 and S9 in the Supporting Information; atom labels and relevant distances are shown in Figure5.
Naphthaldehydes. The 2-naphthaldehyde isomer is calcu-lated to be the most stable form, by far, with an energy dif-ference of more than 6 kJ mol−1 with the 1-naphthaldehyde species (Figure 1). This destabilization of 1- over 2- quali-tatively agrees with a steric repulsion larger in 1- than in 2-: ∆Eq=Eq(cis− 1−)− Eq(trans− 2−) =2.3 kJ mol−1. This
isomeric preference is also in line with consideration (i) when looking at the charges distribution in naphthalene (see values in Table S8 in the Supporting Information): the charge of the C – H group at position 2- (C2+H17) is negative (−0.0105 au) while it is positive (0.0201 au) at position 1- (C1+H18) . Thus, the electrophilic attack of an aldehyde group on naphthalene would be favored in position 2-. Therefore, both energies and charges agree with consideration (i) to designate isomer 2- as the favored form.
Hydroxynaphthalenes. Here again, isomer 2- is slightly more stable than isomer 1- (0.1 kJ mol−1 apart at the hybrid level of theory, see Figure 1). Steric repulsion is also qualita-tively pointing toward a destabilization of 1- over 2- with ∆Eq=Eq(trans−1−)−Eq(cis−2−) =2.9 kJ mol−1. In this
case, the sign of charges at positions 1- and 2- in naphthalene is probably a less efficient indicator since consideration (ii) says that an attack of a hydroxy group can either be electron sharing or withdrawing, so it can occur either at position 1- or 2- regard-less the sign of the charges. However, it may corroborate that the two hydroxynaphthalene isomers are almost iso-energetic.
Both Molecules. The large difference in electronic structure among naphthaldehyde, hydroxynaphthalene, and bare naph-thalene prevents the use of relative energies and local charges differences to assess isomeric preference. However, the global charge redistribution upon functionalization might be a useful qualitative indicator to assess the validity of NBO calculations. Figure6displays the molecular electrostatic potentials (MEP) mapped on the 0.001 Ehisodensity surface (MP2/aug-cc-pVQZ)
for naphthalene and the most stable conformers of hydroxynaph-thalene and naphthaldehyde, created by the AIMall visualization software [32]. Looking at the aromatic rings, MEP for hydroxy-naphthalene species stay roughly the same as for hydroxy-naphthalene while they get globally less negative for naphthaldehyde with most of the negative charges concentrating themselves on the oxygen atom of the aldehyde group. This tends to indicate that an electrophilic attack would be less efficient on naphthalde-hyde than on hydroxynaphthalene or bare naphthalene, which qualitatively agrees with consideration (iii).
4.2. Conformational Landscape
Once confidence is gained in the molecular orbitals and charges derived from NBO calculations, they can be used to discuss the conformational landscape of the four compounds. Indeed, the way that the charges are distributed in the aromatic ring upon functionalization together with estimations of electrostatic interactions can be used for understanding why for each isomer one conformer is more stable than the other. As shown in the fol-lowing, the situation for isomers 1- is relatively straightforward, while isomers 2- situation calls for further discussion.
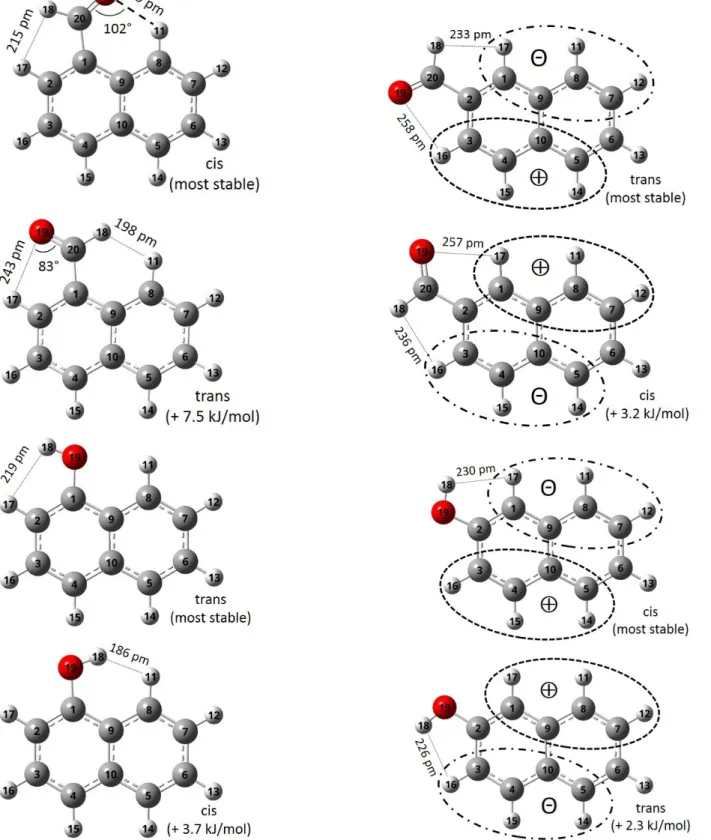
Fig. 5. Calculated structures at equilibrium (MP2/aug-cc-pVQZ) of the two conformers of 1-naphthaldehyde, 2-naphthaldehyde,
1-hydroxynaphthalene, and 2-hydroxynaphthalene. Atom numbering, relative energy (hybrid level), schematic representation of the charges distribution, and relevant topological parameters are indicated.
(a) naphthalene −142 218 −137 (b) cis – 1-naphthaldehyde −142 (c) trans – 2-naphthaldehyde −81 218 (d) trans – 1-hydroxynaphthalene −94 217
(e) cis – 2-hydroxynaphthalene
Fig. 6. Molecular electrostatic potentials (MEP) mapped on the
0.001 Ehisodensity surface calculated at the MP2/aug-cc-pVQZ
level of theory for naphthalene and the most stable conformers of the hydroxynaphthalene and naphthaldehyde.MEP values range from−142 kJmol−1(red) to 218 kJ mol−1(blue).
Fig. 7. Schematic representation of the charges distribution in
benzaldehyde (left panel) and hydroxybenzene (right panel) as reported in Table4.
1-Naphthaldehyde. An intramolecular hydrogen bond be-tween the oxygen atom of the aldehyde group and the H11 hydrogen atom attached to the C8 carbon (Figure5) stabilizes the cis conformer compared to the trans. The existence of an intramolecular hydrogen bond in the cis isomer is evidenced by NBO calculations showing a charge transfer from the O atom lone pair (donor) to the C8-H11 antibonding orbital (ac-ceptor), corresponding to a stabilization energy E(2) of about 5.1 kJ mol−1. This value corresponds to a typically weak in-tramolecular hydrogen bond, as reflected as well by the long hydrogen bond length, 219 pm (see Figure5) and its orienta-tion [33]. However, in the trans structure, the distance is too long and the angle is too obtuse, preventing the detection of a significant orbital mixing in the NBO analysis (E(2) is smaller than the 2 kJ mol−1 threshold) [34]. Qualitatively, the hydro-gen bond stabilization energy of 5.1 kJ mol−1accounts for most of the cis/trans relative energy (7.5 kJ mol−1). The difference (2.4 kJ mol−1) might be explained by adding an extra destabi-lization of trans over cis due to a larger a steric repulsion at the H atom side in trans than in cis:∆Eq=Eq(trans)− Eq(cis) =
1.7 kJ mol−1.
1-Hydroxynaphthalene. It is clear from topological observa-tions that no intramolecular hydrogen bond is possible with hydroxy as the functional group. However, a stronger steric repulsion between the H atom of the hydroxy group and its clos-est H neighbor dclos-estabilizes the cis conformer compared to the trans. This effect is visible when looking at the H – H distance (see Figure5), which equals 186 pm in the cis isomer, a distance that is far below twice the an der Waals radius of an H atom (2× 120=240 pm), while it is significantly longer in the trans isomer (219 pm). Here, the destabilization by electrostatic inter-action with∆Eq=Eq(cis)−Eq(trans) =2.2 kJ mol−1accounts
for most of the cis/trans relative energy (3.7 kJ mol−1).
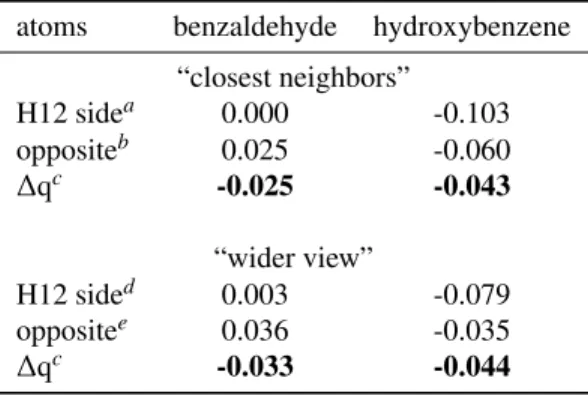
Table 4. Calculated Sum of Charges around the Functional
Group in Functionalized Benzene (see Tables S8 and S9 in the Supporting Information for atomic charges and see Figure7for atoms labelling). Values are given in atomic units.
atoms benzaldehyde hydroxybenzene “closest neighbors” H12 sidea 0.000 -0.103 oppositeb 0.025 -0.060 ∆qc -0.025 -0.043 “wider view” H12 sided 0.003 -0.079 oppositee 0.036 -0.035 ∆qc -0.033 -0.044 aC6+H11 bC2+H7 c∆q = (H12 side - opposite) dC6+H11+C5+H10 eC2+H7+C3+H8
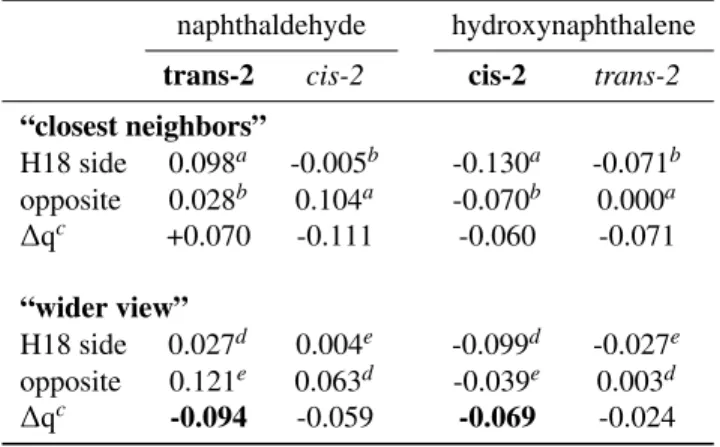
Isomers 2-. A closer look at charges seems necessary to bring some understanding in these conformational landscapes. In addition to simple electrostatic interactions between local charges, longer range effects might be expected because of the aromatic system of such species. Contrary to isomers 1- for which geometrical asymmetry around the functional groups induces significant differences between conformers (stabiliza-tion/destabilization due to attractive/repulsive interactions), iso-mers 2- with conforiso-mers having quasi-equal topological pa-rameters appears as ideal systems to eventually study the link between charges distribution and conformational preferences.
The more simple functionalized benzenes (i.e., benzaldehyde and hydroxybenzene; see Tables S8 and S9 in the Supporting Information) may be used as reference systems. In the case of benzene, owing to its higher symmetry, a 180° rotation of the functional group gives rise to two iso-energetic mirror images, i.e. functionalized benzenes have no conformational forms. Then, the charge distribution within the aromatic ring (uniform in bare benzene) perturbed by the functional group can be eval-uated and may serve as reference. In both functional groups, the H atom is a carrier of positive charges (H12; see Tables S8 and S9). The sum of charges on the closest neighbor C – H groups in the ring (see Table4) is less positive (or more neg-ative) at the side of H12 (C6+H11) than at its opposite side (C2+H7). However, electrons delocalization associated with aromaticity should facilitate charge transfer between members of the ring. Thus, it appears relevant to take this effect into account by looking at a “wider view”, i.e., by adding charges of the next C – H group to those of the closest neighbor (see Fig-ure7). The same results are observed in this “wider view”, as shown in Table4. Such asymmetric charge distribution within the aromatic ring from one side of the functional group to the other is most probably due to the repulsive action of H12 as a positive charge center so that an energetic stabilization of the whole system is achieved by transferring some of the ring positive charge to the opposite side, which is facilitated by aro-maticity. Then, such stabilization evidenced by an asymmetry of charges is expected in functionalized naphthalene, the most stable conformer being the one showing the same trend or at least the most pronounced one.
2-Hydroxynaphthalene. The cis conformer is calculated to be the most stable form with an energy difference of 2.3 kJ mol−1. It qualitatively agrees with the electrostatic interaction differ-ence of∆Eq=Eq(trans)− Eq(cis) =2.8 kJ mol−1.
Concern-ing charges distribution, by lookConcern-ing only at the closest neighbor C – H groups, there is a positive charge deficit on the side of the hydroxyl hydrogen atom (H18) for both conformers (see Table
5), which fails to correlate with the conformational preference. On the contrary, the asymmetry of charges is slightly more pro-nounced in the less stable conformer (trans). However, in the “wider view” including the next groups (see Figure5), the posi-tive charge deficit on the side of H18 is more pronounced for the most stable cis conformer: (H18 side - opposite) =−0.069 au for cis against−0.024 au for trans. This could be explained by the peculiar π delocalization linked to aromaticity. Compared to a single aromatic ring (benzox species), the charge transfer within the π orbitals network might be less efficient in a doubly
Table 5. Calculated Sum of Charges around the Functional
Group in Functionalized Naphthalene (see Tables S8 and S9 in the Supporting Information for atomic charges and Figure5for atoms labelling). Most stable conformers are specified in bold. Values are given in atomic units.
naphthaldehyde hydroxynaphthalene trans-2 cis-2 cis-2 trans-2 “closest neighbors” H18 side 0.098a -0.005b -0.130a -0.071b opposite 0.028b 0.104a -0.070b 0.000a ∆qc +0.070 -0.111 -0.060 -0.071 “wider view” H18 side 0.027d 0.004e -0.099d -0.027e opposite 0.121e 0.063d -0.039e 0.003d ∆qc -0.094 -0.059 -0.069 -0.024 aC1+H17 bC3+H16 c∆q = (H18 side - opposite) dC1+H17+C9+C8+H11+C7+H12 eC3+H16+C4+H15+C10+C5+H14
aromatic system (naphthox species), so that the “closest neigh-bors” might be still strongly influenced by the local charges distribution within the functional group and only a “wider view” permits to retrieve the asymmetry of charges. Therefore, the conformational preference, evidenced by energetic considera-tions, could be correlated to an asymmetry of charges within the aromatic systems only on the basis of this hypothesis.
2-Naphthaldehyde. The trans conformer is calculated to be the most stable form with an energy difference of 3.2 kJ mol−1. It qualitatively agrees with the electrostatic interaction differ-ence of∆Eq=Eq(trans)−Eq(cis) =1.8 kJ mol−1. In this case
as well, the charge distribution at the closest neighbor C – H groups is pointing to the cis conformer as the most stable (see Table5), contrary to energetic considerations. However, here again, the reverse situation is observed in the “wider view” in agreement with energies (see Figure5), (i.e., a positive charge deficit at the H18 side is more pronounced for the most stable trans conformer), so that the same hypothesis of a stabiliza-tion by charge transfer within the whole aromatic systems may apply.
5. Conclusions
The spectra of four oxygen-containing naphthalene species – 1- and 2-hydroxynaphthalene, and 1- and 2-naphthaldehyde – have been recorded in the microwave, millimeter-wave, and infrared spectral ranges. Pure rotational and vibrational assign-ments have been supported by high level quantum chemical calculations, using a hybrid method based on MP2 (harmonic) and DFT (anharmonic) calculations. The pure rotation and rotation-vibration spectra recorded using various experimental
setups allowed us to unambiguously identify the most stable conformers of each species, in excellent agreement with the calculated results for the energetic relative stabilities. The iso-meric preference evidenced by relative free energies (isomers 2-are more stable than isomers 1-) has been rationalized in terms of charge distribution within the aromatic rings. In turn, con-fidence has been gained in the molecular orbitals and charges out of NBO calculations. The comparison with similar calcu-lations for simpler structures (functionalized benzene) leads us to propose an explanation for the conformational preferences of each species on the basis of the influence of the functional groups on the charges distribution within the aromatic rings, providing new insights in the physicochemical properties of isomeric and conformational landscapes of these functionalized PAHs compounds. Finally, our study provides all necessary in-formation for an active search of these molecules in atmospheric and astrophysical environments.
Acknowledgements
This work was supported by the Programme National “Physique et Chimie du Milieu Interstellaire” (PCMI) of CNRS/INSU with INC/INP cofunded by CEA and CNES; by the CaPPA project (Chemical and Physical Properties of the Atmosphere); and by the CPER ClimiBio funded by the French National Research Agency (ANR) through the PIA (Programme d’Investissement d’Avenir), under contract ANR-11-LABX-0005-01, the I-SITE ULNE/ANR-16-IDEX-0004 ULNE, and the Regional Council Hauts-de-France and the European Funds for Regional Eco-nomic Development (FEDER). Part of this work is supported by “Investissements d’Avenir” LabEx PALM (ANR-10-LABX-0039-PALM).
References
1. A. T. Balaban, D. C. Oniciu, and A. R. Katritzky. Aromaticity as a cornerstone of heterocyclic chemistry. Chem. Rev., 104, 2777–2812 (2004).doi:10.1021/cr0306790.
2. A. G. G. M. Tielens. Interstellar polycyclic aromatic hydrocarbon molecules. Annu. Rev. Astron. Astrophys., 46, 289–337 (2008).
doi:10.1146/annurev.astro.46.060407.145211.
3. A. Léger and J. L. Puget. Identification of the unidentified IR emission features of interstellar dust. Astron. Astrophys., 137(1), L5–L8 (1984). 4. L. J. Allamandola, A. G. G. M. Tielens, and J. R. Barker. Polycyclic aromatic hydrocarbons and the unidentified infrared emission bands - auto exhaust along the milky-way. Astrophys. J., 290(1), L25–L28
(1985).doi:10.1086/184435.
5. F. Salama. Pahs in astronomy - a review. Proc. Int. Astron. Union, 4(S251), 357–366 (2008).doi:10.1017/S1743921308021960.
6. B. A. McGuire, A. M. Burkhardt, S. Kalenskii, C. N. Shingledecker, A. J. Remijan, E. Herbst, and M. C. McCarthy. Detection of the aromatic molecule benzonitrile (c-C6H5CN) in the interstellar medium. Science, 359(6372), 202–205 (2018).doi:10.1126/science.aao4890.
7. K. Ravindra, R. Sokhi, and R. Van Grieken. Atmospheric poly-cyclic aromatic hydrocarbons: Source attribution, emission factors and regulation. Atmos. Environ., 42(13), 2895–2921 (2008). doi: 10.1016/j.atmosenv.2007.12.010.
8. S. Tomaz, P. Shahpoury, J.-L. Jaffrezo, G. Lammel, E. Perraudin, E. Villenave, and A. Albinet. One-year study of polycyclic aromatic compounds at an urban site in grenoble (france): Seasonal variations, gas/particle partitioning and cancer risk estimation. Sci. Total Environ., 565, 1071–1083 (2016).doi:10.1016/j.scitotenv.2016.05. 137.
9. I. J. Keyte, R. M. Harrison, and G. Lammel. Chemical reactivity and long-range transport potential of polycyclic aromatic hydrocarbons - a review. Chem. Soc. Rev., 42(24), 9333–9391 (2013).doi:10.1039/ c3cs60147a.
10. B. Yuan, W. W. Hu, M. Shao, M. Wang, W. T. Chen, S. H. Lu, L. M. Zeng, and M. Hu. Voc emissions, evolutions and contributions to soa formation at a receptor site in eastern china. Atmos. Chem. Phys., 13(17), 8815–8832 (2013).doi:10.5194/acp-13-8815-2013.
11. T. Hüffer, H. Sun, J. D. Kubicki, T. Hofmann, and M. Kah. Interactions between aromatic hydrocarbons and functionalized C60fullerenes -insights from experimental data and molecular modelling. Environ. Sci.: Nano, 4, 1045–1053 (2017).doi:10.1039/C7EN00139H.
12. M. J. Frisch, G. W. Trucks, H. B. Schlegel, G. E. Scuseria, M. A. Robb, J. R. Cheeseman, G. Scalmani, V. Barone, G. A. Petersson, H. Nakatsuji, X. Li, M. Caricato, A. V. Marenich, J. Bloino, B. G. Janesko, R. Gomperts, B. Mennucci, H. P. Hratchian, J. V. Ortiz, A. F. Izmaylov, J. L. Sonnenberg, D. Williams-Young, F. Ding, F. Lipparini, F. Egidi, J. Goings, B. Peng, A. Petrone, T. Henderson, D. Ranasinghe, V. G. Zakrzewski, J. Gao, N. Rega, G. Zheng, W. Liang, M. Hada, M. Ehara, K. Toyota, R. Fukuda, J. Hasegawa, M. Ishida, T. Nakajima, Y. Honda, O. Kitao, H. Nakai, T. Vreven, K. Throssell, J. A. Montgomery, Jr., J. E. Peralta, F. Ogliaro, M. J. Bearpark, J. J. Heyd, E. N. Brothers, K. N. Kudin, V. N. Staroverov, T. A. Keith, R. Kobayashi, J. Normand, K. Raghavachari, A. P. Rendell, J. C. Burant, S. S. Iyengar, J. Tomasi, M. Cossi, J. M. Millam, M. Klene, C. Adamo, R. Cammi, J. W. Ochterski, R. L. Martin, K. Morokuma, O. Farkas, J. B. Foresman, and D. J. Fox. Gaussian 16 Revision C.01 (2016). Gaussian Inc.: Wallingford, CT. 13. T. H. Dunning. Gaussian basis sets for use in correlated molecular
calculations. I. The atoms boron through neon and hydrogen. J. Chem. Phys., 90(2), 1007–1023 (1989).doi:10.1063/1.456153.
14. M. Biczysko, P. Panek, G. Scalmani, J. Bloino, and V. Barone. Harmonic and anharmonic vibrational frequency calculations with the double-hybrid b2plyp method: Analytic second derivatives and benchmark studies. J. Chem. Theory Comput., 6(7), 2115–2125 (2010). doi: 10.1021/ct100212p.
15. S. Grimme and M. Steinmetz. Effects of london dispersion correction in density functional theory on the structures of organic molecules in the gas phase. Phys. Chem. Chem. Phys., 15(38), 16031–16042 (2013).
doi:10.1039/c3cp52293h.
16. M. Goubet, P. Soulard, O. Pirali, P. Asselin, F. Réal, S. Gruet, T. R. Huet, P. Roy, and R. Georges. Standard free energy of the equilibrium between the trans-monomer and the cyclic-dimer of acetic acid in the gas phase from infrared spectroscopy. Phys. Chem. Chem. Phys., 17(11), 7477–7488 (2015).doi:10.1039/c4cp05684a.
17. S. Bteich, M. Goubet, R. A. Motiyenko, L. Margules, and T. R. Huet. Vibrational dynamic and spectroscopic molecular parameters of trans-methylglyoxal, a gaseous precursor of secondary organic aerosols. J. Mol. Spectrosc., 348(SI), 124–129 (2018).doi:10.1016/j.jms. 2017.12.007.
18. S. Gruet, M. Goubet, and O. Pirali. High resolution measurements sup-ported by electronic structure calculations of two naphthalene deriva-tives: [1,5]- and [1,6]-naphthyridine - estimation of the zero point iner-tial defect for planar polycyclic aromatic compounds. J. Chem. Phys., 140(23), 234308 (2014).doi:10.1063/1.4882652.
19. H.-J. Werner, P. J. Knowles, G. Knizia, F. R. Manby, M. Schütz, and et al. Molpro, version 2019.2, a package of ab initio programs (2019). https://www.molpro.net.
20. Q. Ma and H.-J. Werner. Explicitly correlated local coupled-cluster methods using pair natural orbitals. WIREs Comput. Mol. Sci., 8(6), e1371 (2018). URL:https://onlinelibrary.wiley.com/doi/abs/10.1002/ wcms.1371,doi:10.1002/wcms.1371.
21. H. J. Werner, C. Köppl, Q. Ma, and M. Schwilk. Explicitly correlated local electron correlation methods in Fragmentation: Towards Accurate Calculations on Complex Molecular Systems. Wiley (2017). 22. E. D. Glendening, J. K. Badenhoop, A. E. Reed, J. E. Carpenter, J. A.
Bohmann, C. M. Morales, C. R. Landis, and F. Weinhold. NBO 6.0. (2013). Theoretical Chemistry Institute, University of Wisconsin: Madi-son, WI, 2013; http://nbo6.chem.wisc.edu/.
23. S. Kassi, D. Petitprez, and G. Wlodarczak. Microwave fourier transform spectroscopy of t-butylchloride and t-butylbromide isotopic species. J. Mol. Struct., 517–518, 375–386 (2000).doi:10.1016/ S0022-2860(99)00296-3.
24. M. Tudorie, L. H. Coudert, T. R. Huet, D. Jegouso, and G. Sedes. Magnetic hyperfine coupling of a methyl group undergoing internal rotation: A case study of methyl formate. J. Chem. Phys., 134(7), 074314 (2011).doi:10.1063/1.3554419.
25. S. Kassi, D. Petitprez, and G. Wlodarczak. Microwave spectrum of isotopic species of urea (NH2)2CO. J. Mol. Spectrosc., 228(2), 293– 297 (2004).doi:10.1016/j.jms.2004.05.002.
26. O. Pirali, M. Goubet, V. Boudon, L. D’Accolti, C. Fusco, and C. Annese. Characterization of isolated 1-aza-adamantan-4-one (C9H13NO) from microwave, millimeter-wave and infrared spectroscopy supported by electronic structure calculations. J. Mol. Spectrosc., 338, 6–14 (2017).
doi:10.1016/j.jms.2017.04.020.
27. M. A. Martin-Drumel, O. Pirali, Y. Loquais, C. Falvo, and P. Bréchignac. Lowest energy vibrational modes of some naphthalene derivatives: Azulene, quinoline, isoquinoline - Experiment and theory. Chem. Phys. Lett., 557, 53–58 (2013).doi:10.1016/j.cplett.2012. 12.022.
28. S. Gruet, O. Pirali, M. Goubet, D. W. Tokaryk, and P. Brechignac. High-resolution far-infrared spectroscopy of n-substituted two-ring polycyclic aromatic hydrocarbons: An extended study. J. Phys. Chem. A, 120(1), 95–105 (2016).doi:10.1021/acs.jpca.5b09626.
29. W. Łodyga, M. Kr˛eglewski, P. Pracna, and Š. Urban. Advanced graphi-cal software for assignments of transitions in rovibrational spectra. J. Mol. Spectrosc., 243(2), 182–188 (2007). doi:10.1016/j.jms. 2007.02.004.
30. C. M. Western. Pgopher: A program for simulating rotational, vibra-tional and electronic spectra. J. Quant. Spectrosc. Radiat. Trans-fer, 186(SI), 221–242 (2017).doi:10.1016/j.jqsrt.2016.04. 010.
31. H. M. Pickett. The fitting and prediction of vibration-rotation spectra with spin interactions. J. Mol. Spectrosc., 148(2), 371–377 (1991).
doi:10.1016/0022-2852(91)90393-O.
32. T. A. Keith. Aimall (version 19.10.12), todd a. keith, tk gristmill software: Overland park ks (2019). URL:http://aim.tkgristmill.com.
33. S. Wojtulewski and S. J. Grabowski. Blue-shifting C – H···Y intramolec-ular hydrogen bonds – dft and aim analyses. Chem. Phys., 309(2), 183–188 (2005).doi:10.1016/j.chemphys.2004.09.008.
34. A. E. Reed, L. A. Curtiss, and F. Weinhold. Interamolecular interactions from a natural bond orbital, donor-acceptor viewpoint. Chem. Rev., 88, 899–926 (1988).doi:10.1021/cr00088a005.
SUPPORTING INFORMATION
Fig. S1. Conformational landscape of 1-hydroxynaphthalene: Potential energy curve resulting from the MP2/cc-pVTZ calculation
(values at equilibrium). Energies are indicated relative to trans-1-hydroxynaphthalene. Angle values are corresponding to the C – C – O – H dihedral angle.
T ab le S1. Results from the ener gy calculations on the h ydroxynaphthalene molecules. ∆ E v alues are relati v e to the lo wer ener gy conformer of each species. 1-h ydr oxynaphthalene 2-h ydr oxynaphthalene cis TS tr ans cis TS tr ans B97-1 a E eq / E h -461.1344478 -461.1302821 -461.1364003 -461.1368716 -461.1301344 -461.1359809 E ZPE / E h -460.9839570 -460.9802350 -460.9854290 -460.9860680 -460.9803100 -460.9853160 ω /cm − 1 87.70 330.20 140.10 122.10 350.90 122.30 ∆ E eq / kJ mol − 1 5.1 16.1 0 0 17.69 2.34 /cm − 1 429 1,343 0 0 1,478.64 195.49 ∆ E ZPE / kJ mol − 1 3.9 11.7 d 0 0 13.0 d 1.97 /cm − 1 323 975 d 0 0 1,088 d 165.04 MP2 b E eq / E h -460.1680434 -460.1643641 -460.1699345 -460.1698188 -460.1636588 -460.1688217 E ZPE / E h -460.0171110 -460.0135300 -460.0183590 -460.0184030 -460.0130740 -460.0175580 ω /cm − 1 -57.20 332.10 138.40 120.90 340.90 120.90 ∆ E eq / kJ mol − 1 5.0 14.6 0 0 16.2 2.6 /cm − 1 415 1,223 0 0 1,352 219 ∆ E ZPE / kJ mol − 1 3.3 10.7 d 0 0 11.9 d 2.2 /cm − 1 274 895 d 0 0 994 d 185 h ybrid c E ZPE / E h -460.0175526 -460.0143170 -460.0189632 -460.0190152 -460.0138344 -460.0181568 ∆ E ZPE / kJ mol − 1 3.7 10.2 d 0 0 11.5 d 2.3 /cm − 1 310 855 d 0 0 962 d 188 Pop. e / % 18 82 71 29 ∆ E 12 f / kJ mol − 1 – – 0.1 0 – – /cm − 1 – – 11 0 – – a B97-1/cc-pVTZ harmonic calculation b MP2/cc-pVTZ harmonic calculation c h ybrid B97-1/MP 2/cc-pVTZ calculation, see te xt d F or the transition states, ∆ E ZPE is calculated according to the formula ∆ E ZPE = E ( TS ) − E ( GS ) − ω ( TS ) / 2 e Population at 300 K f Ener gy dif ference between the lo wer state conformers of 1-and 2-h ydroxynaphthalene
T ab le S2. Results from the ener gy calculations on the naphthaldeh yde molecules. ∆E v alues are relati v e to the lo wer ener gy conformer of each species. 1-naphthaldeh yde 2-naphthaldeh yde cis TS tr ans cis TS tr ans B97-1 a Eeq / Eh -499.2369962 -499.2233235 -499.2339542 -499.2386084 -499.2243882 -499.2398478 EZPE / Eh -499.080972 -499.06842 -499.078206 -499.082942 -499.069577 -499.084122 ω /cm − 1 85.6 158.6 84.4 86.3 173.9 78.8 ∆ Eeq / kJ mol − 1 0 35.9 8.0 3.3 40.6 0 /cm − 1 0 3001 668 272 3393 0 ∆ EZPE / kJ mol − 1 0 32.0 7.3 3.1 37.1 0 /cm − 1 0 2676 607 259 3105 0 MP2 b Eeq / Eh -498.1872922 -498.1752513 -498.1841598 -498.1880392 -498.1751578 -498.1893045 EZPE / Eh -498.030536 -498.01949 -498.027667 -498.031632 -498.019528 -498.032875 ω /cm − 1 79.3 145.3 65.7 83.7 162.9 77 ∆ Eeq / kJ mol − 1 0 31.6 8.2 3.3 37.1 0 /cm − 1 0 2643 687 278 3105 0 ∆ EZPE / kJ mol − 1 0 28.1 7.5 3.3 34.1 0 /cm − 1 0 2352 630 273 2848 0 h ybrid c EZPE / Eh -498.031268 -498.0203478 -498.0284116 -498.0323728 -498.0203466 -498.0335787 ∆ EZPE / kJ mol − 1 0 27.7 7.5 3.2 33.7 0 /cm − 1 0 2317 627 265 2817 0 Pop. e / % 95 5 22 78 ∆ E12 f / kJ mol − 1 6.1 – – – – 0 /cm − 1 507 – – – – 0 a B97-1/cc-pVTZ harmonic calculation b MP2/cc-pVTZ harmonic calculation c h ybrid B97-1/MP2/cc-pVTZ calculation, see te xt dF or the transition states, ∆ EZPE is calculated according to the formula ∆ EZPE = E ( TS ) − E ( GS ) − ω ( TS ) / 2 ePopulation at 300 K fEner gy dif ference between the lo wer state conformers of 1-and 2-naphthaldeh yde
Table S3. Energies in kJ mol−1of the four conformers of naphthaldehyde relative to the most stable isomer trans 2-naphthaldehyde computed at various levels of theory. CBS values are extrapolated from aug-cc-pVTZ and aug-cc-pVQZ basis set calculations.
Method 1-naphthaldehyde 2-naphthaldehyde
cis trans cis trans
MP2/cc-pVTZa 5.3 13.5 3.3 0.0
MP2/CBS 5.8 13.9 3.6 0.0
CCSD(T)/CBS 6.6 14.0 3.6 0.0
PNO-LCCSD(T)-F12/aug-cc-pVTZ 6.7 13.8 3.5 0.0
Table S4. Calculated IR fundamental vibrational modes of cis-1-naphthaldehyde and trans-2-naphthaldehyde and comparison with
proposed experimental assignments. Energies are given in cm−1intensities in km mol−1.
cis-1-naphthaldehyde trans-2-naphthaldehyde
B97-1 MP2 Hybrid Exp. B97-1 MP2 Hybrid Exp.
ν sym. Eh Ea Eh Ih E E Eh Ea Eh Ih E E 1 A’ 3224 3070 3268 7.5 3114 3064 3189 3062 3234 3.5 3107 2 A’ 3184 3062 3232 8.5 3109 3064 3185 3061 3233 11.6 3109 3070 3 A’ 3182 3077 3230 14.0 3125 3064 3173 3052 3220 13.4 3099 2980 4 A’ 3167 3032 3215 10.5 3080 3064 3161 3045 3205 0.7 3089 5 A’ 3158 3055 3202 6.4 3099 3064 3159 3009 3203 5.3 3053 6 A’ 3154 3009 3200 0.4 3055 3064 3155 3013 3200 2.3 3058 7 A’ 3150 3018 3195 2.7 3064 3064 3143 2998 3184 6.1 3039 8 A’ 2861 2684 2936 118.0 2759 2721 2870 2680 2949 108.4 2760 2717 9 A’ 1772 1743 1740 161.0 1712 1715 1781 1752 1745 231.6 1717 1720 10 A’ 1653 1611 1669 3.7 1628 1660 1620 1678 6.0 1638 1637 11 A’ 1626 1592 1625 7.0 1591 1601 1635 1599 1635 4.5 1600 1603 12 A’ 1605 1566 1619 11.1 1580 1583 1606 1572 1617 5.2 1582 13 A’ 1542 1504 1561 29.8 1523 1516 1539 1504 1556 2.2 1521 14 A’ 1488 1456 1495 0.9 1462 1495 1467 1506 10.7 1478 1468 15 A’ 1474 1437 1491 7.3 1454 1457 1471 1439 1491 12.7 1459 1447 16 A’ 1438 1405 1481 5.2 1448 1457 1424 1408 1472 2.5 1456 17 A’ 1418 1378 1443 2.9 1404 1401 1363 1456 0.1 1418 18 A’ 1388 1351 1435 2.8 1399 1388 1357 1416 1.6 1385 19 A’ 1368 1335 1414 2.6 1381 1369 1338 1374 25.2 1343 1347 20 A’ 1292 1249 1290 2.1 1248 1285 1271 1294 37.5 1279 1262 21 A’ 1237 1211 1266 18.6 1240 1220? 1278 1255 1284 4.5 1261 22 A’ 1232 1204 1240 16.5 1212 1214? 1236 1212 1259 0.0 1235 23 A’ 1189 1165 1192 12.7 1168 1171 1184 1163 1195 41.5 1174 1154 24 A’ 1184 1155 1181 2.1 1152 1172 1154 1178 0.1 1160 25 A’ 1165 1142 1166 3.4 1143 1165 1166 1161 0.1 1163 26 A’ 1097 1077 1103 2.3 1084 1137 1124 1136 21.6 1123 1121 27 A’ 1069 1041 1074 35.4 1046 1056 1039 1022 1047 2.3 1030 28 A’ 1042 1012 1050 3.9 1020 969 956 970 1.0 956 29 A’ 895 881 893 15.3 878 887 891 879 893 6.2 881 882 30 A’ 805 795 807 0.7 797 785 774 789 21.2 778 785 31 A’ 718 704 718 15.1 704 712 766 755 767 23.7 757 763 32 A’ 659 649 656 18.3 646 647 640 633 632 1.9 626 33 A’ 553 547 551 2.5 544 548 612 606 609 3.6 603 603 34 A’ 502 495 498 1.6 492 497 520 514 516 0.1 511 35 A’ 437 433 434 1.5 431 430 390 389 386 5.5 384 388 36 A’ 366 362 360 0.1 356 349 350 348 2.8 349 37 A’ 218 166 219 6.5 166 225 ? 177 184 175 6.0 183 177 38 A” 1022 1003 1015 0.4 995 1028 1011 1018 1.1 1001 39 A” 1016 1011 977 0.7 973 1002 994 968 0.1 961 40 A” 995 994 962 0.8 962 998 995 960 0.1 957 41 A” 979 975 951 0.1 947 972 968 948 1.5 943 42 A” 937 930 909 0.0 902 918 909 878 9.7 869 ? 43 A” 893 880 870 0.0 856 880 864 859 20.1 843 857 44 A” 823 818 806 91.7 801 802 843 831 835 35.4 822 820 45 A” 792 777 755 8.0 740 788 778 754 27.7 745 742 46 A” 753 740 725 0.3 711 760 751 726 0.2 717 47 A” 639 637 614 0.0 612 645 640 620 0.9 614 48 A” 539 529 529 6.0 520 525 512 508 502 0.3 497 49 A” 479 472 469 0.4 462 485 479 477 15.9 471 472 50 A” 414 408 407 3.6 402 400 401 395 393 0.0 387 51 A” 273 266 265 5.7 258 255 297 289 293 3.3 285 52 A” 181 178 178 0.9 175 192 188 187 4.7 184 181 53 A” 152 146 147 3.7 141 143 160 156 157 4.8 152 152 54 A” 86 76 79 3.5 70 76 79 78 77 1.6 76
Table S5. Rotational constants of the four studied species at various stages of the calculations and comparison with the experimental
values.
MP2 hybridb exp. δhybridc
Be ∆a B0 B0 / % trans-1-hydroxynaphthalene A / MHz 1947 -14 1934 1942.100623 (53) 0.42 B / MHz 1140 -8 1132 1133.623211 (21) 0.14 C / MHz 719 -5 714 716.017762 (14) 0.28 cis-2-hydroxynaphthalene A / MHz 2862 -25 2837 2849.155543 (64) 0.43 B / MHz 828 -4 823 824.632161 (25) 0.20 C / MHz 642 -4 638 639.723697 (15) 0.27 cis-1-naphthaldehyde A / MHz 1389 -8 1380 1384.40872 (21) 0.32 B / MHz 1004 -8 995 999.015243 (71) 0.40 C / MHz 583 -4 579 580.551953 (19) 0.27 trans-2-naphthaldehyde A / MHz 2824 -22 2802 2810.43194 (15) 0.30 B / MHz 583 -3 580 581.095981 (24) 0.19 C / MHz 483 -3 480 481.700564 (18) 0.35 a∆=B 0− Be bBhybrid0 =BMP2e −(BB97e −1− BB970 −1) cδ
Table S6. Rotational constants of trans-1-hydroxynaphthalene in the ground and excited vibrational states. Error (1σ ) on
experimental parameters are given between parenthesis in units of the last digit.
MP2 ∆a hybridb scaledc exp. δhybridd δscalede
/ % / % Equilibrium Ae / MHz 1947 Be / MHz 1140 Ce / MHz 719 Ground state A0 / MHz 1934 1942.100623 (53) 0.42 B0 / MHz 1132 1133.623211 (21) 0.16 C0 / MHz 714 716.017762 (14) 0.26 v51=1 E /cm−1 136 Av / MHz -14 1933 1941 1941.73727 (53) 0.44 0.015 Bv / MHz -8 1132 1134 1132.951050 (68) 0.11 -0.051 Cv / MHz -4 715 717 716.402565 (43) 0.23 -0.030 v50=1 E /cm−1 166.4 Av / MHz -16 1931 1939 1939.60653 (22) 0.44 0.016 Bv / MHz -6 1133 1135 1134.394385 (36) 0.11 -0.053 Cv / MHz -4 715 717 716.571336 (25) 0.23 -0.032 v51=2 E /cm−1 272.2 Av / MHz -15 1933 1941 1941.1817 (43) 0.43 0.003 Bv / MHz -9 1131 1133 1132.3400 (16) 0.12 -0.042 Cv / MHz -4 715 717 716.785770 (55) 0.23 -0.027 v50=2 E /cm−1 332.8 Av / MHz -19 1929 1937 1937.1523 (11) 0.44 0.019 Bv / MHz -6 1134 1136 1135.16069 (49) 0.11 -0.052 Cv / MHz -3 715 717 717.121942 (55) 0.23 -0.030 a∆=B 0− Be bBhybrid0 =BMP2e −(BB97e −1− BB970 −1) cB
scaled=Bvhybrid× B0 exp/B0 hybrid dδ
hybrid= (Bexp.− Bhybrid)/Bhybrid× 100 eδ
Table S7. Full set of rotational parameters (in MHz) for trans-1-hydroxynaphthalene in excited vibrational states. Error (1σ ) on
parameters are given between parenthesis in units of the last digit. Parameters in brackets are fixed to the ground state value.
v51=1 v50=1 v51=2 v50=2 Av 1941.73727(53) 1939.60653(22) 1941.1817(43) 1937.1523(11) Bv 1132.951050(68) 1134.394385(36) 1132.3400(16) 1135.16069(49) Cv 716.402565(43) 716.571336(25) 716.785770(55) 717.121942(55) ∆J× 106 17.9061(20) 18.0313(10) 17.9912(16) 18.0842(16) ∆JK× 103 0.0185871(92) 0.0134017(43) 0.016961(48) 0.014049(34) ∆K× 103 0.04257(14) 0.045458(62) 0.04502(35) 0.03692(23) δJ× 106 6.41897(11) 6.47433(58) [6.43578] [6.43578] δK× 103 0.0360674(88) 0.0338925(51) [0.0351740] [0.0351740] # lines 2 567 2 547 1 093 1 035 RMS / kHz 34 34 72 44
aHybrid rotational constants and MP2 centrifugal distorsion terms, see text bδ = (B
Exp.− BCalc)/BCalc.× 100
Table S8. Calculated charges on atoms in naphthalene, benzaldehyde and the two isomers of naphthaldehyde at the
MP2/aug-cc-pVQZ level using NBO6 software. Values are given in atomic units. See Figure5for atomic numbering. 1-naphthaldehyde 2-naphthaldehyde naphthalene benzaldehyde
atom # cis trans cis trans atom #
C 1 -0.0738 -0.0937 -0.1125 -0.0997 -0.1726 C 1 -0.0954 C 2 -0.2295 -0.2246 -0.1247 -0.1105 -0.2177 C 2 -0.2109 C 3 -0.1628 -0.1388 -0.2209 -0.2056 -0.2177 C 3 -0.2029 C 4 -0.1641 -0.2116 -0.1730 -0.1916 -0.1726 C 4 -0.1497 C 5 -0.1352 -0.1279 -0.2285 -0.1341 -0.1726 C 5 -0.2112 C 6 -0.2326 -0.2358 -0.1421 -0.2395 -0.2177 C 6 -0.2130 C 7 -0.1812 -0.2067 -0.2324 -0.2096 -0.2177 H 7 0.2354 C 8 -0.2247 -0.2101 -0.1789 -0.1277 -0.1726 H 8 0.2142 C 9 0.0053 0.0015 -0.0601 -0.1527 -0.0192 H 9 0.2068 C 10 -0.0863 -0.0360 -0.0154 0.0086 -0.0192 H 10 0.2141 H 11 0.2483 0.2108 0.2132 0.2020 0.1928 H 11 0.2134 H 12 0.2132 0.2165 0.2168 0.2167 0.2072 H 12 0.1093 H 13 0.2158 0.2151 0.2031 0.2152 0.2072 O 13 -0.4800 H 14 0.2002 0.1969 0.2132 0.1996 0.1928 C 14 0.3698 H 15 0.2087 0.2088 0.2128 0.2105 0.1928 H 16 0.2074 0.2050 0.2160 0.2335 0.2072 H 17 0.2145 0.2366 0.2166 0.1975 0.2072 H 18 0.1087 0.1136 0.1095 0.1082 0.1928 O 19 -0.4903 -0.4805 -0.4806 -0.4817 C 20 0.3583 0.3607 0.3677 0.3607
Table S9. Calculated charges on atoms in naphthalene, hydroxybenzene, and the two isomers of hydroxynaphthalene at the
MP2/aug-cc-pVQZ level using NBO6 software. Values are given in atomic units. See Figure5for atomic numbering. 1-hydroxynaphthalene 2-hydroxynaphthalene naphthalene hydroxybenzene
atom # cis trans cis trans atom #
1 0.2765 0.2716 -0.3345 -0.2098 -0.1726 C 1 0.3414 2 -0.2756 -0.2554 0.3487 0.2520 -0.2177 C 2 -0.2838 3 -0.2136 -0.2243 -0.2971 -0.2815 -0.2177 C 3 -0.1891 4 -0.1675 -0.1637 -0.1172 -0.1845 -0.1726 C 4 -0.2452 5 -0.1778 -0.1583 -0.2127 -0.1457 -0.1726 C 5 -0.1900 6 -0.2466 -0.2540 -0.2294 -0.2481 -0.2177 C 6 -0.3103 7 -0.1938 -0.1356 -0.2295 -0.2186 -0.2177 H 7 0.2241 8 -0.1811 -0.2261 -0.1486 -0.1936 -0.1726 H 8 0.2142 9 -0.0945 -0.0539 0.0058 -0.0029 -0.0192 H 9 0.2142 10 -0.0007 -0.0876 -0.0411 -0.0441 -0.0192 H 10 0.2140 11 0.1795 0.2282 0.1936 0.2048 0.1928 H 11 0.2077 12 0.2105 0.2033 0.2099 0.2134 0.2072 H 12 0.4729 13 0.2161 0.2118 0.2144 0.2119 0.2072 O 13 -0.6700 14 0.2070 0.2075 0.2065 0.1990 0.1928 15 0.1963 0.2026 0.1960 0.2069 0.1928 16 0.2254 0.2026 0.2267 0.2104 0.2072 17 0.2146 0.2101 0.2046 0.2099 0.2072 18 0.4751 0.4785 0.4742 0.4749 0.1928 19 -0.6498 -0.6573 -0.6702 -0.6542