HAL Id: hal-02370947
https://hal.archives-ouvertes.fr/hal-02370947
Submitted on 22 Sep 2020
HAL is a multi-disciplinary open access
archive for the deposit and dissemination of
sci-L’archive ouverte pluridisciplinaire HAL, est
destinée au dépôt et à la diffusion de documents
Laramee, Sean O’Donoghue, Marc Baaden, Matthieu Chavent
To cite this version:
Xavier Martinez, Michael Krone, Naif Alharbi, Alexander Rose, Robert Laramee, et al.. Molecular
Graphics: Bridging Structural Biologists and Computer Scientists. Structure, Elsevier (Cell Press),
2019, 27 (11), pp.1617-1623. �10.1016/j.str.2019.09.001�. �hal-02370947�
Molecular Graphics: Bridging Structural Biologists and
Computer Scientists
X. Martinez1, M. Krone2, N. Alharbi3, A. Rose4, R. S. Laramee3, S.
O’Donoghue5,6,7, M. Baaden1, M. Chavent8
1Laboratoire de Biochimie Th´eorique, CNRS, UPR9080, Institut de Biologie
Physico-Chimique, France
2Big Data Visual Analytics in Life Sciences, University of T¨ubingen, Germany 3Department of Computer Science, Swansea University, Wales
4RCSB Protein Data Bank, San Diego Supercomputer Center, University of California,
USA
5Garvan Institute of Medical Research, Sydney, Australia 6University of New South Wales (UNSW), Sydney, Australia
7CSIRO Data61, Sydney, Australia
8Institut de Pharmacologie et de Biologie Structurale IPBS, Universit´e de Toulouse, CNRS,
UPS, France
Abstract
Visualization of molecular structures is one of the most common tasks carried out by structural biologists, yet the technical details and advances required to efficiently display molecular structures are often hidden from the end user. During decades molecular viewer software such as Chimera, COOT, PyMOL, or VMD provided the most common solutions to quickly visualize structures. Nowadays, new and efficient ways to depict molecular objects are changing how structural biologists interact with their data. Such novelties are often driven by advances made by computer scientists, but an important gap remains between this community and the final users such as structural and computational biol-ogists. In this perspective article, we clarify how developments from computer graphics and data visualization have led to novel ways of understanding protein structure. We present future developments from computer science that will be beneficial for structural biology. By pointing to canonical papers and explaining technical progress underlying new graphical developments in simple terms, we hope to promote communication between the di↵erent communities to shape future developments in molecular graphics.
1 2 3 4 5 6 7 8 9 10 11 12 13 14 15 16 17 18 19 20 21 22 23 24 25 26 27 28 29 30 31 32 33 34 35 36 37 38 39 40 41 42 43 44 45 46 47 48 49 50 51 52 53 54
Keywords: Molecular visualization, Molecular Graphics 2010 MSC: 00-01, 99-00
1. Introduction and Motivation
Molecular graphics tools and methods has been actively developed for over 50 years, always tightly linked to advances in computer hardware [1]. Early on, key developments in molecular graphics attracted interest from a broad range of scientists — hence, some were published in journals such as Science [2].
To-5
day, however, the field has fragmented into two main communities: advances in computer graphics are almost always reported in publications aimed at com-puter scientists, while applications of these methods that uncover new biological insights are reported in journals aimed at structural biologists. One key issue caused by this fragmentation is that publications are often difficult to access
10
for scientists outside of the respective sub-field — fortunately, this situation is slowly improving due to the increase in open-access publication. A related issue is that interaction between the two communities is low as they rarely at-tend common meetings. As a result of these issues, many structural biologists are unaware of interesting advances in molecular graphics methods; conversely,
15
computer scientists working in molecular graphics are not always aware of or focused on the most interesting visualization challenges raised by cutting edge experimental methods.
This perspective article aims to help address some of these issues result-ing from the fragmentation of these communities. We begin by briefly
review-20
ing highlights in the history of molecular graphics. We then outline some of core computational visualization methods currently used in molecular graph-ics tools, and explain how they help advance our understanding of biomolecu-lar structures. We also discuss methods currently being developed to address emerging challenges, such as structures derived from cryo-electron microscopy
25 (cryo-EM) [3, 4]. 7 8 9 10 11 12 13 14 15 16 17 18 19 20 21 22 23 24 25 26 27 28 29 30 31 32 33 34 35 36 37 38 39 40 41 42 43 44 45 46 47 48 49 50 51 52 53 54
2. A Brief History of Molecular Graphics
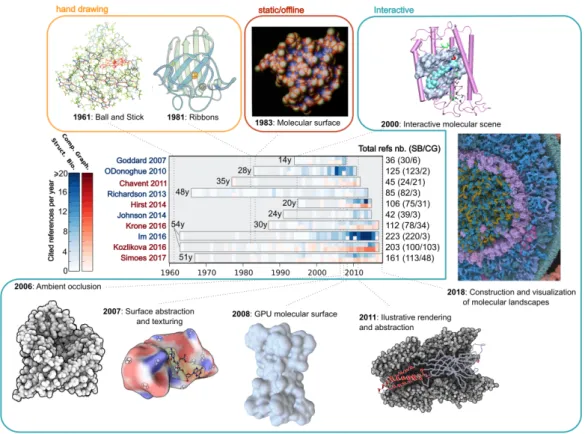
Some key moments in molecular graphics are summarized in figure 1, which also lists several recent review articles.
As described in the review from Jane and David Richardson [13], the
ear-30
liest molecular graphics were drawings and physical models created by hand. As these began to be replaced by computer graphics, a key initial focus was on inventing novel visual representations that help push forward the under-standing of biomolecular function by emphasising important structures features. Two striking examples were: (1) the ribbon representation developed by Jane
35
Richardson, published in Nature in 1977 [5] and (2) the molecular surface rep-resentation developed by Michael Connolly, published in Science in 1983 [14]. Such developments profoundly transformed the practise of structural biology, leading to the launch of the Journal of Molecular Graphics in 1983, first giving the field its own dedicated journal.
40
Since then, a large number of molecular graphics tools have been developed. The reviews from Goddard et al. [15], O’Donoghue et al. [16], and Johnson and Hertig [17] each give a guide to the available tools and help identify the best visualization methods for addressing specific biological questions. Johnson and Hertig [17] further present visual tools and methods for 3D animations
45
and describe how these can be e↵ectively combined with visual metaphors to create visual narratives that explain complex, biomolecular mechanisms, either to other scientists or to the general public.
In recent years, as described in the review from Im et al. [18], structural biology has become increasingly interconnected with many other kinds of data,
50
and the visualization challenges have moved from the static views of single molecules toward dynamics views of much larger scales, such as whole viruses, subcellular organelles, or even entire cells.
These challenges have inspired intense research within the computer graphics community, aimed at creating solutions that take advantage of advances in GPU
55
capabilities (described by Chavent et al. [19]), as well as new analysis and
7 8 9 10 11 12 13 14 15 16 17 18 19 20 21 22 23 24 25 26 27 28 29 30 31 32 33 34 35 36 37 38 39 40 41 42 43 44 45 46 47 48 49 50 51 52 53 54
mersive approaches (described by Hirst et al. [20]). These recent developments are summarized in three recent state of the art reviews of molecular graphics, each describing technical developments that can help structural biologists choose the best algorithms for a dedicated purpose. The review from Kozlikova et al.
60
[21] details algorithms that can be used to render small molecules up to large macromolecular assemblies, such as microtubules. The reviews from Krone et al. [22] and Simoes et al. [23] focus on detection of cavities on protein surfaces and their rendering.
Mostly, these developments in computer graphics have been first created
65
as research prototypes, rather than as usable implementations, and have been reported in computer science publications. As a result, while some of these advances have been incorporated in widely-used molecular graphics tools (e.g., VMD [24, 25], Chimera [26]), unfortunately — as noted by Goddard et al. 10 years ago [15] — many developments in computer graphics are still not visible
70
to, or accessible by, the structural biology community. This is evident from the very small fraction of computer graphics papers cited in recent reviews published for structural biologists (figure 1).
Thus, one of our goals for this work is to highlight recent computer graphics advances that have not yet been implemented in broadly accessible molecular
75
viewers, but have potential to help address the emerging challenges in molecular graphics.
3. Advanced Lighting and Shading E↵ects
Many advances have been made in lighting and shading e↵ects applied to molecular graphics that can, in turn, help users understand the overall spatial
80
organization of complex biomolecules (figure 2).
Blinn-Phong lighting and real-time shadows: Currently, most molec-ular graphics tools use an approximation of physically based lighting called the Blinn-Phong model [27, 28], composed of three terms: (1) an ambient term that models incident light coming equally from all directions; (2) a di↵use term; and
85 7 8 9 10 11 12 13 14 15 16 17 18 19 20 21 22 23 24 25 26 27 28 29 30 31 32 33 34 35 36 37 38 39 40 41 42 43 44 45 46 47 48 49 50 51 52 53 54
(3) a specular term that models surface reflections. Together, these three terms give a fairly realistic approximation of the local lighting and shading condi-tions at the surface of smooth 3D objects (figure 2). However, the Blinn-Phong model has key limitations; for example, it cannot convey shadows cast between objects. A range of computational strategies have been developed to overcomes
90
these limitations; for example, Krone et al. [29] recently presented a strategy that can efficiently compute shadows for large scale molecular systems, such as virus capsids with up to 1 million atoms.
Ambient occlusion: Ambient occlusion (AO) is a shading and rendering technique that adds depth cues which, in turn, can greatly help in revealing
95
detailed features for complex, 3D objects [30, 31] (see figure 2). For static 3D molecules, AO has been available for many years via the QuteMol viewer from Tarini et al. [8]. AO e↵ects has also become available in more popular molecular graphics tools, such as VMD [32] and, more recently, ChimeraX [26].
Ambient occlusion darkens buried parts of a structure — mostly cavities
100
and crevices — to approximate non-directional lighting e↵ects. AO relies on a depth-map, computed for each point-of-view around the molecule; this is then used to determine and store the visibility of each atom in a texture map. If the atoms are hidden from the camera, the texel (one element of the texture map) of the corresponding part of this atom is darkened. These occlusion maps
105
are computed once on the GPU; the e↵ect is then very fast to render as long as the molecule is static. For dynamic molecular data, a fast approximation of AO was proposed by Grottel et al. [33] that allows for interactively rendering of dynamics systems composed of millions of atoms.
Ray-tracing: Ray tracing methods provide a much more realistic
simula-110
tion of lighting by computing the paths and reflections that photons would travel from each light source to the view point. This produces photorealistic rendering that can be very helpful in conveying complex, 3D molecular structures (see figure 2). However, as these calculations require much computing power, many users only use ray tracing when finalizing high-quality, static images for
pub-115
lication. Two available tools that can be used in this way are ePMV [34] and
7 8 9 10 11 12 13 14 15 16 17 18 19 20 21 22 23 24 25 26 27 28 29 30 31 32 33 34 35 36 37 38 39 40 41 42 43 44 45 46 47 48 49 50 51 52 53 54
BioBlender [35]; both these tools use the open-source 3D modelling software Blender on their backend for ray tracing.
The VMD tool [7] includes theTachyon ray-tracer for computing static im-ages, and further o↵ers real-time ray-tracing via highly efficient CPU (OSPRay)
120
and GPU (OPTIX-CUDA) methods [32]. This approach was recently used to interactively display very large, dynamic molecular systems containing dozens of millions of atoms, such as chromatophores [25].
In summary, thanks to recent advances in both hardware and software, molecular graphics tools can now feasibly combine real-time global illumination
125
with a range of non-photorealistic rendering methods; this provide high-quality depth cues that can greatly help users with the challenging task of understand-ing complex, 3D molecular structures [16].
4. Molecular Surface Rendering
Visualizing molecular surfaces has proven to be very useful representations
130
for revealing functional aspects of biomolecules, such as proteins and nucleic acids. Thus, as described in the review from Kozl´ıkov´a et al. [21], many di↵erent methods have been proposed to calculate molecular surfaces, each designed to highlight specific biomolecular properties. In this section, we briefly mention the methods that are most commonly used, as well as a few of the more promising
135
methods that have recently been proposed.
One of the most commonly used molecular surface methods is to simply represent each atom as a sphere with corresponding van der Waals (vdW) radius (figure 2). In addition to being quick to compute, this method has the advantage that it automatically conveys a sense of spatial scale, since atoms
140
are directly visualized; however, a limitation of the vdW surface is that it is often difficult to see where other molecules (e.g.,ligands) are likely to interact favourably.
To address this limitation, the Solvent Accessible Surface (SAS) was proposed [36]. This is calculated using a spherical probe with a radius set to
145 7 8 9 10 11 12 13 14 15 16 17 18 19 20 21 22 23 24 25 26 27 28 29 30 31 32 33 34 35 36 37 38 39 40 41 42 43 44 45 46 47 48 49 50 51 52 53 54
match a certain ligand or solvent molecule of interest (e.g., water); the probe is rolled over the vdW surface, and the center of the probe traces out the SAS. The SAS thus shows which surface atoms are accessible by that chosen ligand or solvent; however, one limitation is that the total volume described by the SAS is significantly larger than the true molecular volume.
150
This limitation is mostly overcome by the Solvent Excluded Surface (SES), which is also known as the Smooth Molecular Surface, or the Connolly Surface [6, 14]. The SES is defined similarly to the SAS, but uses the probe contact surface instead of the probe center, thereby closing gaps that are inacces-sible to the probe while also giving a better approximation to the true molecular
155
volume. Over the past decade, many fast methods to compute and render the SES have been proposed: Krone et al. [37] used shader-based ray casting to render with high image quality. Lindow et al. [38] accelerated the computation on multi-core CPUs, while Krone et al. [39] presented a GPU-based algorithm to compute the surface interactively. Jurcik et al.. [40] developed a method
160
based on the work of Krone et al. [37, 39] to render the SES semi-transparently. Hermosilla et al. [41] computed the SES progressively on a 3D grid and rendered the results using volume rendering.
In addition to the commonly used SES, a range of additional molecular surface definitions have been proposed: (1) The Ligand Excluded Surface
165
by Lindow et al. [42] uses the actual ligand instead of a spherical probe to carve out the surface; (2) Gaussian Surfaces can be related to the electron density cloud of a molecule, modelled by radially symmetric Gaussian density kernels for each atom. Krone et al. [24] presented the fastQuicksurf algorithm to compute such surfaces on the GPU, available in VMD. (3) The smooth Molecular Skin
170
Surface [43] can approximate the SES and may be rendered using shader-based ray casting (see work by Chavent et al. [11] and figure 1, 2008). Later, Lindow et al. [38] refined their approach and presented a fast, CPU-parallelized computation. (4) Cipriano and Gleicher [9] presented an SES-based Molecular Surface Abstraction, which smoothens areas of high frequency (see figure 1,
175 2007). 7 8 9 10 11 12 13 14 15 16 17 18 19 20 21 22 23 24 25 26 27 28 29 30 31 32 33 34 35 36 37 38 39 40 41 42 43 44 45 46 47 48 49 50 51 52 53 54
In summary, molecular surface rendering methods, such as SES, remain very common in molecular graphics; however, these methods are not well suited for all kinds of structural data.
5. Volume Rendering
180
Volume rendering methods are used to visualize density maps from X-ray crystallography or from cryo-EM (Figure 3). A commonly used method isdirect volume rendering (DVR), in which the density map is shown as a fog of vary-ing opacity and color. DVR is often implemented via GPU-based ray marchvary-ing. Figure 3 (top left) shows a direct volume rendering of a cryo-EM map in
combi-185
nation with a fitted protein structure. For some tasks, users might be interested in a certain interface of the volumetric data; in such cases, visualizing an iso-surface is a feasible approach (see Figure 3 top right).
Volume rendering methods are also used for a range of other kinds of molecu-lar data. For example, electrostatic fields are often visualized with either
isosur-190
faces or field lines (Figure 3, bottom left and right, respectively). Additionally, volume rendering methods has been used to show uncertainty in biomolecular structures.
With modern GPUs, volume rendering can be done interactively [44]. Al-ternatively, interactivity can also be achieved with CPU-based methods. For
195
example, Knoll et al. [45] recently presented a CPU-based volume rendering method for interactive ray tracing. They approximated the electron density field using radial basis functions for each atom to visualize molecular data, similar to the Gaussian surfaces mentioned in Section 4, which are isosurfaces extracted from the Gaussian volume.
200
6. Dynamics and Flexibility
Biomolecules are often intrinsically very dynamic and flexible, leading to po-sitional uncertainty in experimentally derived models. Many of these dynamic
7 8 9 10 11 12 13 14 15 16 17 18 19 20 21 22 23 24 25 26 27 28 29 30 31 32 33 34 35 36 37 38 39 40 41 42 43 44 45 46 47 48 49 50 51 52 53 54
properties can be experimentally measured [46] and modeled in molecular sim-ulations [47]. In any case, it is still challenging to clearly convey dynamic
205
properties visually.
One approach is to replace precisely defined atomic positions by probability distributions [48], another to accumulate sampled conformations on a grid and depict an isosurface or a volume rendering [49]. Alternatively, a given graphical representation can be made thicker or more fuzzy when positional uncertainty is
210
observed, versus making it thinner and well defined for precise conformations, as is commonly applied to tubular ’sausage plot’ representation of a protein back-bone [50, 51]. Other options are to depict thermal vibrations of atoms through multi-layered semi-transparent surfaces [52] or to use voxel maps for selected flexible elements such as loops or domains in proteins [53]. Recently, Schulz et
215
al. [54] presented approaches to map uncertainty values like positional uncer-tainty or flexiblity to the cartoon representation of a protein using geometric distortion and transparency. Figure 4 depicts flexibility using a motion blur e↵ect.
Another approach is to enrich common representations by adding cues
in-220
dicating flexibility. Bryden et al. [55] used glyphs combining arcs and arrows to illustrate directional molecular flexibility for clusters of atoms that exhibit a synchronized rotational motion. Fioravante et al. [56] used color or cone glyphs to depict motional correlations in proteins, based on principal component anal-ysis and covariance clustering.
225
Yet another approach is to use abstractions to recapitulate the observed motion. Dabdoub et al. [57] draw pathlines of selected atoms to visualize the dynamics of a molecule and add more visual cues through semi-transparent ribbons displaying the movement of bonds. This approach allows the viewer to follow short parts of a trajectory, yet the visual representation might quickly
230
get confusing for very complex movements.
7 8 9 10 11 12 13 14 15 16 17 18 19 20 21 22 23 24 25 26 27 28 29 30 31 32 33 34 35 36 37 38 39 40 41 42 43 44 45 46 47 48 49 50 51 52 53 54
7. Multi-scale Visualization
Driven by advances in experimental methods [4], in computational model-ing [18], and in integrative approaches [58], the size and complexity of molecular systems amenable to structural biology is rapidly increasing. This, in turn, is
235
creating new visualization challenges.
Inspired by David Goodsell’s pioneering depictions of biomolecular land-scapes [59], several recent initiatives in computer graphics have taken on the challenge of constructing such models [12]. These models can be useful both for research [60, 61] as well as communication [62].
240
To facilitate navigation in such complex and crowded landscapes, a range of multiscale molecular visualization techniques have been developed; these are described in a recent survey from Miao et al. [63]. A key method is to auto-matically adapt the level of molecular detail, depending on the proximity of the camera. Thus, Parulek et al. proposed a continuous and visual abstraction to
245
pass from a very precise protein surface to a simple vdW representation as a function of the distance between the scene and the user’s point of view [64] (see figure 4). A similar approach was used to represent DNA origami structures at di↵erent scales [65] (see figure 4). Such seamless transformations can also be applied to pass efficiently from one protein depiction to another for illustrative
250
purposes [10] (see figure 1).
These developments pave the way towards systems that enable interactive exploration of molecular-scale models of entire cells [66, 67] (see figure 4).
8. New Software Platforms for Molecular Graphics
Currently, most molecular graphics tools that structural biologists use as
255
a mainstay are implemented as dedicated, stand-alone applications. However, this is set to change.
Recent advances in web technology are driving rapid developments in web-based molecular graphics tools, as outlined in several recent reviews [69, 70, 71]. One of the main drivers has been the WebGL API, which gives native support
260 7 8 9 10 11 12 13 14 15 16 17 18 19 20 21 22 23 24 25 26 27 28 29 30 31 32 33 34 35 36 37 38 39 40 41 42 43 44 45 46 47 48 49 50 51 52 53 54
for GPU hardware-acceleration for molecular graphics web-apps, such as NGL Viewer [72], LiteMol [73], and Jolecule [74]. Other driving technologies include WebWorkers (e.g., used in NGL Viewer to calculate molecular surfaces o↵ the main thread), WebSockets (e.g., used to facilitate interactive visualization of molecular dynamics trajectories [75]), and WebVR. In turn, this new
genera-265
tion of molecular graphics web-apps are being re-deployed as components on many other web sites. For example, they are used by the world-wide Protein Data Bank [76] on each of its three web sites (rcsb.org, pdbe.org, pdbj.org). Ad-ditionally, tbey are used by the SwissModel [77] and Aquaria [78] resources to facilitate access to millions of 3D structures derived from large-scale modeling.
270
Currently, however, most web-based molecular graphics tools do not yet o↵er the full range of functionality available with more established, stand-alone tools (e.g., Chimera, VMD, etc.). This may soon change, driven by open-source, col-laborative projects such as the recently launched Mol* initiative (molstar.org), aimed at developing a common framework for web molecular graphics.
275
Another relatively new software platform for molecular graphics is the Unity 3D game engine, which has been used to create the molecular editor Unity-Mol [68] and Unity-MolecularRift [79], a tool for drug design. Developing in Unity can greatly simplify deployment to AR and VR devices (e.g., Oculus Rift, Hololens) [80].
280
Finally, molecular graphics is increasingly being used within professional animation software platforms. For the open-source, 3D modeling tool Blender, the plugin BioBlender facilitates use of biomolecular structures [81], while the Pyrite plugin facilitates use of molecular dynamics simulations [82]. For the commercial 3D modeling tool Autodesk Maya, the plugin Molecular Maya ([83])
285
facilitates use of biomolecules.
9. Conclusion
We believe that increased adoption of some of these promising methods has significant potential to advance structural biology by improving how structural
7 8 9 10 11 12 13 14 15 16 17 18 19 20 21 22 23 24 25 26 27 28 29 30 31 32 33 34 35 36 37 38 39 40 41 42 43 44 45 46 47 48 49 50 51 52 53 54
biologists see and think about their data.
290
By covering references to state of the art surveys written by well recognized teams in the field, the perspective may further provide an entry point to contact computer graphics researchers to implement new rendering techniques which will definitely benefit structural biology.
To further help realizing this goal, we would also encourage readers to
con-295
sider participating in scientific events that bring structural biologists together with researchers working in computer graphics — meetings such as VIZBI [84], BioVis [85], and MolVA [86].
References
300
[1] C. Levinthal, Molecular model-building by computer, Scientific American 214 (6) (1966) 42–52, cited By 131. doi:10.1038/ scientificamerican0666-42.
[2] R. Langridge, T. E. Ferrin, I. D. Kuntz, M. L. Connolly, Real-time color graphics in studies of molecular interactions, Science 211 (4483) (1981)
305
661–666.
[3] Electron Microscopy Solutions, 2017 nobel prize in chemistry (2017). URL https://www.fei.com/cryo-em/
[4] Y. Cheng, Single-particle cryo-EM-How did it get here and where will it go., Science 361 (6405) (2018) 876–880.
310
[5] J. S. Richardson, beta-Sheet topology and the relatedness of proteins., Na-ture 268 (5620) (1977) 495–500.
[6] M. L. Connolly, Analytical molecular surface calculation, Journal of Ap-plied Crystallography 16 (5) (1983) 548–558.
[7] W. Humphrey, A. Dalke, K. Schulten, VMD: visual molecular dynamics,
315
Journal of Molecular Graphics 14 (1) (1996) 33–38.
7 8 9 10 11 12 13 14 15 16 17 18 19 20 21 22 23 24 25 26 27 28 29 30 31 32 33 34 35 36 37 38 39 40 41 42 43 44 45 46 47 48 49 50 51 52 53 54
[8] M. Tarini, P. Cignoni, C. Montani, Ambient occlusion and edge cueing to enhance real time molecular visualization., Visualization and Computer Graphics, IEEE Transactions on 12 (5) (2006) 1237–1244.
[9] G. Cipriano, M. Gleicher, Molecular surface abstraction, Visualization and
320
Computer Graphics, IEEE Transactions on 13 (6) (2007) 1608–1615. [10] M. Van Der Zwan, W. Lueks, H. Bekker, T. Isenberg, Illustrative molecular
visualization with continuous abstraction, in: Computer Graphics Forum, Vol. 30, Wiley Online Library, 2011, pp. 683–690.
[11] M. Chavent, B. L´evy, B. Maigret, MetaMol: High quality visualization
325
of Molecular Skin Surface, Journal of Molecular Graphics and Modelling 27 (2) (2008) 209–216.
[12] T. Klein, L. Autin, B. Kozlikova, D. S. Goodsell, A. Olson, M. E. Groller, I. Viola, Instant Construction and Visualization of Crowded Biological En-vironments., IEEE Trans Vis Comput Graph 24 (1) (2018) 862–872.
330
[13] J. S. Richardson, D. C. Richardson, Doing molecular biophysics: Finding, naming, and picturing signal within complexity, Annual Review of Bio-physics 42 (1) (2013) 1–28.
[14] M. L. CONNOLLY, Solvent-Accessible Surfaces of Proteins and Nucleic-Acids, Science 221 (4612) (1983) 709–713.
335
[15] T. D. Goddard, T. E. Ferrin, Visualization software for molecular assem-blies, Current opinion in structural biology 17 (5) (2007) 587–595. [16] S. I. O’Donoghue, D. S. Goodsell, A. S. Frangakis, F. Jossinet, R. A.
Laskowski, M. Nilges, H. R. Saibil, A. Scha↵erhans, R. C. Wade, E. West-hof, et al., Visualization of macromolecular structures, Nature methods 7
340
(2010) S42–S55.
[17] G. T. Johnson, S. Hertig, A guide to the visual analysis and communica-tion of biomolecular structural data, Nature reviews. Molecular cell biology 15 (10) (2014) 690–698. 7 8 9 10 11 12 13 14 15 16 17 18 19 20 21 22 23 24 25 26 27 28 29 30 31 32 33 34 35 36 37 38 39 40 41 42 43 44 45 46 47 48 49 50 51 52 53 54
[18] W. Im, J. Liang, A. Olson, H.-X. Zhou, S. Vajda, I. A. Vakser, Challenges
345
in structural approaches to cell modeling., Journal of molecular biology 428 (15) (2016) 2943–2964.
[19] M. Chavent, B. L´evy, M. Krone, K. Bidmon, J.-P. Nomin´e, T. Ertl, M. Baaden, Gpu-powered tools boost molecular visualization, Briefings in Bioinformatics (2011) bbq089.
350
[20] J. D. Hirst, D. R. Glowacki, M. Baaden, Molecular simulations and visual-ization: introduction and overview, Faraday discussions 169 (2014) 9–22. [21] B. Kozl´ıkov´a, M. Krone, M. Falk, N. Lindow, M. baaden, D. Baum, I. Viola,
J. Parulek, H. C. Hege, Visualization of Biomolecular Structures: State of the Art Revisited, Computer Graphics Forum 36 (8) (2017) 178–204.
355
[22] M. Krone, B. Kozl´ıkov´a, N. Lindow, M. Baaden, D. Baum, J. Parulek, H.-C. Hege, I. Viola, Visual analysis of biomolecular cavities: State of the art, Computer Graphics Forum 35 (3) (2016) 527–551. doi:10.1111/cgf. 12928.
[23] T. Sim˜oes, D. Lopes, S. Dias, F. Fernandes, J. Pereira, J. Jorge, C. Bajaj,
360
A. Gomes, Geometric detection algorithms for cavities on protein surfaces in molecular graphics: A survey, Computer Graphics Forum 36 (8) (2017) 643–683. doi:10.1111/cgf.13158.
[24] M. Krone, J. E. Stone, T. Ertl, K. Schulten, Fast visualization of gaussian density surfaces for molecular dynamics and particle system trajectories,
365
EuroVis-Short Papers (2012) 67–71.
[25] J. E. Stone, M. Sener, K. L. Vandivort, A. Barragan, A. Singharoy, I. Teo, J. V. Ribeiro, B. Isralewitz, B. Liu, B. C. Goh, J. C. Phillips, C. MacGregor-Chatwin, M. P. Johnson, L. F. Kourkoutis, C. N. Hunter, K. Schulten, Atomic detail visualization of photosynthetic membranes with
370
GPU-accelerated ray tracing, Parallel Computing 55 (2016) 17–27.
7 8 9 10 11 12 13 14 15 16 17 18 19 20 21 22 23 24 25 26 27 28 29 30 31 32 33 34 35 36 37 38 39 40 41 42 43 44 45 46 47 48 49 50 51 52 53 54
[26] T. D. Goddard, C. C. Huang, E. C. Meng, E. F. Pettersen, G. S. Couch, J. H. Morris, T. E. Ferrin, UCSF ChimeraX: Meeting modern challenges in visualization and analysis, Protein science : a publication of the Protein Society 27 (1) (2018) 14–25.
375
[27] B. T. Phong, Illumination for computer generated pictures, Communica-tions of the ACM 18 (6) (1975) 311–317.
[28] J. F. Blinn, Models of light reflection for computer synthesized pictures, SIGGRAPH Comput. Graph. 11 (2) (1977) 192–198. doi:10.1145/ 965141.563893.
380
[29] M. Krone, G. Reina, S. Zahn, T. Tremel, C. Bahnm¨uller, T. Ertl, Implicit sphere shadow maps, in: Pacific Visualization Symposium, IEEE, 2017, pp. 275–279.
[30] I. Yu, A. Cox, M. H. Kim, T. Ritschel, T. Grosch, C. Dachsbacher, J. Kautz, Perceptual influence of approximate visibility in indirect illumination, ACM
385
Transactions on Applied Perception (TAP) 6 (4) (2009) 24.
[31] D. A. Szafir, A. Sarikaya, M. Gleicher, Lightness constancy in surface visu-alization, IEEE transactions on visualization and computer graphics 22 (9) (2016) 2107–2121.
[32] J. E. Stone, K. L. Vandivort, K. Schulten, Gpu-accelerated molecular
visu-390
alization on petascale supercomputing platforms, in: Proceedings of the 8th International Workshop on Ultrascale Visualization, UltraVis ’13, ACM, New York, NY, USA, 2013, pp. 6:1–6:8. doi:10.1145/2535571.2535595. URL http://doi.acm.org/10.1145/2535571.2535595
[33] S. Grottel, M. Krone, K. Scharnowski, T. Ertl, Object-Space Ambient
Oc-395
clusion for Molecular Dynamics, in: IEEE Pacific Visualization Sympo-sium, 2012, pp. 209–216. doi:10.1109/PacificVis.2012.6183593. 7 8 9 10 11 12 13 14 15 16 17 18 19 20 21 22 23 24 25 26 27 28 29 30 31 32 33 34 35 36 37 38 39 40 41 42 43 44 45 46 47 48 49 50 51 52 53 54
[34] G. Johnson, L. Autin, D. Goodsell, M. Sanner, A. Olson, ePMV embeds molecular modeling into professional animation software environments, Structure 19 (2011) 293–303.
400
[35] R. M. Andrei, M. Callieri, M. F. Zini, T. Loni, G. Maraziti, M. C. Pan, M. Zopp`e, Bioblender: A software for intuitive representation of surface properties of biomolecules, CoRR.
[36] F. M. Richards, Areas, Volumes, Packing, and Protein Structure, Annu. Rev. Biophys. Bioeng. 6 (1977) 151–176. doi:10.1146/annurev.bb.06.
405
060177.001055.
[37] M. Krone, K. Bidmon, T. Ertl, Interactive visualization of molecular surface dynamics., IEEE Trans Vis Comput Graph 15 (6) (2009) 1391–1398. [38] N. Lindow, D. Baum, S. Prohaska, H.-C. Hege, Accelerated visualization
of dynamic molecular surfaces, Computer Graphics Forum 29 (3) (2010)
410
943–952.
[39] M. Krone, M. Falk, S. Rehm, J. Pleiss, T. Ertl, Interactive exploration of protein cavities, Computer Graphics Forum 30 (3) (2011) 673–682. [40] A. Jurcik, J. Parulek, J. Sochor, B. Kozlikova, Accelerated Visualization of
Transparent Molecular Surfaces in Molecular Dynamics, in: IEEE Pacific
415
Visualization Symposium, 2016, pp. 112–119. doi:10.1109/PACIFICVIS. 2016.7465258.
[41] P. Hermosilla, M. Krone, V. Guallar, P.-P. V´azquez, `A. Vinacua, T. Ropin-ski, Interactive GPU-based generation of solvent-excluded surfaces, The Visual Computer 33 (6-8) (2017) 869–881.
420
[42] N. Lindow, D. Baum, H.-C. Hege, Ligand Excluded Surface: A New Type of Molecular Surface, IEEE Transactions on Visualization and Computer Graphics 20 (12) (2014) 2486–2495. doi:10.1109/TVCG.2014.2346404. 7 8 9 10 11 12 13 14 15 16 17 18 19 20 21 22 23 24 25 26 27 28 29 30 31 32 33 34 35 36 37 38 39 40 41 42 43 44 45 46 47 48 49 50 51 52 53 54
[43] H. Edelsbrunner, Deformable Smooth Surface Design, Discrete & Compu-tational Geometry 21 (1) (1999) 87–115. doi:10.1007/PL00009412.
425
[44] M. Hadwiger, P. Ljung, C. R. Salama, T. Ropinski, Advanced Illumina-tion Techniques for GPU Volume Raycasting, in: ACM SIGGRAPH Asia Courses, 2008, p. 166. doi:10.1145/1508044.1508045.
[45] A. Knoll, I. Wald, P. Navratil, A. Bowen, K. Reda, M. E. Papka, K. Gaither, Rbf volume ray casting on multicore and manycore cpus, in: Computer
430
Graphics Forum, Vol. 33, Wiley Online Library, 2014, pp. 71–80.
[46] L. E. Kay, New views of functionally dynamic proteins by solution nmr spectroscopy, Journal of molecular biology 428 (2) (2016) 323–331. [47] S. Bottaro, K. Lindor↵-Larsen, Biophysical experiments and biomolecular
simulations: A perfect match?, Science 361 (6400) (2018) 355–360.
435
[48] P. Rheingans, S. Joshi, Visualization of molecules with positional uncer-tainty, in: Data Visualization ’99, 1999, pp. 299–306.
[49] J. Schmidt-Ehrenberg, D. Baum, H.-C. Hege, Visualizing dynamic molec-ular conformations, in: IEEE Visualization, 2002, pp. 235–242.
[50] R. Koradi, M. Billeter, K. W¨uthrich, MOLMOL: A program for display
440
and analysis of macromolecular structures, J. Mol. Graph. 14 (1) (1996) 51–55. doi:http://dx.doi.org/10.1016/0263-7855(96)00009-4. [51] W. Rieping, M. Habeck, M. Nilges, Inferential Structure Determination,
Science 309 (5732) (2005) 303–306.
[52] C. H. Lee, A. Varshney, Representing thermal vibrations and uncertainty in
445
molecular surfaces, in: SPIE Conference on Visualization and Data Anal-ysis, 2002, pp. 80–90.
[53] J. Cortes, S. Barbe, M. Erard, T. Simeon, Encoding molecular motions in voxel maps, IEEE/ACM Trans. Comput. Biol. Bioinform. 8 (2) (2011) 557–563. 450 7 8 9 10 11 12 13 14 15 16 17 18 19 20 21 22 23 24 25 26 27 28 29 30 31 32 33 34 35 36 37 38 39 40 41 42 43 44 45 46 47 48 49 50 51 52 53 54
[54] C. Schulz, K. Schatz, M. Krone, M. Braun, T. Ertl, D. Weiskopf, Uncer-tainty visualization for secondary structures of proteins, in: IEEE Pacific Visualization Symposium (PacificVis), 2018. doi:10.1109/PacificVis. 2018.00020.
[55] A. Bryden, G. Phillips, M. Gleicher, Automated illustration of molecular
455
flexibility, IEEE Trans. Vis. Comput. Graphics 18 (1) (2012) 132–145. doi: 10.1109/TVCG.2010.250.
[56] M. Fioravante, A. Shook, I. Thorpe, P. Rheingans, Visualizing Motional Correlations in Molecular Dynamics using Geometric Deformations, Com-put. Graph. Forum 32 (3pt3) (2013) 311–320. doi:10.1111/cgf.12118.
460
[57] S. M. Dabdoub, R. W. Rumpf, A. D. Shindhelm, W. C. Ray, Moflow: visualizing conformational changes in molecules as molecular flow improves understanding, BMC Proceedings 9 (6) (2015) 1–12.
[58] A. Sali, H. M. Berman, T. Schwede, J. Trewhella, G. Kleywegt, S. K. Bur-ley, J. MarkBur-ley, H. Nakamura, P. Adams, A. M. J. J. Bonvin, W. Chiu,
465
M. D. Peraro, F. Di Maio, T. E. Ferrin, K. Gr¨unewald, A. Gutmanas, R. Henderson, G. Hummer, K. Iwasaki, G. Johnson, C. L. Lawson, J. Meiler, M. A. Marti-Renom, G. T. Montelione, M. Nilges, R. Nussi-nov, A. Patwardhan, J. Rappsilber, R. J. Read, H. Saibil, G. F. Schr¨oder, C. D. Schwieters, C. A. M. Seidel, D. Svergun, M. Topf, E. L. Ulrich, S.
Ve-470
lankar, J. D. Westbrook, Outcome of the First wwPDB Hybrid/Integrative Methods Task Force Workshop, Structure (London, England : 1993) 23 (7) (2015) 1156–1167.
[59] D. S. Goodsell, M. A. Franzen, T. Herman, From Atoms to Cells: Using Mesoscale Landscapes to Construct Visual Narratives, Journal of molecular
475
biology 430 (21) (2018) 3954–3968.
[60] G. T. Johnson, L. Autin, M. Al-Alusi, D. S. Goodsell, M. F. Sanner, A. J. Olson, cellPACK: a virtual mesoscope to model and visualize structural systems biology, Nature Methods 12 (1) (2015) 85–91.
7 8 9 10 11 12 13 14 15 16 17 18 19 20 21 22 23 24 25 26 27 28 29 30 31 32 33 34 35 36 37 38 39 40 41 42 43 44 45 46 47 48 49 50 51 52 53 54
[61] J. H. Iwasa, Bringing macromolecular machinery to life using 3D animation,
480
Current opinion in structural biology 31 (2015) 84–88.
[62] J. H. Iwasa, Animating the model figure, Cell 20 (12) (2008) 699–704. [63] H. Miao, T. Klein, D. Kouˇril, P. Mindek, K. Schatz, M. E. Groller, B.
Ko-zlikova, T. Isenberg, I. Viola, Multiscale Molecular Visualization., Journal of molecular biology 431 (6) (2019) 1049–1070.
485
[64] J. Parulek, D. J¨onsson, T. Ropinski, S. Bruckner, A. Ynnerman, I. Viola, Continuous levels-of-detail and visual abstraction for seamless molecular visualization, in: Computer Graphics Forum, Vol. 33, Wiley Online Library, 2014, pp. 276–287.
[65] H. Miao, E. De Llano, T. Isenberg, M. E. Grller, I. Barii, I.
Vi-490
ola, Dimsum: Dimension and scale unifying map for visual abstrac-tion of dna origami structures, Computer Graphics Forum 37 (3) (2018) 403–413. arXiv:https://onlinelibrary.wiley.com/doi/pdf/10.1111/ cgf.13429, doi:10.1111/cgf.13429.
URL https://onlinelibrary.wiley.com/doi/abs/10.1111/cgf.13429
495
[66] P. Mindek, D. Kouˇril, J. Sorger, D. Toloudis, B. Lyons, G. Johnson, M. E. Groller, I. Viola, Visualization Multi-Pipeline for Communicating Biology., IEEE Trans Vis Comput Graph 24 (1) (2018) 883–892.
[67] J. Singla, K. M. McClary, K. L. White, F. Alber, A. Sali, R. C. Stevens, Op-portunities and Challenges in Building a Spatiotemporal Multi-scale Model
500
of the Human Pancreatic Cell, Cell 173 (1) (2018) 11–19.
[68] Z. Lv, A. Tek, F. Da Silva, C. Empereur-Mot, M. Chavent, M. Baaden, Game on, science-how video game technology may help biologists tackle visualization challenges, PloS one 8 (3) (2013) e57990.
[69] F. Mwalongo, M. Krone, G. Reina, T. Ertl, State-of-the-art report in
web-505
based visualization, Computer Graphics Forum 35 (3) (2016) 553–575. doi: 10.1111/cgf.12929. 7 8 9 10 11 12 13 14 15 16 17 18 19 20 21 22 23 24 25 26 27 28 29 30 31 32 33 34 35 36 37 38 39 40 41 42 43 44 45 46 47 48 49 50 51 52 53 54
[70] S. Yuan, H. S. Chan, Z. Hu, Implementing webgl and html5 in macro-molecular visualization and modern computer-aided drug design, Trends in biotechnology 35 (6) (2017) 559–571.
510
[71] L. A. Abriata, Web Apps Come of Age for Molecular Sciences, Informatics 4 (3) (2017) 28.
[72] A. S. Rose, P. W. Hildebrand, NGL Viewer: a web application for molec-ular visualization, Nucleic Acids Research 43 (W1) (2015) W576, http: //proteinformatics.charite.de/ngl (last accessed: 14.02.17). doi:
515
10.1093/nar/gkv402.
[73] D. Sehnal, M. Deshpande, R. S. Vaˇrekov´a, S. Mir, K. Berka, A. Midlik, L. Pravda, S. Velankar, J. Koˇca, LiteMol suite: interactive web-based vi-sualization of large-scale macromolecular structure data, Nature Methods 14 (12) (2017) 1121–1122. doi:10.1038/nmeth.4499.
520
[74] Jolecule - the protein viewer in the cloud, http://jolecule.appspot.com/ (last accessed: 31.01.17).
[75] F. Mwalongo, M. Krone, M. Becher, G. Reina, T. Ertl, GPU-based remote visualization of dynamic molecular data on the web, Graphical Models 88 (2016) 57–65. doi:10.1016/j.gmod.2016.05.001.
525
[76] H. Berman, K. Henrick, H. Nakamura, Announcing the worldwide Protein Data Bank, Nature Structural & Molecular Biology 10 (12) (2003) 980–980. doi:10.1038/nsb1203-980.
URL http://www.nature.com/articles/nsb1203-980
[77] T. Schwede, J. Kopp, N. Guex, M. C. Peitsch, Swiss-model: an automated
530
protein homology-modeling server, Nucleic acids research 31 (13) (2003) 3381–3385.
[78] S. I. O’donoghue, K. S. Sabir, M. Kalemanov, C. Stolte, B. Wellmann, V. Ho, M. Roos, N. Perdigao, F. A. Buske, J. Heinrich, et al., Aquaria:
7 8 9 10 11 12 13 14 15 16 17 18 19 20 21 22 23 24 25 26 27 28 29 30 31 32 33 34 35 36 37 38 39 40 41 42 43 44 45 46 47 48 49 50 51 52 53 54
simplifying discovery and insight from protein structures, Nature methods
535
12 (2) (2015) 98.
[79] M. Norrby, C. Grebner, J. Eriksson, J. Bostrm, Molecular rift: Virtual reality for drug designers, Journal of Chemical Information and Model-ing 55 (11) (2015) 2475–2484, pMID: 26558887. doi:10.1021/acs.jcim. 5b00544.
540
[80] A. Maes, X. Martinez, K. Druart, B. Laurent, S. Gu´egan, C. H. Marc-hand, S. D. Lemaire, M. Baaden, MinOmics, an Integrative and Immersive Tool for Multi-Omics Analysis, Journal of Integrative Bioinformatics 15 (2) 967294.
[81] R. M. Andrei, M. Callieri, M. F. Zini, T. Loni, G. Maraziti, M. C. Pan,
545
M. Zopp`e, Intuitive representation of surface properties of biomolecules using bioblender, BMC Bioinformatics 13 (4) (2012) S16. doi:10.1186/ 1471-2105-13-S4-S16.
[82] N. Rajendiran, J. D. Durrant, Pyrite: A blender plugin for visualizing molecular dynamics simulations using industry-standard rendering
tech-550
niques, Journal of Computational Chemistry 39 (12) (2017) 748–755. doi:10.1002/jcc.25155.
[83] Molecular Maya - a plugin for Autodesk Maya, https://clarafi.com/ tools/mmaya/(last accessed: 31.01.17).
[84] VIZBI - Visualizing Biological Data, https://vizbi.org (last accessed:
555
31.01.17).
[85] BioVis, http://biovis.net (last accessed: 31.01.17).
[86] MolVA - Molecular Graphics and Visual Analysis of Molecular Data, http: //decibel.fi.muni.cz/~xbyska/molva/ (last accessed: 31.01.17).
7 8 9 10 11 12 13 14 15 16 17 18 19 20 21 22 23 24 25 26 27 28 29 30 31 32 33 34 35 36 37 38 39 40 41 42 43 44 45 46 47 48 49 50 51 52 53 54
Figure 1: List of surveys presented in this article indicating their time span, number of cited references per year, total number of references, and the ratio of papers coming from the structural biology and computer graphics and visualization fields, respectively. If an article refers to both types of references for the same year, the cell is divided in two rows of di↵erent color. Blue color refers to articles oriented towards a more general (structural biology) audience while red color depicts more technical articles generally published in journals and conferences from the computer graphics community. Figures around the diagram present milestones for molecular visualizations: from hand drawings of myoglobin by Martin Geis (Illustration, Irving Geis. Used with permission from the Howard Hughes Medical Institute (www.hhmi.org). All rights reserved) and the ribbons diagram designed by Jane Richardson [5] to more sophisticated representations like molecular surfaces. This surface was first processed as a static image [6]. During the early 90s to 2000s, with the advent of molecular viewers such as VMD, PyMOL or UCSF Chimera, it was possible to display all these representations interactively (here, a scene rendered with VMD [7]). From mid-2000s, technical developments performed in computer graphics labs are changing the way of visualizing molecular structures by better rendering molecular shapes using lighting e↵ects such as Ambient Occlusion [8], developing new ways of rendering molecular structures [9, 10] or efficiently harnessing Graphics Processing Units (GPU) capabilities [11]. Now, it is possible to interactively construct and visualize very crowded and large systems opening the way for mesoscale models (spanning thousands of Angstroms and containing millions of molecules) with a nearly atomic resolution [12]. Unfortunately, these methods are not yet fully available to the end users such as structural biologists.
7 8 9 10 11 12 13 14 15 16 17 18 19 20 21 22 23 24 25 26 27 28 29 30 31 32 33 34 35 36 37 38 39 40 41 42 43 44 45 46 47 48 49 50 51 52 53 54
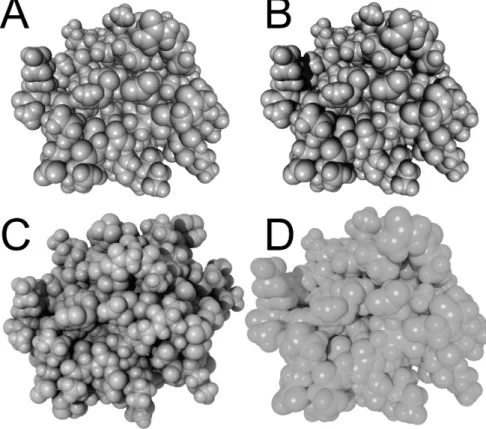
Figure 2: A- Basic Blinn-Phong (BP) rendering. B- Addition of shadows to BP rendering. C-Ambient occlusion lighting added to BP and shadows. D- Photorealistic rendering. While the three first renderings can be performed interactively, the latter still requires costly computation which currently only allows rendering static images.
7 8 9 10 11 12 13 14 15 16 17 18 19 20 21 22 23 24 25 26 27 28 29 30 31 32 33 34 35 36 37 38 39 40 41 42 43 44 45 46 47 48 49 50 51 52 53 54
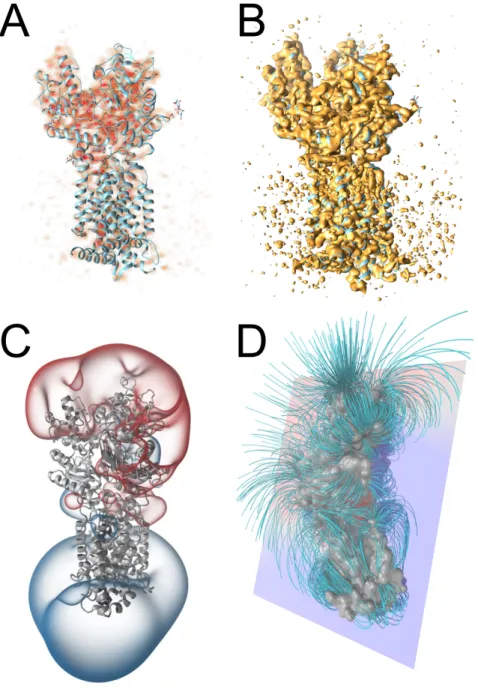
Figure 3: Examples of volume rendering for molecular data. Visualization of the cryo-EM map of a protein (PDB ID: 6D4J; EMDB ID: EMD-7796) rendered using direct volume rendering (A) and isosurface (B). Electrostatic field represented as isosurface (C) and as field lines (D).
7 8 9 10 11 12 13 14 15 16 17 18 19 20 21 22 23 24 25 26 27 28 29 30 31 32 33 34 35 36 37 38 39 40 41 42 43 44 45 46 47 48 49 50 51 52 53 54
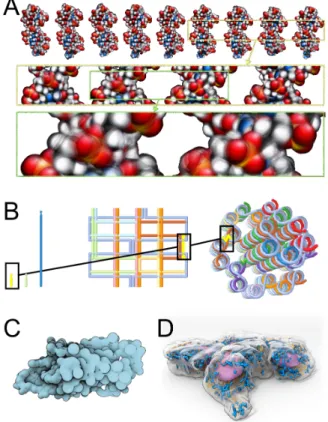
Figure 4: A- DNA dynamics depicted as time lapse-motion blurred rendering of an MD trajectory. Three levels of magnification are provided to depict dynamics at di↵erent time-and lengthscales: on the top row overall double helix motion is visible with DNA groove deformations up to the tens of Angstroms scale, in the middle row the local groove dynamics is highlighted leading to Angstrom-scale shape changes and the bottom row depicts very short timescale sub-Angstrom phosphodiester backbone vibrations. Figure generated using UnityMol [68]. B- Abstractions of DNA origami [65]. C- continuous transformation to pass from a very precise molecular surface (on the left side of the molecule) to a simplified surface representation (center), then to a VdW representation, as a function of the user’s point of view [64]. D- illustrative representation of cell models [66]. Purple: nuclear surface, blue: mitochondria, yellow: microtubules. The cell surface is outlined and semi-transparent. Image from the Allen Cell Explorer: https://www.allencell.org
7 8 9 10 11 12 13 14 15 16 17 18 19 20 21 22 23 24 25 26 27 28 29 30 31 32 33 34 35 36 37 38 39 40 41 42 43 44 45 46 47 48 49 50 51 52 53 54