Continuum Modeling of Reactive Colloids:
Transformation of Cement Paste from Sol to Cohesive Gel
by
Thomas Petersen
Submitted to the Department of Civil and Environmental Engineering
in partial fulfillment of the requirements for the degree of
Doctor of Philosophy in Mechanics of Materials
at the
MASSACHUSETTS INSTITUTE OF TECHNOLOGY
June 2019
@
Massachusetts Institute of Technology 2019. All rights reserved.
Signature redacted
Author ...
Department of Civil and Environmental Engineering
January 28, 2019
Signature redacted
C ertified by ...
...
F/anz-Josef Ulm
Professor of Civil and Environmental Engineering
Thesis Supervisor
Signature redacted
A ccepted by ...
...
Heidi Nepf
Donald and Martha Harleman Professor of Civil and Environmental
MASSACHUSETTS INSTITUTE Engineering
OFCTECHNOLOGYam
Engiee
F
I
Chair, Graduate Program Committee
JUL 10 2019
Continuum Modeling of Reactive Colloids: Transformation of
Cement Paste from Sol to Cohesive Gel
by
Thomas Petersen
Submitted to the Department of Civil and Environmental Engineering on January 28, 2019, in partial fulfillment of the
requirements for the degree of
Doctor of Philosophy in Mechanics of Materials
Abstract
A colloid is a collection of nanometer- to micron-sized particles interacting in a fluid or solution. And though colloids have traditionally been defined as fluid-like dispersions that remain suspended on account of the system's thermal fluctuations, the term has become more all-encompassing, referring to the collective behavior of particles that attract or repulse and interact at varying relative length and time scales. Cement paste, the binding agent in modern concrete, is classified as a colloid. Nearly in-stantaneously after mixing water with polydisperse cement powder, nanometer-sized grains of calcium-silicate-hydrates (C-S-H) precipitate out of solution and sponta-neously gel. It is at this length scale that many of the physicochemical characteristics that lend the paste its mechanical durability are thought to derive. Yet few modeling approaches have been implemented to investigate how the density patterns in such reactive materials evolve and control mechanical behavior.
Thus, the first part of this thesis presents a nonequilibrium thermodynamic theory for the mean-field precipitation, aggregation and pattern formation of colloids. A variable gradient energy coefficient and the arrest of particle diffusion upon "jamming" of clusters in the spinodal region predicts observable gel patterns that, at high inter-particle attraction, form system-spanning, out-of-equilibrium networks with glass-like, quasi-static structural relaxation. For reactive systems, we incorporate the free energy landscape of stable primary particles into the Allen-Cahn reaction equation. We show that pattern formation is dominantly controlled by the Damk6hler number
- the ratio of the reaction rate to the diffusion rate - and the stability of the primary particles, which modifies the auto-catalytic rate of precipitation. As primary particles individually become more stable, bulk phase separation is suppressed.
Next, diffusive motion is replaced by hydrodynamic flow. By incorporating the thermodynamic stress into a Navier-Stokes equation that measures changes in parti-cle momentum, we enable continuum modeling of two-scale partiparti-cle aggregation: i) particles phase separate into out-of-equilibrium clusters, which ii) further associate as rigidly moving bodies to form cluster aggregates. It is shown that the coarsening dynamics deviate from the universal scaling relation that is expected for equilibrium
phases. Concomitant to local arrest and formation of a gel, mechanical strain energy is stored in the solid-like gel network. Changes in the stress state are track using an incremental mechanics formulation for densifying reactive materials.
Throughout our modeling efforts, we relate several results to experimental ob-servations of hydrating cement paste. Firstly, it is hypothesized that curing tem-perature modifies the thermodynamic landscape of the C-S-H grains, which in turn influences the paste's pore-size distribution: Cements hydrating at higher tempera-tures produce more capillary porosity and less gel porosity, which adversely affects the materials durability. Secondly, the thermodynamic stress, which derives from the surface interactions of colloidal particles, is proposed as the driving force for cement shrinkage, which was experimentally observed in course of hydration under constant temperature and pressure conditions.
Thesis Supervisor: Franz-Josef Ulm
Title: Professor of Civil and Environmental Engineering
Acknowledgments
MIT and Boston and its surroundings will remain fond in my memory. During my graduate studies I fostered relationships with some of the most intelligent, inspired, and motivated persons I know, and made friends whose support, humor, and spon-taneity provided a constant influx of unforgettable experiences. There are too many persons I am indebted to and deserved mention in these acknowledgments, and I will thus make no attempt to list them all. I nonetheless feel obligated to point out several individuals and the roles they played in enabling this dissertation.
I would like to thank Amir Pahlavan for his objectivity, unadulterated love and passion for science, and patience in guiding and inspiring my work. In many ways, I find Amir to exemplify the most important qualities and characteristics a researcher and, more importantly, a mentor should possess. To Hadrien Laubie I express my sincerest gratitude for his friendship and kinship as a fellow member of the research group; he too dedicated much patience and selflessness in assisting my understanding of mechanics and made my time in the civil engineering department all the more enjoyable. I am incredibly delighted to see him follow his dream of becoming a pilot and hope to meet him again often as he travels the world. Toby Mansuripur played a pivotal role in guiding my research approach and simultaneously taught me to prioritizing my personal time. I lived with Toby for over three years while in Cambridge, and can confidently state that he is one of the most intelligent, and genuine persons I have encountered; he is a model for the attitudes I aim to adopt in my career and how I treat the people around me. Lastly and most significantly, my family and Frances, my girlfriend, kept my spirits high when nothing else would. They were a constant source of reassurance, repeatedly listened to my concerns without growing tired, and reminded me of my privilege and fortune. They placed my Ph.D. into perspective as a momentary dedication and indulgence in learning, incomparable in importance to the relationships and experiences I created and maintained the last
six and a half years.
mentorship I received from the many administrators, researchers, and professors I encountered while at MIT. In particular, I thank Martin Bazant and Thibaut Divoux for taking an interest in my work, contributing their unparalleled knowledge of col-loidal physics and non-equilibrium thermodynamics, and taking the time to meet and discuss my research when I encountered a hurdle. Finally, I wish to thank Donna, Roland, and Franz for maintaining an environment that provided me the freedom and resources to pursue my ideas, several of which fell outside of the orthodoxy of the civil engineering curriculum. I am particularly indebted to Franz, who provided
an open door to discuss research and personal concerns, lead me toward identifying relevant, novel scientific questions, and ingrained in me an ability to work toward rigorous solutions.
Bildung ist das, was iibrig bleibt, wenn man alles vergessen hat, was man gelernt hat. -Werner Heisenberg
Contents
1 Introduction 21
1.1 General context and research approach . . . . 21
1.2 W hat is a colloid? . . . . 22
1.3 Cement paste as a colloid . . . . 23
1.3.1 Volume changes of cement paste during hydration . . . . 27
1.4 The difference between colloids with repulsive and attractive inter-particle potentials . . . . 31
1.4.1 G lasses . . . . 32
1.4.2 G els . . . . 32
1.5 How do stable primary particles of characteristic size form in reactive colloidal system s? . . . . 33
1.6 Thesis O utline . . . . 37
2 Colloids as reactive-diffusive systems 39 2.1 The Allen-Cahn reaction equation for reactive-diffusive phase separation 40 2.2 Precipitation of stable primary particles . . . . 46
2.3 Glass-like arrest of particle motion . . . . 52
2.3.1 Rapid decrease in particle diffusivity . . . . 54
2.4 Stability analysis of the Allen-Cahn reaction equation . . . . 55
2.5 Results and discussion of simulations of reactive-diffusive systems . . 59
2.5.1 Simulations of conserved phase separation by rapid quenching 60 2.5.2 Simulations of phase separation due to reactive insertion and diffusion of primary particles . . . . 65
2.6 Possible explanation for increased capillary porosity in cement pastes hydrating at increased temperatures. . . . . 70 2.7 Chapter summary . . . . 73
3 Colloids with hydrodynamic flow 75
3.1 Reactive-advective model for phase separation in attractive colloids . 75 3.2 Mechanics of colloids during phase separation . . . . 78 3.2.1 A Ginzburg-Landau functional that incorporates strain energy 79 3.2.2 Incremental stresses generating in colloidal gels . . . . 81 3.3 Viscosity and elasticity of colloidal gels . . . . 89 3.4 Numerical procedure to calculate build-up of residual stresses during
phase separation . . . . ... . . . . 91 3.5 Simulations of reactive systems with hydrodynamic flow of particle
clusters. . . .. . . . .. ... ... .. ... .... . .. . .. . . .. 95
3.5.1 Simulation results of conserved systems under hydrodynamic flow 96 3.5.2 Simulation results for open systems: Coupling reactive insertion
with hydrodynamic flow . . . . 98 3.6 Chapter summary . . . . 106
4 Mechanics of colloids in reactive-diffusive systems 109
4.1 Stress transmission in inhomogeneous gels . . . . 110 4.2 Volume changes due to internal stresses in colloids . . . . 116 4.3 Back-calculated volume strain in curing cement paste . . . . 119
5 Conclusions 123
5.1 Summary and main findings . . . . 123 5.2 Research outlook . . . . 125
A Gradient energy coefficient derived from density fluctuations 127
B A theoretical estimate for the shear and bulk moduli of densely
packed colloids 131
List of Figures
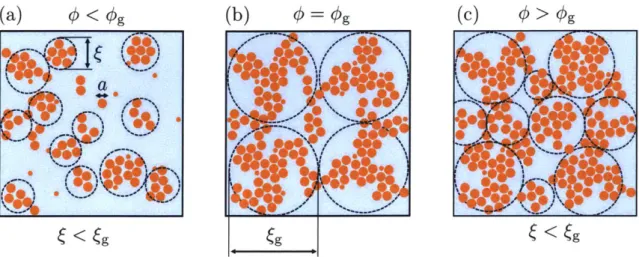
1-1 Examples of colloids: Fog, which consists of minute, mobile water droplets dispersed in air, yoghurt, a yield-stress fluid of jammed ca-sein micelles, and cement paste, an arrested gel of strongly bonded calcium-silica-hydrate nanoparticles. Images sourced online from pex-els.com [1] . . . . 23 1-2 Panel of images demonstrating the colloidal nature of cement paste:
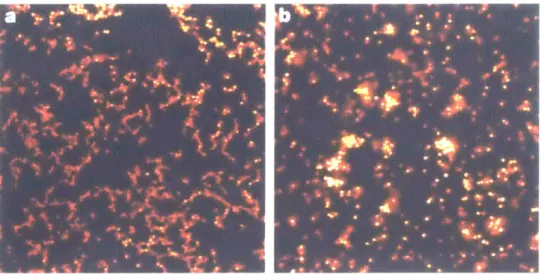
(a) X-ray spectroscopy image of a C3S grain dissolving in dilute
solu-tion [71; solid arrow points toward C-S-H nanoparticles precipitating near, yet detached from, the C3S surface. Transmission electron mi-crograph images of C-S-H (b)(d) inner and (e) outer product from Refs. [112, 113j. (c) Two-dimensional cartoon pore space and amor-phous assembly of C-S-H proposed by T.C.Powers [108]. (f) Computer generated three-dimensional texture of cement paste obtained by com-bining a molecular dynamics simulation of the nanoparticles with a Grand Canonical Monte Carlo insertion scheme [68] . . . . 24 1-3 (a) Interaction force measured between a flat S-H surface, and
C-S-H deposited at the end of an atomic-force-microscope (AFM) tip. The AFM tip was immersed in a solution of increasing calcium hy-droxide concentration to vary the pH and before being lowered onto the stationary surface; the ionic strength was maintained constant by adding a proportional concentration of counterions. (b) Adhesion force in function of increasing lime concentration and pH. . . . . 26
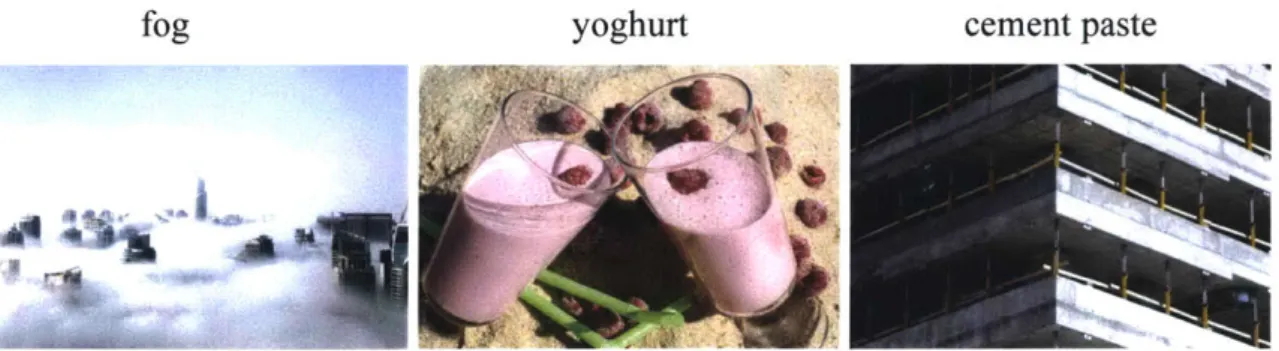
1-4 (a) Schematic of experimental pressure vessel used to measure bulk volume changes of hydrating cement paste under saturated, drained, isobaric, and isothermal conditions; for specifics about the design con-sult Ref. [3, 21. The neon green rubber diaphragm seals the cement sample from the upper compartment and separately allows water ac-cess through top and bottom ports. (b) Volume changes of C3S hy-drating at varying constant temperatures in function of the hydration time. (c) Volume changes of C3S hydrating at varying constant
tem-peratures in function of the extent of the reaction/ hydration degree, which was back calculated from calorimetry measurements. Figures were adapted from Ref. [21 . . . . 28
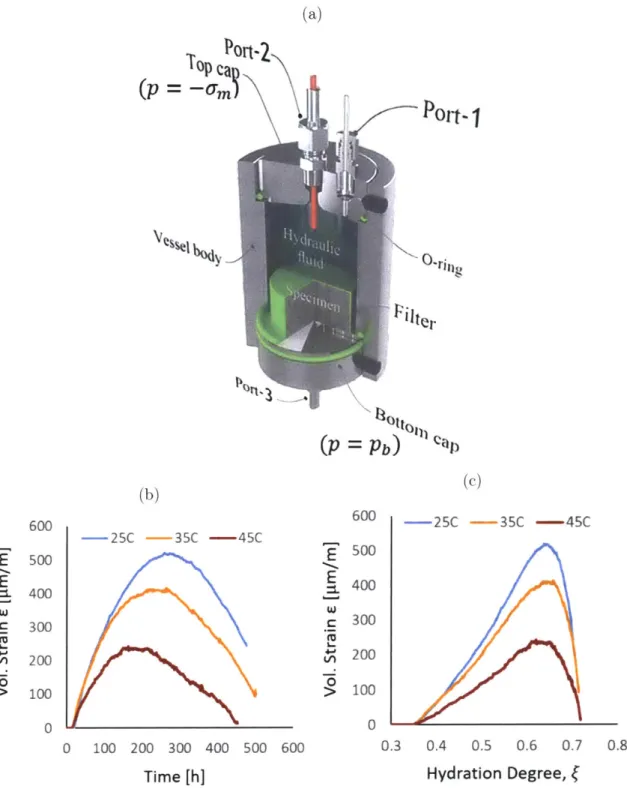
1-5 Confocal microscope images of phase separating colloid-polymer mix-tures, where the left image, (a), shows the fractal morphology of parti-cles assembling under conditions of diffusion-limited aggregation due to a strongly attractive, short-range interaction potential, and the right image, (b), shows the morphology of a nucleation and growth pro-cess brought about by spinodal decomposition [6]. While the former structure is, for all intensive purposes, arrested, the latter continues to coarsen due to thermal fluctuations that are strong enough to cause particle rearrangement. . . . . 31
1-6 Plot shows the development of free calcium ions in a solution at con-stant pH, where the red line indicates the total concentration of free ions added to the solution and the black line indicates the concentra-tion of free ions measured in the soluconcentra-tion. The dashed line indicates saturation of the solution with respect to calcium carbonate. The dip and level off in the measured free ion concentration indicates nucleation of bulk calcium carbonate. The difference in dosed and measured con-centrations prior to nucleation indicate that a fraction of added calcium binds to form stable ion clusters. Figure copied from Ref. [531. . . . . 35
10
1-7 Figure copied from Ref. [31], which experimentally investigated silica formation by slow diffusion of tetraethyl orthosilicate into a lysine solu-tion. The panels demonstrate the different stages in forming bulk silica from stabilized colloidal nanoparticles. Plots of pH monitoring during the reaction of (a) a highly concentrated suspension in which thermo-dynamically metastable primary particles further assembled into bulk clusters, and (b) a dilute suspension in which the stable primary par-ticles formed but did not further aggregate into bulk clusters. (c)-(h) Cryo-TEM images of the suspension demonstating the formation of the primary particles and further assembly into bulk clusters. After asso-ciation to form bulk nuclei, no new assemblies are formed and growth occurs by addition of newly formed primary particles to the existing structure. . . . . 36
2-1 (a) Stability diagram depicting the binodal, spinodal, and gelation lines at varying quench depths; the gelation line corresponds to Eq.(), and the black line indicates ( = 4.0 selected for panel (b) and Fig.2-2, and
the simulation results in this section of the thesis for the nonconserved systems. (b) Homogeneous part of the Gibbs free energy of the mixture of primary particles and vacancies gh, where the linear term (Q - 10) has been added for clarity. The red star indicates the packing fraction
at the sol-gel transition. . . . . 42
2-2 Homogeneous part of the diffusional chemical potential jh, with Ao -n
and reservoir potential fres indicated by dashed, horizontal lines. The
2-3 (a) (top) Diagram depicting the different chemical potentials of a pri-mary particle in its dissolved, nucleated, and deposited states. (bot-tom) Diagram of the two-step and two-scale nucleation process. The grey shaded region, which depicts the excess free energy landscape in the formation of a primary particle, is detailed at higher resolution in panel (b). . . . . 46 2-4 Thermodynamic landscape of the transition state to form stable cluster
precursors for varying bulk energy coefficients, Apm (see Eq. 2.19). The specific values for the coefficients in Eq.( can be found in Tab:2.2. . 49 2-5 (a) Reaction rate (left axis) and auto-catalytic rate (right axis) in
func-tion q. (b) Integrated growth rate of the 4 Fourier mode as calculated from the 12-norm of a perturbation for differing Da. All plots corre-spond to ( = 4.0 and line colors correcorre-spond to trials listed in Table 2.2: blue - T1, orange - T2, green - T3, and red - T4. . . . . 51 2-6 Diagram of colloidal gel networks (a) below, (b) near, and (c) above
the sol-gel transition. Gels with the same packing density and inter-attractive potential can exihibit drastically varying structures and co-operativity lengths, depending on their mechanical histories. . . . . . 52 2-7 Growth rate of Fourier modes of our colloidal density patterns. S
acts to enhance or suppress growth of fluctuations by increasing or decreasing the domain of unstable modes; unstable modes are identified by the intersection where o = 0 and -S = (1 - q2) (Da(<h) + 42))
indicated by thick, colored horizontal lines. For instance, for slow reactions, Da
<
1, and -> > 0 the instability is Cahn-Hilliard like and the blue bands in (b) and (c) displays bands of decreasing width as -5 increases. For Da > 1 the instability transitions toward Allen-Cahn like growth (d) as lower frequency modes are accessed. For reaction dominated systems, decreasing in the autocatalytic rate A (increasing -5) may completely suppress mode growth (e). Figure adapted from R ef.[15]. . . . . 572-8 (a)-(c) Snapshots of
#(x)
for conserved colloidal systems at t= tL2 s/Do= 1.0 for varying quench depths Q; darkness is proportional to q. (d)-(e) Experimental images for (d) the demixing of milk protein [38], (d)-(e) polystyrene-poly(vinyl methyl ether) [46], and (f) polystyrene-diethyl malonate solutions [128]. (g) Time evolution of the characteristic do-main size 1ch, where to denotes the time of maximum interface area.(h) Evolution of the characteristic domain size rescaled to show its stretched exponential behavior; ich corresponds to the domain size at
to, and the insets show 3 ~ Co(Q -
n
0) and ln(r) ~ C1(Q - ( 0)/(C2 + (Q - ( 0)) with fitting constants C. Simulations were run atnumer-ical resolution 512 x 512 and system size Lsys = 1 with parameters r/'lnskBTL'Ys = 0.001, / = 3.0, y = 1.2, v= 0.88, g = 50, and # 0/ = 0.4 . . . . 61 2-9 Snapshots in time of quenched colloidal systems during coarsening.
All systems are quenched from a homogeneous base state with mean packing fraction <D = 1/3 by instantaneously dropping increasing the interaction parameter f. Non-dimensional time is indicated at the top of the figure panel and increases from left to right, while the depth of quench is indicated along the left of the panel and increases from top to bottom . . . . 64 2-10 (a) Structure factor of
#(x)
for various Q at i - to = 1.0 (thick lines)and i - to = 10.0 (thin lines), where to denotes the time at which the interface area is at its maximum; curves are vertically offset for clarity. (b) Time evolution of the peak integrated intensity iq = f Sqd4; the
legend indicating Q also corresponds to the curves in (a). Dissolution and redoposition of small "droplets" onto adjacent larger structures - Ostwald ripening - is marked by step changes in Iq for ( = 2.5
and Q = 3.0. Time and length scales are normalized by the dilute limit self-diffusivity of a cluster Do and the system size Lsys as follows:
2- 11 Snapshots of reactive systems for varying precursor landscapes T1 - T4 and Da at (a) # = 0.4, (b) q = 0.6, and (c) q = 0.8. . . . . 67
2-12 The two-point density correlation functions for Da = 0.1 as measured
by the inverse Fourier transform of Sq for ~ =0.6 and f = 4.0. . .... 68
2-13 Mean pore size i~n- in function of the overall packing fraction. The shaded domain corresponds to the spinodal region, red and blue lines correspond to TI and T4, respectively, and solid, striped, and dot-ted lines correspond to Da = 0.1, 0.4., and 1.0, respectively. The inset
shows the mean packing density of the gel (D9 = (0) vg = fv (Ig#0) dV/ fv IgdV
in function of the overall packing density <D = (#) = (1/V)
fv
q dV. . 712-14 (a) Pore size distribution of hardened C3S paste samples as measured by mercury porosimetry for the macropores, by mercury porosimetry and H20 and N2 adsorption for the mesopores, and inferred by weight loss compared to surface dry samples for the micropores. Pore sizes are classified as follows based on their diameter, d : macropores (d > 30nm), mesopores (< d ; 30nm), and micropores (d < 3nm). (b) Fraction of non-volatile polysilicates found in cement pastes curing at different temperatures (as compared to the total Si02 content in
C-S-H); non-volatile siliates refer to molecular structures composed of more than abour 6 silicate units. Panel (a) was adapted from Ref. [17] and panel (b) was adapted from Ref. [18]. . . . . 72
3-1 Schematic showing the relation between reference and incrementally deformed configurations in a Lagrangian frame of reference . . . . 77
3-2 (a) Left, macroscopic view displays the density field
#(x)
during dy-namic phase separation into gel and sol regions (darkness is propor-tional to#).
Because the clusters continue to advect and rotate through space, the system as a whole is out of mechanical equilibrium. (b) Right, enlarged view of an isolated particle cluster. The interior of the cluster is in mechanical equilibrium, and primarily subjected to the di-lute reference pressure of the sol phase. Nonetheless small imbalances of the traction acting along its boundary may cause it to aggregate with clusters nearby. . . . . 813-3 (a) Plot of mean thermodynamic stress I'm = tr(I)/3 in function of local packing density,
#;
the darkness of the shading in the background of the plot is proportional to the gel's elasticity. (b) Plot of the fluidity,f,
and shear modulus, G, as a function of the local packing density. . 843-4 Schematic portraying the change in microtexture between between time increments and stress state placed into a pseudo-equilibrium. For sim-plicity, the diagrams depict volume changes due to scalar bulk stresses on material elements that are treated as homogeneous. Top panel shows a conserved, non-reactive system transitioning from sol to gel and the bottom panel shows an arrested system under particle inser-tion. The colors of the particles indicate the degree to which they are loaded, where lighter colors indicate lower local stress states, and the
small black springs signify elastic bonds. . . . . 87
3-6 Coarsening dynamics of conserved density fields under hydrodynamic flow: (a) Plot of the characteristic domain size, fch, in function of time,
t, as calculated from the inverse of the first moment of the structure factors for Q = 4.5. Snapshots along the top portion of the figure provide visual reference to the density field; red circles track a least-size perimeter around a group of clusters that are originally disconnected and aggregate to coalesce over time. Botton inset show the evolution of the mean packing density in the gel phase. (b) Evolution of the interface area per reference volume, LP, in function of offset time, t-to, for varying quench depths; to is calculated based on the the time at with
LP
is at a maximum. . . . . 96 3-7 Snapshots of the packing density evolution (top row) and the particleflux (bottom row) as the reaction evolves. . . . . 99 3-8 Snapshots of the packing density evolution in function of the reaction
extent, 4, for more (top row) or less (bottom row) autocatalytic reac-tion rates. . . . . 100 3-9 Snapshots of the mean network stress am = tr(o)/3 in function of
the reaction extent, 4; stress patters correspond to the density fields plotted in Fig 3-8. Because the stress balances inter-attractive par-ticle forces, and an increase in viscosity upon breaching the gelation line arrests the structure before the particles can be placed into their equilibrium positions, the network stress is generally compressive. . . 101 3-10 Snapshots of the mean total stress Em = tr(E)/3 in function of the
re-action extent, D; stress patterns correspond to the density fields plotted in F ig 3-8. . . . . 102 3-11 Probability density functions of stresses in the gel phase in function of
the reaction extent 1, where the left column of panels displays stress distributions for the mean network stress, am, and the right column displays stress distributions for the mean total stress, Em . . . . 103
3-12 (a) Mean particle flux rate, (c) homogenized bulk modulus, (b) mean network stress in the gel phase, and (d) mean total stress plotted against the mean packing density. . . . . 105
4-1 (a) Normalized and homogenized bulk modulus Khom/KO plotted in function of the reaction extent for the 9 samples of the pattern evo-lution shown in Fig. 2-11. (b) Evoevo-lution of the standard deviation of the mean stress distribution in the gel phase for the same samples plotted in function of the reaction extent; snapshots of the mean stress distribution at a frozen reaction extent, ) = 0.80, are displayed in Fig. 4-2(a). . . . .111
4-2 (a) Mean stress map under a biaxial displacement test and (c) stress map of the uyy-component under a uniaxial displacement test applied at a frozen reaction extent, where 1 = (#) = 0.80; the density patterns
that correspond to the above stress maps are plotted in Fig. 2-11. . . 113 4-3 (a) Mean von Mises stress measured in the samples in function of the
reaction extent. (b) Maximum von Mises stress measured in the gel phase in function of the reaction extent. Density fields were subjected to a uniaxial displacement controlled mechanics test. . . . . 115
4-4 (a) Two-point correlation function for the mean stress as calculated from the plotted distributions in Fig. 4-2(a) for highly diffusive (Da =
0.1; top subplot) and moderately diffusive (Da = 0.4; bottom subplot) systems; calculated from the results of the biaxial displacement test. (b) Plot of the maximum equivalent tensile stress in function of the standard deviation of the packing density; calculated from the results of the uniaxial displacement test. The bold grey line is a linear fit to the data. . . . . 115
4-5 (a) Mean total stress measured in function of the reaction extent. (b) Back-calculated volumetric strain in function of the reaction extent. . 117
4-6 (a) Comparison of the evolution of the Young's modulus, Ehom, for cement paste as experimentally probed by nanoindentation and sim-ulated under grand canonical molecular dynamics simulations; data points were scraped from Ref. [68]. A cubic power-law between fits the evolution well. . . . . 119
List of Tables
2.1 List of parameters used in the Allen-Cahn reaction equation and the Gibbs free energy functional, and their normalizations; parameters with a tilde denote non-dimensionalized quantities. . . . . 45 2.2 Parameters defining the free energy landscapes of the stable cluster
precursors, where Azc = AJmM + BM2/3 + CM/ 3, and B = 2.350 and C = 0.023 are left constant. . . . . 51
3.1 Input parameters for simulation results that include hydrodynamic flow of particle clusters; lengths scaled by the system size LYS, time scaled by dilute nucleation rate ho, density scaled by po, and stress scaled by
Chapter 1
Introduction
1.1
General context and research approach
Cement paste is perhaps one of the most important and abundant colloids in the world. It is estimated that around 4.1 Gt of cement were produced globally in 2017, accounting for 5-8% of global CO2 emissions[125]. Due to its use as a binder in
con-crete, cement is subjected to many harsh environments, and yet is expected to perform as a durable, cheap, and long-lasting building material. Thus, it behooves us to in-vestigate, engineer, and optimize its performance. Proper design relies on a physics based understanding of the constituent phases that lend the material its incredible cohesion, and informed models that probe the boundaries of its durability. Although a multitude of cement hydration models exist (e.g., the vector-based pic model [22], and cellular automata models CEMHYD3D [19] and HydratiCA [27]), most focus on how the chemical environment influences the formation of different product phases and achieving agreement with observed hydration kinetics. The present work will demonstrate the ability of phase-field approaches to capture the features of cement paste solidification and the microstructural information salient to its mechanical char-acterization.
Revolutionary to materials science, Allen-Cahn reaction kinetics have successfully described a plethora of phase transformation phenomena: dendritic growth in under-cooled metals, ion intercalation in Lithium battery materials, and hydrate formation
on methane bubbles, to name a few [5, 34, 119, 126, 146]. It is thus surprising that this generalized phase-field approach has eluded application to cement solidification, which exhibits nucleation and growth kinetics similar to many solute-solvent systems. Moreover, because the Allen-Cahn reaction model relies principally on the formula-tion of a system's free energy (for cement hydrates this includes, e.g., bulk chemical free energy, interfacial energy, and/or electrostatic energy), it is an excellent vehicle to upscale information gleaned from out-of-equilibrium particle simulations.
Critical to the physical picture of cement paste, is its granular, colloidal origin. In the process of developing a model that satisfies the physics of how cement's mi-crostructure behaves, it quickly becomes evident that many key phenomena apply to reactive colloids in general. Thus, before detailing the nonequilibrium thermodynamic theory that underlies the reaction kinetics and flow behavior of hydrating cement, we provide an introduction to important soft matter physics terminology and review recent research findings on particle-based systems. Additionally, we briefly detail the hierarchical organization of cement paste and the nature of the calcium-silicate-hydrate nanograins that provide it its cohesion.
1.2
What is a colloid?
A colloid is a collection of nanometer- to micron-sized particles interacting in a fluid or solution. And though colloids have traditionally been defined as fluid-like dispersions that remain suspended on account of the system's thermal fluctuations, the term has become more all-encompassing, referring to the collective behavior of particles that attract or repulse and interact at varying relative length and time scales [89]. As examples, Fig. 1-1 depicts three colloids of vastly different constitution that we encounter in our daily lives: i) Fog, an aerosol consisting of water droplets dilutely dispersed in the atmosphere, ii) yoghurt, a solution of weakly interacting casein mi-celles, i.e. milk proteins, which, when jammed, presents a yield-stress fluid, and iii) cement paste, the binding material in concrete, which is composed of a rigid, densely packed gel of calcium-silica-hydrates that attains elasticity on the order of tens of
fog yoghurt cement paste
Figure 1-1: Examples of colloids: Fog, which consists of minute, mobile water droplets dispersed in air, yoghurt, a yield-stress fluid of jammed casein micelles, and cement paste, an arrested gel of strongly bonded calcium-silica-hydrate nanoparticles. Images sourced online from pexels.com
[1].
giga-pascals. There has been much recent interest in studying colloids due to their ability to mimic atomic systems inaccessible to microscopy [87], and configure into functional, self-assembling structures with applications in biophysics, nanotechnology, and electrochemistry [75, 60, 156]. Additionally, deeper understanding of the hierar-chical assembly of colloids has advanced the design of manufacturing and construction materials where improvement via conventional material descriptions, remiss to partic-ulate details, had plateaued [47, 13, 70, 68, 64]. Though identified as a colloid decades ago [108], soft matter phsysics concepts relating to cement paste have only recently been exploited to gain insight into the characteristics that lend it its exceptional me-chanical properties [71, 92, 68]. Similarly, the functionalization of magnetic iron oxide nanoparticles for use in bio- and nanotechnologies is being harnessed by advances in synthesis and controlled aggregation [80, 43, 13], and the design of lithium-ion bat-teries with aqueous electrolytes has benefited from better modeling the precipitation kinetics of its discharge products [56, 64]. Many other areas of research can be listed that would benefit from better modeling tools for nanoparticle assembly.
1.3
Cement paste as a colloid
Cement paste is a colloid produced by mixing water with anhydrous portland cement powder. The most important constituents of portland cement are tri- and dicalcium silicate (C3S and C2S, respectively), which control the early stage setting and strength
(CC
(d) (e)()
54Nnm
Figure 1-2: Panel of images demonstrating the colloidal nature of cement paste: (a) X-ray spectroscopy image of a C3S grain dissolving in dilute solution
17];
solidar-row points toward C-S-H nanoparticles precipitating near, yet detached from, the
C3S surface. Transmission electron micrograph images of C-S-H (b)(d) inner and (e) outer product from Refs. [112, 113]. (c) Two-dimensional cartoon pore space and amorphous assembly of C-S-H proposed by T.C.Powers [108]. (f) Computer gener-ated three-dimensional texture of cement paste obtained by combining a molecular dynamics simulation of the nanoparticles with a Grand Canonical Monte Carlo inser-tion scheme [68].
development of the material
[501.
Within an instant of mixing, dissolution of the calcium silicates saturates the pore solution with simple hydrated ionic species (Ca+, OH-, and H2SiO2-), and following a brief nucleation period, the principal products ofcement paste, termed hydrates, precipitate out of solution. Powers and Brownyard, two renowned cement scientists, described setting cement paste as "an amorphous mass enclosing microcrystalline Ca(OH)2 and unhydrated residues of the original
cement grains" [109]. Since then, significant progress has been made to understand the structure of this "amorphous mass" - the calcium-silicate-hydrates (C-S-H)-that lends the gel its mechanical performance, and comprise approximately 60% of the volume of a fully hydrated cement paste1.
At its most elementary scale, C-S-H has been found to precipitate as nanometer-sized units 1101, 70] with a molecular structure that exhibits both glass-like short-range order and regions of crystallinity [106]. At larger length scales, the treatment of cement paste as a colloidal dispersion has elucidated the hierachical organization of these sub-units and the impact of their assembly on the material's elasticity [92, 68]. In fact, a recent X-ray spectroscopy study, which investigated isolated C3S grains
dis-solving in a dilute suspension, showed evidence of C-S-H nanoparticles precipitating out of solution and reattaching onto the anhydrous C35 phase [7]; an image thereof is
diplayed in Fig. 1-2(a). Furthermore, Figs. 1-2(b), (d), and (e) display transimission-electron-microscope images of C-S-H at the nanometer scale, from which a clear gran-ular morphology is discerned. Importantly, these grains are seen to pack at different densities. Beyond the visual evidence provided, the statistical frequency distribution of the local modulus, which is constructed by nanoindentation measurements, shows that C-S-H particles organize themselves into low-density and high-density assemblies reminiscent of loose-packed and close-packed granular morphologies [36, 72, 135]. Ad-ditionally, molecular dynamics simulations of coarse-grained C-S-H nanoparticles have been shown to recreate the mesoscale structure of cement paste at a scale of 100s of nanometers, deciphering the role of the physicochemical environment on the gelation
'The C3S, C2S, and C-S-H abbreviations are based on cement chemistry notation, where Ref. [134]
2 [Ca(OH)2] = 3.15 mM 2 -m [Ca(OH)2] = 4.53 mM . 1.5 1 + [Ca(OH)2] = 10.31 mM C1 0 ~0.5 -00 2 4 6 8 0 0 5 10 15 -1 - Ca(OH) 2 concentration (mmol/L) (b)
tip-substrate separation (nm) (a)
Figure 1-3: (a) Interaction force measured between a flat C-S-H surface, and C-S-H deposited at the end of an atomic-force-microscope (AFM) tip. The AFM tip was immersed in a solution of increasing calcium hydroxide concentration to vary the pH and before being lowered onto the stationary surface; the ionic strength was main-tained constant by adding a proportional concentration of counterions. (b) Adhesion force in function of increasing lime concentration and pH.
dynamics of the hydrates [68, 67, 25] (see Fig. 1-2(f)). Here, it was found that the C-S-H nanograins precipitate into an out-of-equilibrium structure, whose solid packing fraction is the principal determinant of the local elastic modulus [92].
The concern of the current thesis is modeling reactive colloidal dispersions, such as the pore solution - C-S-H nanoparticle mixture, to decipher the parameters that govern the density patterns that form and connect these to the mechanical behavior of the gels. For cement, we presume that these density patterns form by the coalescence of metastable C-S-H precursors that nucleate into bulk glass-like masses that grow, interconnect, and produce the highly cohesive glue that is cement paste. Evidence of such metastable precursors has been found in a variety of mineral and colloid systems en route to bulk nucleation and will be discussed in the next section of this introduction. Importantly, our granular interpretation of the microstructure of cement paste means that the attractive-repulsive interaction between C-S-H surfaces dictates both the density pattern formation and the strength of the material. For C-S-H, the interaction energy is strongly dependent on the ionic concentration of the pore solution. In particular, the multivalent ions in solution give rise to
range attractive and long-range repulsive interactions
[671.
In course of the setting, the long-range repulsion, which is due to the entropic pressure of the large divalent ions, subsides and the electrostatic attraction, which increases as the OH groups on the particle surfaces ionize, dominates [100, 102]. Measurements using atomic-force microscopy show that the adhesion force between two C-S-H surfaces follows a fairly linear behavior with respect to the Ca(OH)2 concentration (see Fig. 1-3 which wastaken from Ref. [106]). Because the calcium concentration almost instantaneously super-saturates the pore solution upon contact of calcium-silicates with water
[961,
a short-range attractive well exists between C-S-H particles thoughout the setting process of cement [102].
1.3.1
Volume changes of cement paste during hydration
It is well known that cement paste undergoes two types of volume change during the hydration process: 1) An absolute volume change, and 2) a relative or apparent volume change. The absolute volume change, first identified by Le Chatelier in his experiments on the material in 1898 [83], refers to the observation that the density of the cement paste reactants - the molecules composing the water and anhydrous clinker grains - is less than the density of the cement paste products - the molecules composing the hydrated phases, principally C-S-H and calcium hydroxide. For in-stance, a hydrating cement sample kept saturated by immersion in a water bath will see the surface of the bath lower as the reaction extent progresses [107]. The overall reduction of the volume can reach up to 50-60pl per gram of cement and is often referred to as chemical shrinkage. Relative volume changes on the other hand, refer to volume changes of the bulk structure due to the deformation of its porous, solid skeleton. To record relative volume changes, percolation of a solid network and onset of material compressibility is a prerequisite. In a sealed environment, self-desiccation of the hydrating cement paste lowers the internal humidity of the pore structure, which offers capillary effects [150] and/or disjoining pressure [16] as forces driving the observed bulk deformation. However, It has been known since Le ChAtelier's ex-periments that relative volume changes are produced even in saturated samples that
(a)
op ort
(p=
(b)Pot
Pb)
Car (c) -25C -35C -45C E E &. W 0 100 200 300 400 500 Time [h] 600 600 500 400 300 200 100 0 -25C -35C -45C 0.3 0.4 0.5 0.6 0.7 Hydration Degree, fFigure 1-4: (a) Schematic of experimental pressure vessel used to measure bulk volume changes of hydrating cement paste under saturated, drained, isobaric, and isother-mal conditions; for specifics about the design consult Ref. [3, 2]. The neon green rubber diaphragm seals the cement sample from the upper compartment and sepa-rately allows water access through top and bottom ports. (b) Volume changes of C3S
hydrating at varying constant temperatures in function of the hydration time. (c) Volume changes of C3S hydrating at varying constant temperatures in function of the extent of the reaction/ hydration degree, which was back calculated from calorimetry measurements. Figures were adapted from Ref. [2].
28 E I-. L 600 500 400 300 200 100 0 0.8
maintain sufficient access to water.
A recent, high-precision experimental study on centimeter sized samples of hy-drating cement paste further confirmed the presence of relative volume changes while ensuring no changes in external loading and maintaining the temperature and pressure of the reactive environment constant [2]. Fig. 1-4(a) shows the experimental setup, where the cement sample is placed into the cylindrical volume that is enclosed by a flexible, rubber diaphragm (colored in neon green). The rubber diaphragm ensures that no water from the top of the chamber can enter into the sample. Two ports at the bottom and top of the chamber dispense or intake water to maintain a constant pressure in the sample and separated top compartment, respectively. The combined flux of water entering through the top and bottom ports thus measures the chemical shrinkage incurred during the hydration reaction (the absolute volume change), and the influx solely through the top measures volume changes to the bulk structure, the relative volume changes.
Results for bulk volume changes recorded for samples hydrated at three different temperatures are displayed in Figs. 1-4(b) and (c) in function of time since mixing and the hydration degree - a measure of the extent of the reaction -, respectively. For all samples, the early period, immediately succeeding percolation of a permanent, compressible structure, sees a volume expansion until reaching a maximum value at a hydration degree around 0.63-0.65. Thereafter, the samples begin to shrink. We further note that the magnitude of the volume changes decreases as the temperature of the environment increases. As the pore space remains saturated throughout the reaction process, the previously identified forces, surface tension in capillary and gel pores and disjoining pressure, cannot account for change in dimension. Instead, we believe the volume changes to be of colloidal origin, and, more specifically, due to the relaxation of internally-generating stresses between C-S-H grains. The hypothesized phenomena are explained as follows:
* Initial expansion is due to precipitation of new hydrates into confined, packed volumes. Though the absolute volume of the reactants diminishes during trans-formation, the absolute volume of the solids increases as water is absorbed
into the molecular structure [107]. Once the cement paste is locally sufficiently packed, further insertion of solids into these jammed regions exerts a pressure onto the surrounding hydrates that leads to expansion. We note that a near instantaneous gelation and mechanical resistance in the system is caused by the connectivity of residual anhydrous grains that are "glued" together by precipi-tated C-S-H. Thus, swelling behavior is enabled as soon as the packed regions near the connections of the anhydrous grains expand.
e At later stages in the reaction, particles precipitate and fill regions of the cement paste that were formerly occupied by capillary pores. As a consequence, C-S-H surfaces increasingly come into contact with one another, such that the strongly inter-attractive potential due to the ion-ion correlation allows the bulk volume changes to reserve direction. This hypothesis is strengthened by the observation that the hydration of Magnesium Oxide (MgO), which forms an electroneutral product with similar colloidal morphology, shows an expansion that is linear with its degree of hydration even at high overall packing densities [3]. The absence of shrinkage in the Mg(OH)2 system suggests that the difference in
behavior is related to the interaction potential, which here consists only of a hard-core repulsion (this can be compared qualitatively to the interaction force presented in Fig 1-3(a) for C-S-H).
Naturally, the general picture outlined above is complicated by heterogeneity in the cement paste that spans several relevant length scales, and a dynamic reaction envi-ronment that continually modifies the strength and shape of the attractive-repulsive potential between C-S-H surfaces. Nonetheless, the current dissertation offers simu-lation results that strongly support a theory for volume changes in cement paste that originate from colloidal interactions.
Figure 1-5: Confocal microscope images of phase separating colloid-polymer mixtures, where the left image, (a), shows the fractal morphology of particles assembling under conditions of diffusion-limited aggregation due to a strongly attractive, short-range interaction potential, and the right image, (b), shows the morphology of a nucleation and growth process brought about by spinodal decomposition [6]. While the former structure is, for all intensive purposes, arrested, the latter continues to coarsen due to thermal fluctuations that are strong enough to cause particle rearrangement.
1.4
The difference between colloids with repulsive
and attractive inter-particle potentials
Though this thesis is principally concerned with gelation and precipitation of colloids composed of particles whose surfaces are attractive with respect to one another, it is nonetheless informative to review key similarities and differences with systems where repulsion dominates. Specifically, we briefly focus on delineating the differences be-tween attractive gels and attractive-repulsive glasses, as both contain features that have helped explain the morphology and mechanics of cement paste. Moreover, col-loids in open systems are likely to transition from the gel phase to the glass phase dur-ing hydration and precipitation reactions as the system becomes increasdur-ingly packed. A excellent review of the similarities and differences between gels and glasses can be found in Ref. [133]
1.4.1
Glasses
Colloidal glasses are dynamically arrested, nonergodic, disordered states, whose elas-ticity derives primary from caging effects. That is to say, rearrangement or aging of glasses slows, as neighboring units provide insufficient free volume for particles to find their thermodynamic equilibrium positions. Glasses typically form by reducing the free volume a liquid quickly enough to avoid crystallization. The liquid-glass transi-tion is a jamming phenomena which is attained by reducing temperature, modifying the attractive or repulsive strength between particles, or compressing the system to reduce the inter-particle separation and increase the packing density [1401. An im-portant feature of colloidal glasses is that the characteristic length scale defining the elasticity is of the size of the particles, and unlike a gel, which forms at packing den-sities as low as a few percent, glasses typically form at packing denden-sities exceeding 0.50.
1.4.2
Gels
Experimental observations and mode-coupling theory have demonstrated that two length scales dominate the physics of attractive colloids [20, 77, 33]: Colloids aggre-gate into clusters of characteristic size, which further assemble into an arrested meso-copic network. Upon quenching - that is, rapidly increasing the relative attractive strength between particles, for instance by decreasing the temperature or changing the constitution of the solvent - these systems undergo glass-like dynamic arrest where cluster-cluster aggregation exhibits limited bond-breakage and the structure factor
Sq does not significantly change on observational time scales. Akin to an athermal
granular medium, the colloid-rich phase undergoes a jamming transition due to the local crowding of clusters, as opposed to grains, which presents a "hidden" binodal at densities far below the thermodynamically predicted dense equilibrium [32, 117, 51J. For mechanically unperturbed systems, thermal fluctuations promote densification toward equilibrium so slowly that further advances are made principally by reac-tive precipitation into the local structure. The transition from the ergodic to the
non-ergodic state is termed the sol-gel transition, where the sol phase is typically composed of small disconnected clusters of particles. Thus, unlike the liquid phase, the sol phase is inhomogeneous. Here we point out the key characteristics that define a colloidal gel:
1. The characteristic size of the of colloidal clusters that make up the gel network is much larger than the size of the colloidal particles themselves a,
>
a. Thus, gels have a hierarchical structure, with at least two relevant length scales: clus-ters, and the percolated cluster network (aggregates made up of many clusters). 2. The characteristic lifetime of the contacts between clusters exceeds observational time scales; in other words, thermal fluctuations are sufficiently small compared to the well depth e of the inter-acttractive potential between colloidal units,kBT < e.
Fig. 1-5(a) and (b) show experimental images of phase separation in sol-gel sys-tems. While the left image (a) displays the arrested structure for a system spanning gel, the right image (b) displays coarsening kinetics of a weakly attractive particles whose regions transition between being classified as a sol (i.e. finite-time colloidal clusters), an amorphous glass, and - if sufficient time elapses - an equilibrium crys-tal. This highlights the complexity a single parameter, the interaction strength, can play in the dynamic behavior, structural heterogeneity, and hierarchy of colloids, as also shown in the simulation results present dissertation.
1.5
How do stable primary particles of characteristic
size form in reactive colloidal systems?
From a conceptual point-of-view, the first question that must be answered before de-vising a suitable mathematical framework for the dynamic of colloids in open systems is: How do stable primary particles of characteristic size form in reactive colloidal systems? Or asked another way: Why don't reactive materials such as cement paste
evolve by growth and coalescence of homogeneous masses? Clearly identifiable, sta-ble, nanometric C-S-H grains of a characteristic size that act as building blocks for further agglomeration indicate that thermodynamics itself (rather than dynamics) helps define multiple relevant length scales that drive the system to minimize its free energy. The presence of such stable precursors has recently been observed in a host of other bio- and geomineral systems, and can also be shown to exist as colloidal clusters that are stabilized by weak, long-range electrostatic interactions [52, 116]. This brings to light a two-step nucleation process that is unexplained by the classical theory of nucleation and growth. Because these physics are likely relevant to the way cement paste reacts, we highlight two recent experimental investigations of similar, representative systems:
1. The first clear evidence of stable precursors in undersaturated solutions was provided by Gebauer and coworkers in their study on calcium carbonate ion clusters [53]. Fig. 1-6 summarizes the main result of their study. During their experiment, the researchers gradually increase the aqueous Ca 2 concentration by adding dilute calcium chloride solution into a dilute carbonate buffer. The gradual increase in calcium ions induced supersaturation of the solution and eventual nucleation of amorphous calcium carbonate. The remarkable feature plotted in the figure, is that the amount of calcium added to the solution prior to nucleation differs from the increase in free calcium ions detected in the solution. That is to say, a proportion of the free calcium ions bind to form stable ion clusters. This relation remains linear prior to nucleation and persists even in the under-saturated regime. The authors showed the preformation of clusters prior to nucleation could be explained by equilibrium thermodynamics, incorporating the binding energy of ions.
2. The second relevant study we wish to highlight, investigates the precipitation of stable, monodisperse silica nanoparticles. Silica formation was promoted by slow diffusion of tetraethyl orthosilicate (TEOS) into a lysine solution. After addition of TEOS, the authors (Carcou~t et al. [31]) recorded a drop in pH
smto an -neasured
uet -udokd nc ds da
S2 _dbf
pHion whro te redlein indicate thatta frccrtion offrin addedcaimbnd to thre
carte. TrPh showed the velrofnt eraured f ionin a nuration ioctat
TH hese bheund pimar pniaties hruoalnettin sizre (ns a.3de) and the smle soutontinud ter byac lieinirsthe ddintrtion of rre ariones thasuet inh
solution. Undshdler apprdprates satuditions ot the iar wiahrtesp (prit toiu asoiatin Thipt asslemles) and the maseie wre demonsetratdio bedistbes
nucleation of bulk calcium carbonate. The difference in dosed and measured concen-trations prior to nucleation indicate that a fraction of added calcium binds to form stable ion clusters. Figure copied from Ref. [531.
that followed the simultaneous precipitation of monodisperse silica nanoparti-dles with a mean size of 2.3nm that increased in number not size over time. Over time, the stable particles associated into assemblies, for which 3D electron tomography showed the internal structure to maintain a granular morphology. These bound primary particles shrunk in size (to 1.3nm), and the assemblies continued to grow by further addition of primary particles that nucleate in solution. Under appropriate conditions, both the primary particles (prior to association into assemblies) and the assemblies were demonstrated to be stable over the course of days.
These experiments, which demonstrated the formation of stable, monodisperse clusters or primary particles prior to bulk nucleation, provide a physically consis-tent theory for the reactive-diffusive mechanics of colloids and inspired our interpre-tation of the preformation C-S-H nanograins prior to aggregation into a rigid gel. Throughout this thesis we refer to primary particles as stabilized base units that may further assemble to form bulk nuclei, and whose local structure settles into an out-of-equilibrium, mesoscopic gel phase.
TEOS 9.1- a Hydrolysis 9.0D Condensation 8.8 8.7-'u 8.6 _ 'CLOUDS 8.5. 8.4-Densification - 0 Association
PRMARY PAIMcLES ASSEMBUES
ii.- n 23nmn 2.3 nm 1.3 nmns' Collapse OIapl 5 10 Time [hours] G'jj% h IIM
Figure 1-7: Figure copied from Ref. [31], which experimentally investigated silica formation by slow diffusion of tetraethyl orthosilicate into a lysine solution. The pan-els demonstrate the different stages in forming bulk silica from stabilized colloidal nanoparticles. Plots of pH monitoring during the reaction of (a) a highly concen-trated suspension in which thermodynamically metastable primary particles further assembled into bulk clusters, and (b) a dilute suspension in which the stable primary particles formed but did not further aggregate into bulk clusters. (c)-(h) Cryo-TEM images of the suspension demonstating the formation of the primary particles and further assembly into bulk clusters. After association to form bulk nuclei, no new as-semblies are formed and growth occurs by addition of newly formed primary particles to the existing structure.
36 91 b 9.0 8.9 0 1 2 3 6 Time [hours] 15 20
1.6
Thesis Outline
This dissertation is outlined in the following manner: In the current chapter, we defined a colloid, how it behaves, and what relevant aspects of this soft matter ma-terial class might further our understanding of the cement paste microstructure. In Chapter 2 we introduce relevant concepts of non-equilibrium thermodynamics, and utilize the free energy minimization criterion to write a dynamic equation for pri-mary particle precipitation and diffusion. Here, the Allen-Cahn reaction equation is adapted to the thermodynamic landscape of primary particles, which influence the auto-catalytic behavior of the reaction rate. Additionally, we incorporate dynamic asymmetry into an order-parameter mobility for particle diffusion. This allows us to capture the glass-like arrest accompanying gelation process in attractive colloids previously observed in experiments. After providing a linear-stability analysis of the dynamic equations that evolves our density field, we finish the chapter by presenting several results for conserved (diffusion-only) and non-conserved (reaction and diffu-sion) systems and elaborate on the controls of pattern formation. Lastly, we relate our findings to cement paste, hypothesizing that its curing temperature affects the thermodynamic landscape of the primary particles and is ultimately responsible for changes in the microstructure of hardened samples.
Next, Chapter 3 investigates phase reparation under combined influences of the Allen-Cahn reaction rate and hydrodynamic flow. Under this directive, we solve a momentum balance equation for inelastic flow that accelerates the massive particles once they enter the spinodal region and become unstable to small density fluctuations. The driving force for acceleration is a thermodynamic stress that is resisted by a mechanical stress once the colloid locally transition from being a sol to being a gel. We solve the mechanical stress build-up in the solid-like gel phase in incremental form, and demonstrate the ability of inter-attractive particles that arrest into an out-of-equilibrium configuration to entrench a residual stress into the network. For non-reactive systems, in which particle mass is conserved, we show that a steep increase in viscosity at the gelation threshold enables clusters to form that further aggregate
as rigid bodies. Interestingly, this modifies the scaling relation for the coarsening dynamics to differ from the universal behavior observed between between equilibrium phases.
Having introduced our incremental approach to calculating stress generation in re-active systems in Chapter 3, where the elasticity and internal loading change in func-tion of the packing density, we apply these ideas to the reacfunc-tion-diffusion patterns pre-viously generated in Chapter 2. Under bi-axial and uni-axial displacement-controlled loading protocols we upscale the two-dimensional bulk modulus and Young's mod-ulus, respectively. By plotting the distribution of stresses in the microstructure, we observe a broadening of their probability density functions that predicts significant loss of durability for strongly heterogeneous systems. Lastly, we quasi-statically solve the stress development in the systems under loading of a thermodynamic stress. We show that these conditions cause an entrenched residual stress may be responsible for the volume shrinkage observed in hydrating cement pastes.
38
![Figure 1-2: Panel of images demonstrating the colloidal nature of cement paste: (a) X-ray spectroscopy image of a C 3 S grain dissolving in dilute solution 17]; solid ar-row points toward C-S-H nanoparticles precipitating ne](https://thumb-eu.123doks.com/thumbv2/123doknet/14473551.522810/24.917.134.777.280.698/figure-demonstrating-colloidal-spectroscopy-dissolving-solution-nanoparticles-precipitating.webp)

![Figure 1-7: Figure copied from Ref. [31], which experimentally investigated silica formation by slow diffusion of tetraethyl orthosilicate into a lysine solution](https://thumb-eu.123doks.com/thumbv2/123doknet/14473551.522810/36.917.234.680.236.692/figure-experimentally-investigated-formation-diffusion-tetraethyl-orthosilicate-solution.webp)