MIT Global Scale Network
MIT SCALE RESEARCH REPORT
The MIT Global Supply Chain and Logistics Excellence
(SCALE) Network is an international alliance of
leading-edge research and education centers, dedicated
to the development and dissemination of global
innovation in supply chain and logistics.
The Global SCALE Network allows faculty, researchers,
students, and affiliated companies from all six centers
around the world to pool their expertise and collaborate
on projects that will create supply chain and logistics
innovations with global applications.
This reprint is intended to communicate research results
of innovative supply chain research completed by
faculty, researchers, and students of the Global SCALE
Network, thereby contributing to the greater public
knowledge about supply chains.
For more information, contact
MIT Global SCALE Network
Postal Address:
Massachusetts Institute of Technology 77
Massachusetts Avenue, Cambridge, MA 02139 (USA)
Location:
Building E40, Room 267
1 Amherst St.
Access:
Telephone: +1
617-253-5320
Fax: +1
617-253-4560
Email: [email protected]
Website: scale.mit.edu
Research Report: MISI-2015-3
Cost and Benefits of Order Flexibility
Arun Param and Lim Da Chin
MIT Global Scale Network
For full thesis version please contact:
Professor Shardul Phadnis
Director of Research
MISI
No. 2A, Persiaran Tebar Layar, Seksyen
U8, Bukit Jelutong, Shah Alam,
40150 Selangor, Malaysia.
Phone: +6 03 7841 4845
C
OSTS AND
B
ENEFITS OF
O
RDER
F
LEXIBILITY
By Arun Param and Lim Da ChinThesis Advisor: Dr Shardul Phadnis
Summary: At what point does the freedom to choose turn out to be a double-edged sword? The dynamic nature of global markets today forces planners to be creative when dealing with uncertain demand. One way to deal with such uncertainty is through the use of ‘order flexibility’. Put simply, when making an order, order flexibility allows a given entity to deviate from a forecast that the entity had provided earlier. Our thesis takes a closer look into the costs and benefits involved in providing order flexibility within a global vertically integrated supply chain at a large coffee house company: CoffeeCo.
Arun Param holds a Bachelor of Computing from Monash University and a Graduate Diploma in Management from the University of New South Wales. Prior to the MSCM program, he worked as a management consultant at Deloitte and also worked on a few independent consulting projects. Upon graduation, he will be joining the rotational leadership development program at Amazon.
Lim Da Chin holds a Bachelor of Business Management from Singapore Management University. After his Bachelor’s, he spent five years at BHP Billiton within various market risk related roles. Prior to the MSCM program, he worked as an Assistant Manager within the Market Risk Department at Golden Agri Resources.
KEY INSIGHTS
1. Order flexibility should be an important consideration in supply chain policy design due to its direct
influence on supply chain costs and service levels.
2. If the DC provides forecasts with high accuracy (i.e. low forecast error), and if the DC holds adequate
safety stock, then the benefit (increase in DC service levels) provided by the order flexibility policy is
marginal.
3. If the DC is biased towards optimistic (over) forecasting, then increasing order flexibility reduces
costs at both the DC and the RDC. On the other hand, if the DC is biased towards pessimistic (under)
forecasting, then increasing order flexibility significantly increases DC service levels, and decreases
RDC costs.
4. If the DC has inadequate levels of safety stock, then you would expect that increasing order flexibility
would result in an increase in DC service levels, however in fact the opposite is true - increasing
order flexibility lowers DC service levels.
5.
Safety stock levels at the RDC may need to be adjusted for different levels of flexibility. For instance,
if the level of flexibility provided easily caters for the level of uncertainty in demand, then the safety
stock held should be determined by the uncertainty in demand. However, if the level of flexibility
provided constrains the variability in demand, then the amount of safety stock held should be
determined by the level of flexibility provided.
Overview
CoffeeCo is a global coffeehouse chain. CoffeeCo has 15 distribution centers (DC) serving different countries across the Asia Pacific region. These DC’s receive supplies from a regional distribution center (RDC) in Singapore. To manage uncertain demand, the RDC provides the DC’s with 30% of ‘order flexibility’ when placing an order. Let us illustrate the concept with an example.
Let us assume that Hong Kong, one of the DC’s served by the RDC, has forecasted that it wishes to purchase a 100 paper cups. When it comes time to make an order, the Hong Kong DC now has the flexibility to order anywhere from 70 through to 130 cups. Essentially, the Hong Kong DC is allowed to deviate up to +-30% from their initial forecast. This policy of providing such a level of flexibility in the ordering process is what is currently referred to ‘order flexibility’.
Is the order flexibility policy more of a help or a hindrance? This thesis answers the question by evaluating the costs and benefits of order flexibility at CoffeeCo. While CoffeeCo is the subject of study for this thesis, the findings and insights can be applied to supply chains in general.
Data Analysis
CoffeeCo provided us with data on one year’s worth of forecasts and orders for all Stock Keeping Units (SKU’s) across markets. Analyzing the data provided us with some insight into the real world context of the problem.
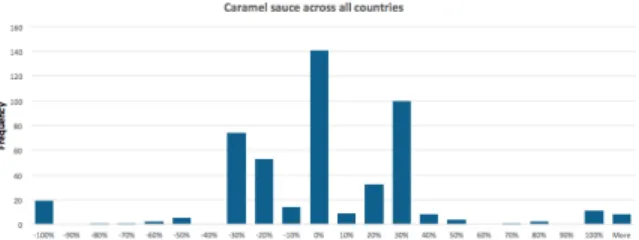
Figures 1 to 3 show the level of deviation observed between forecasted and final order quantities across various markets and SKU’s. Figure 4 illustrates how order patterns differ by country.
The data analysis provided us with a better idea of some of the forecasting and ordering patterns that existed within CoffeeCo, and a better grasp of the context of the problem.
Figure 1: All SKU’s across all country DC’s
Figure 2: Caramel sauce across all country DC’s
Figure 3: Cups across all country DC’s
Figure 4: Forecast patterns by country
For instance, we learned that the Hong Kong market typically forecasts optimistically (i.e. they over forecast). We also learned that non-perishables SKU’s such as paper cups are also more optimistically forecasted in comparison to perishable SKU’s such as caramel sauce.
Nature of the problem
An analysis of the data provided coupled with discussions with senior management at CoffeeCo’s distribution planning function revealed that the order flexibility policy is influenced by numerous drivers. Some of the factors include: inventory replenishment policies at RDC and DC, lead times, shelf life, holding costs at the RDC and DC, spoilage costs, expediting costs, product market value, nature of demand, desired service levels, over forecasting vs. under forecasting, and safety stock levels. Each of these drivers, either by itself, or in combination with other drivers, could have an impact on the costs and benefits of order flexibility. With so many possible drivers, and different gradations each that driver
could take, the number of unique scenarios impacting order flexibility are innumerable.
Methodology
We decided to use a systems dynamic approach to tackle this problem. System dynamics allows us to model real world scenarios by building simulations of complex systems. System dynamics is also useful in understanding real world problems that have a time lag to feedback. Such factors make system dynamics especially useful in the study and evaluation of policy based decisions. For CoffeeCo, determining the costs and benefits of the order flexibility policy is a complex problem, especially due to the infinite possibilities of unique scenarios that can occur within their supply chain. It is hard to answer the question without studying the system holistically and determining the key drivers of costs and benefits in the system.
Building the Model
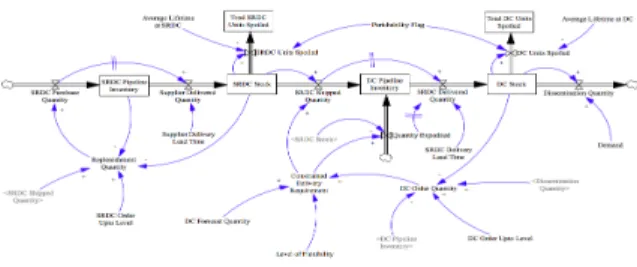
We built a system dynamics simulation model using the Vensim software. In the model, we begin by replicating CoffeeCo’s basic supply chain, starting from supplier purchases to dissemination from the DC.
Figure 5: Modelling the Basic Supply Chain Next, we expanded the model by adding pipeline inventory and lead times. Then, forecasts, actual orders and level of order flexibility (the primary variable of this study) were added. Following that, RDC and DC replenishment policies were modelled along with market demand. Finally, the effects of perishability were added into the model.
Figure 6: The complete model in Vensim The model also tracks various metrics that include: holding costs, spoilage costs, expediting costs, lost sales, and fill
rates at both the RDC and DC. Scenario Development
Because of the multi dimensional nature of the problem, it was necessary to narrow down the problem to a limited number of scenarios. The scenarios were developed based on common occurrences in the real world data and through discussions with CoffeeCo. The scenarios developed are as follows:
1. A base case scenario assuming sufficient safety stock to reach 95% service levels and 99% service levels for the RDC and DC respectively. The base case scenario assumes demand follows a normal distribution with mean of 100 units, and uses a constant forecast of 100 units.
2. An optimistic forecasting scenario where forecast was set to a constant of 150 units. All other parameters were similar to the base case. 3. A pessimistic forecasting scenario where forecast
was set to a constant of 50 units. All other parameters were similar to the base case. 4. A scenario in which the DC’s safety stock was
halved. All other parameters were similar to the base case.
5. A scenario in which the DC’s safety stock was doubled. All other parameters were similar to the base case
6. A scenario in which the RDC’s safety stock was halved. All other parameters were similar to the base case.
7. A scenario in which the RDC’s safety stock was doubled. All other parameters were similar to the base case.
Results
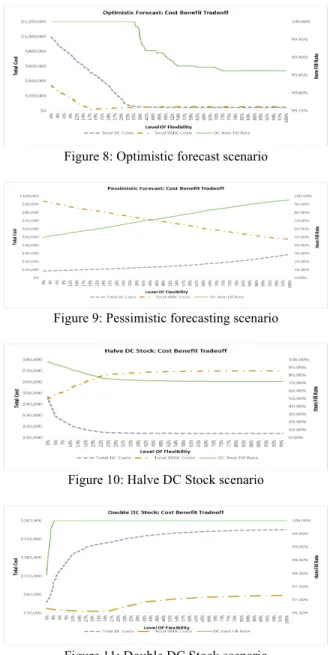
We used a Monte Carlo simulation to run each scenario 1000 times for levels of flexibility ranging from 0% to 100%. Figures 7 through to 11 show the high level cost benefit trade-offs under the various scenarios.
Figure 8: Optimistic forecast scenario
Figure 9: Pessimistic forecasting scenario
Figure 10: Halve DC Stock scenario
Figure 11: Double DC Stock scenario Conclusion
Order flexibility needs to be an important
consideration in supply chain policy design since it can have major effects on costs and service levels. The costs and benefits of order flexibility are varied and depend on the nature of the supply chain the policy applies to. For CoffeeCo’s supply chain, we have found that:
1. Order flexibility should be an important
consideration in supply chain policy design due to its direct influence on supply chain costs and service levels.
2. If forecast accuracy is high, and if the DC holds
adequate safety stock, then the benefit (increase in DC service levels) provided by the order flexibility policy is marginal.
3. If the DC is biased towards optimistic (over) forecasting, then increasing order flexibility reduces costs at both the DC and the RDC. On the other hand, if the DC is biased towards pessimistic (under) forecasting, then increasing order flexibility significantly increases DC service levels, and decreases RDC costs.
4. If the DC has inadequate levels of safety stock, then you would expect that increasing order flexibility would result in an increase in DC service levels, however in fact the opposite is true –
increasing order flexibility lowers DC service levels. 5. Safety stock levels at the RDC may need to be adjusted for different levels of flexibility. For instance, if the level of flexibility provided easily caters for the level of uncertainty in demand, then the safety stock held should be determined by the variability in demand. However, if the level of flexibility provided constrains the variability in demand, then the amount of safety stock held should be determined by the level of flexibility provided. Future Research
A beneficial next step would be to conduct a study that evaluates the sensitivities of the costs and benefits to a range of values for the remaining constants (e.g. holding costs, expedition costs, spoilage costs etc.) used in the model. Additionally, simulating a variety of demand patterns would be beneficial.
Now that some basic relationships between order flexibility, costs, and service levels are better understood, there is potential for developing a mathematical model which can define such relationships. A mathematical model could be especially helpful for determining an optimal order flexibility policy based on a given set of parameters. One of our findings from the real world data analysis was that the order flexibility policy appears to influence forecasting/order behaviour, even though this is an unintended consequence. For instance, Hong Kong DC tends to over forecast, and then place an order 30% less than what was forecasted (the lower limit of the policy). This may be an effect of human risk averseness, or some other aspect of human behavioural economics. More research could be done in this regard.