HAL Id: hal-02735846
https://hal-univ-rennes1.archives-ouvertes.fr/hal-02735846
Submitted on 30 Sep 2020
HAL is a multi-disciplinary open access
archive for the deposit and dissemination of
sci-entific research documents, whether they are
pub-lished or not. The documents may come from
teaching and research institutions in France or
abroad, or from public or private research centers.
L’archive ouverte pluridisciplinaire HAL, est
destinée au dépôt et à la diffusion de documents
scientifiques de niveau recherche, publiés ou non,
émanant des établissements d’enseignement et de
recherche français ou étrangers, des laboratoires
publics ou privés.
endoscopic images using a convolutional neural network
Gaoshuang Liu, Jie Hua, Zhan Wu, Tianfang Meng, Mengxue Sun, Peiyun
Huang, Xiaopu He, Weihao Sun, Xueliang Li, Yang Chen
To cite this version:
Gaoshuang Liu, Jie Hua, Zhan Wu, Tianfang Meng, Mengxue Sun, et al.. Automatic classification of
esophageal lesions in endoscopic images using a convolutional neural network. Annals of translational
medicine, AME Publishing Company, 2020, 8 (7), �10.21037/atm.2020.03.24�. �hal-02735846�
Page 1 of 10
Automatic classification of esophageal lesions in endoscopic
images using a convolutional neural network
Gaoshuang Liu1#, Jie Hua2#, Zhan Wu3,4, Tianfang Meng3,4, Mengxue Sun1, Peiyun Huang1, Xiaopu He1,
Weihao Sun1, Xueliang Li2, Yang Chen3,4,5
1Department of Geriatric Gerontology, 2Department of Gastroenterology, The First Affiliated Hospital of Nanjing Medical University, Nanjing 210029, China; 3Laboratory of Image Science and Technology, School of Computer Science and Engineering, Southeast University, Nanjing 211102, China; 4The Key Laboratory of Computer Network and Information Integration (Southeast University), Ministry of Education, Nanjing 211102, China; 5Centre de Recherche en Information Biomedicale Sino-Francais (LIA CRIBs), Rennes, France
Contributions: (I) Conception and design: J Hua, G Liu, X Li, W Sun; (II) Administrative support: X He, P Huang, Z Wu; (III) Provision of study
materials or patients: J Hua, M Sun, W Sun, Z Wu; (IV) Collection and assembly of data: G Liu, M Sun, X He, P Huang; (V) Data analysis and interpretation: T Meng; (VI) Manuscript writing: All authors; (VII) Final approval of manuscript: All authors.
#These authors contributed equally to this work.
Correspondence to: Weihao Sun. Department of Geriatric Gerontology, The First Affiliated Hospital of Nanjing Medical University, Guangzhou Road,
Nanjing 210029, China. Email: sunweihao2019@sina.com; Xueliang Li. Department of Gastroenterology, The First Affiliated Hospital of Nanjing Medical University, Guangzhou Road, Nanjing 210029, China. Email: lixueliang2019@sina.com; Yang Chen. Laboratory of Image Science and Technology, School of Computer Science and Engineering, Southeast University, Moling Street, Southeast University Road, Nanjing 211102, China; The Key Laboratory of Computer Network and Information Integration (Southeast University), Ministry of Education, Nanjing 211102, China; Centre de Recherche en Information Biomedicale Sino-Francais (LIA CRIBs), Rennes, France. Email: chenyang.list@seu.edu.cn.
Background: Using deep learning techniques in image analysis is a dynamically emerging field. This study aims to use a convolutional neural network (CNN), a deep learning approach, to automatically classify esophageal cancer (EC) and distinguish it from premalignant lesions.
Methods: A total of 1,272 white-light images were adopted from 748 subjects, including normal cases, premalignant lesions, and cancerous lesions; 1,017 images were used to train the CNN, and another 255 images were examined to evaluate the CNN architecture. Our proposed CNN structure consists of two subnetworks (O-stream and P-stream). The original images were used as the inputs of the O-stream to extract the color and global features, and the pre-processed esophageal images were used as the inputs of the P-stream to extract the texture and detail features.
Results: The CNN system we developed achieved an accuracy of 85.83%, a sensitivity of 94.23%, and a specificity of 94.67% after the fusion of the 2 streams was accomplished. The classification accuracy of normal esophagus, premalignant lesion, and EC were 94.23%, 82.5%, and 77.14%, respectively, which shows a better performance than the Local Binary Patterns (LBP) + Support Vector Machine (SVM) and Histogram of Gradient (HOG) + SVM methods. A total of 8 of the 35 (22.85%) EC lesions were categorized as premalignant lesions because of their slightly reddish and flat lesions.
Conclusions: The CNN system, with 2 streams, demonstrated high sensitivity and specificity with the endoscopic images. It obtained better detection performance than the currently used methods based on the same datasets and has great application prospects in assisting endoscopists to distinguish esophageal lesion subclasses.
Keywords: Esophageal cancer (EC); endoscopic diagnosis; convolutional neural network (CNN); deep learning Submitted Nov 11, 2019. Accepted for publication Feb 21, 2020.
doi: 10.21037/atm.2020.03.24
View this article at: http://dx.doi.org/10.21037/atm.2020.03.24
486
Introduction
Esophageal cancer (EC) is the seventh most common form of malignant tumor and the sixth leading cause of cancer-related deaths worldwide. Approximately 572,034 new EC cases and 508,585 EC-related deaths were recorded in 2018 (1). EC is known for its insidious onset, rapid progress, and poor prognosis. While diagnosing EC, the stage of cancer determines the prognosis of patients (2). The five-year survival rate of a patient with EC is 20.9% in its advanced stage and greater than 85% in the early stage (3,4). Therefore, early detection is necessary for improving patient survival rates.
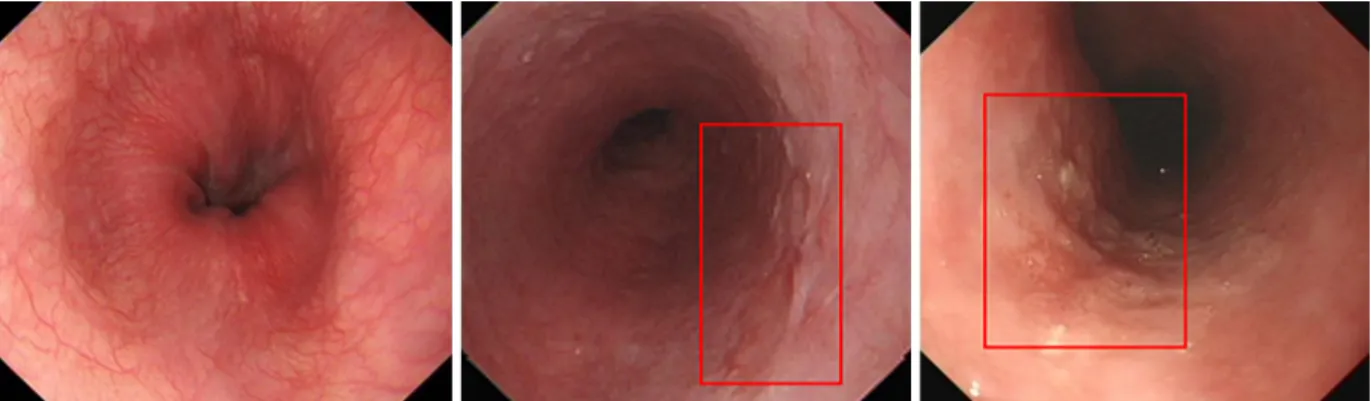
In recent decades, esophagogastroduodenoscopy with a biopsy has been the standard procedure for diagnosing EC, and the detection rate of EC has increased with the development of endoscopic technologies (5-7). Moreover, endoscopy can be used for observing premalignant lesions, such as intraepithelial neoplasia and atypical hyperplasia, which could progress to EC. Early detection and determining EC or premalignant lesions can lead to more effective targeted interventions. However, distinguishing between early EC and premalignant lesions is normally a challenging task because of their similar endoscopic features, such as mucosal erosion, hyperemia, and roughness (Figure 1).
Meta-analysis studies have shown that the endoscopic miss rate for upper gastrointestinal cancers is 11.3%, while 33 (23%) subjects with EC had undergone an endoscopy that failed to diagnose their cancers within 1 year before diagnosis (8,9). Moreover, around 7.8% of patients with EC fail to be diagnosed with conventional endoscopy, and most missed cases of EC are in the upper esophagus (5). However, a recent multicenter study found that missed EC accounted for only 6.4% of cases and was associated with a poor survival rate (10). Therefore, although the missed diagnosis rate of EC has decreased, to improve the survival rate of patients, endoscopists must receive long-term professional training and have the ability to detect EC properly.
In the past several years, computer vision-based techniques have been widely applied in the field of medical image classification and detection (11,12). Traditional machine learning models have been developed using prior data on the local features for automatic esophageal lesion diagnosis. However, the performance of many of these traditional methods is highly determined by the manually developed features (13-15). Recently, deep learning has been
at the forefront of computational image analysis (16-18). A convolutional neural network (CNN), a classical algorithm of deep learning, has been adopted to extract the local features of the edge texture in the lower layer and to abstract the high-dimensional features in the deep layer by simulating the recognition of the human visual system.
CNNs with self-learning abilities are an effective method in medical image classification, segmentation, and detection (17,18). Shichijo et al. (19) applied a deep learning AI-based diagnostic system to diagnose Helicobacter pylori infections, and Hirasawa et al. (20) detected gastric cancer by using a CNN model. Moreover, several studies have constructed computer-aided methods to analyze the real-time endoscopic video images of colorectal polyps (21-23). However, there are only a few studies on EC detection. Horie et al. (24) used CNN to detect EC with a positive predictive value (PPV) of 40%, which is lower than expected. Yang et al. (25) trained a 3D-CNN model with the PET image datasets to predict EC outcomes.
We aimed to propose a novel diagnostic method based on a CNN model that can automatically detect EC and distinguish it from premalignant lesions in endoscopic images.
Methods
Datasets and data preparation
Between July 2010 and July 2018, a total of 1,272 esophagus endoscopic images were collected from 748 patients from the First Affiliated Hospital of Nanjing Medical University, which is the best and biggest comprehensive hospital in Jiangsu, taking charge of four central roles for the whole province: medical treatment, medical teaching, scientific research, and hospital ethics activities. The imaging data consisted of 531 normal esophagus images, 387 premalignant images, and 354 EC images. Endoscopic images were captured by Olympus endoscopes (GIF-H260Z, GIF-Q260, GIF-Q260J, GIF-XQ260, GIF-H260, GIF-H260Q, GIF-XQ240, Japan). The inclusion criteria of this database are those images with available conventional white-light endoscopy, chromoendoscopy, and narrow-band imaging. The images with poor quality, including excessive mucus, foams, blurring, and active bleeding and images captured from patients who underwent esophageal surgery and endoscopic resection, were excluded. All images were marked manually by the author. In our study, ECs included adenocarcinoma and squamous cell carcinoma,
Annals of Translational Medicine, Vol 8, No 7 April 2020 Page 3 of 10
and precancerous lesions included low-grade dysplasia and high-grade dysplasia.
Data preprocessing
The esophageal images were rescaled to 512×512 through a bilinear interpolation method to reduce the computational complexity (26).
Brightness variation of the endoscopic esophageal images might lead to intraclass differences, which can affect the results of the proposed network. Therefore, instead of using the original endoscopic images, the following contrast-enhanced image was used as the inputs for the CNN.
[1]
(
)
( )
(
) ( )
I x, y;σ = αI x, y + βG x, y;ε * I x, y +γ′
where “*” represents the convolution operator, I(x,y) is the original endoscopic image, and G(x,y;ε) is a Gaussian filter with scale ε. The parameter values were empirically selected as α=4, β=−4, ε=512/20, and γ=128.
A large difference and a clear “boundary effect” were observed between the foreground and background of the images. Images were cropped to 90% to eliminate the boundary effect. The original and preprocessed images are shown in Figure 2.
Data augmentation
To overcome overfitting for our small-scale esophageal images, we adopted the following data augmentation measurements before training the network. In the training dataset, spatial translation of 0–10-pixel value in horizontal and vertical direction flipping and slight shifting between −10 and 10 pixels were employed (Figure 3).
CNNs
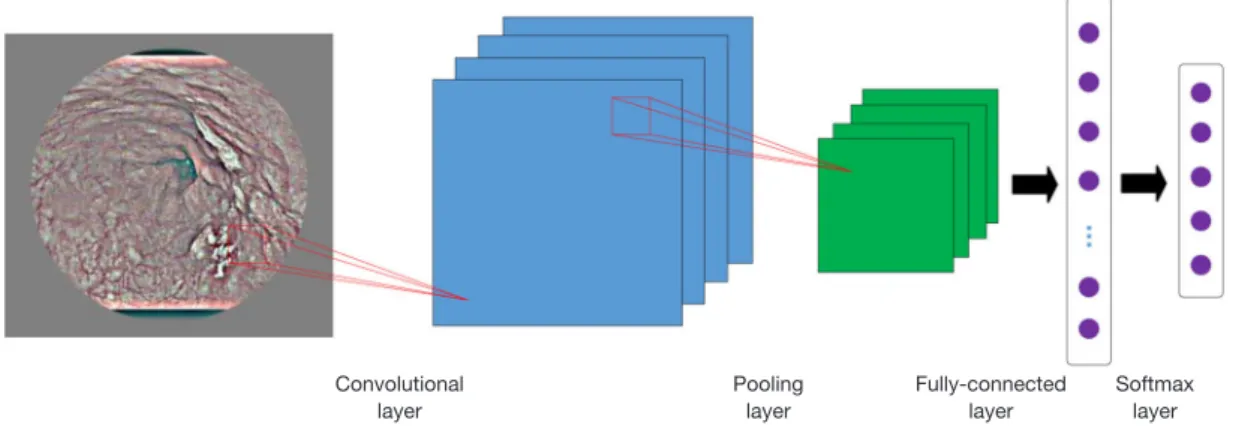
The basic CNNs consisted of 2 basic operational layers: the convolutional and pooled layers (Figure 4).
Figure 1 Sample images of three types using the CNN system. CNN, convolutional neural network. The red boxes indicate location of lesion.
The convolutional layer’s main function was to extract the features of the image information on the upper layer. Convolution operations use local perception and weight sharing to reduce parameters. The calculation formula of the convolution layer was as follows:
(
)
L L-1 L L
j j
x = f x * w +b [2]
where xL represents the feature map of the convolution
kernel in the L-th layer for input and j-th convolution kernel in the (L-1)-th layer for output, “*” represents convolution operation, L
j
w represents the bias of j-th convolutional kernel in the L-th layer, and f(*) represents activation function. In this study, the RELU activation function was often used to solve the gradient dispersion problem.
The pooling layer performed dimensionality reductions on an input feature map, reduced parameters, and retained the main feature information. The layer also improved the robustness of a network structure to transformations, such as rotation, translation, and stretching of images. The
calculation formula of the pooling layer was as follows: [3]
( )
(
1)
L L L- L j j j x = f β down x +bwhere down(∙) represents a down-sampling function, and β and b represent weight and bias, respectively. In this study, we selected average pooling, which is defined as the following:
(
m? m)
m m ab a=1 b=1down x = mean x
∑∑
[4] Fully connected layer FC(c): each unit of feature maps in the upper layer is connected with the c units of the fully connected layer. An output layer follows the fully connected layer.The Softmax layer was used to normalize the input feature values into the range of (0, 1) so that the output values ym represented the probability of each category.
The operation for the Softmax layer can be written as the following:
Figure 3 Data augmentation with flipping (B) and mirror (C) in the original image (A).
Figure 4 The exemplary architecture of the basic CNN. CNN, convolutional neural network.
A
B
C
Convolutional layer Pooling layer Fully-connected layer Softmax layerAnnals of Translational Medicine, Vol 8, No 7 April 2020 Page 5 of 10 1 m θ xm θ x m n m= e y = e
∑
[5] where ym is the output probability of the m-th class, θm is theweight parameter of the m-th class, n is the number of total class, and x represents the input neurons of the upper layer.
Construction of Two-stream CNN algorithm
A deep neural network structure called Inception-ResNet was employed to construct a reliable AI-based diagnostic system. The Inception-ResNet achieved the best results of the moment in the ILSVRC image classification benchmark in 2017 (27). The proposed structure consists of 2 streams: the O-stream and P-stream.
Inception networks can effectively solve the problem of computation complexity. The ResNet network can reduce the overfitting when the network becomes deeper. Inception-ResNet network combining the Inception network with the ResNet network achieves an improved performance on the test set of the ImageNet classification challenge (28). Figure 5 shows the basic structure of the Inception-ResNet module.
For clarity, HL(x) denotes the transformation of the Lth
building block. x is the input of the Lth building block,
and the desired output is FL(x). Residual block explicitly
forces the output to fit the residual mapping; that is, the
stacked nonlinear layers are forced to learn the following transformation:
( ) ( )
L L
F x =H x x−
[6] Therefore, the transformation for the Lth building block
is the following: ( ) ( )
L L
H x =F x x+
[7] The classic Inception-ResNet module consists of 1×1, 1×3, and 3×1 convolutional layers. The 1×1 convolutional layer is used to reduce channel number, and the 1×3, 3×1 convolutional layer is employed to extract spatial features.
Figure 6 demonstrates the O-stream and P-streams employing the same network structure to allow effective feature fusion. The O-stream inputs the original image and focuses on extracting the global features of the esophageal images. The P-stream inputs the preprocessed images and focuses on extracting the texture features of the esophageal image (Figure 6). The results of the proposed network and Figure 5 The basic structure of the Inception-ResNet module.
HL(x) FL(x) X Relu activation Relu activation + 1×1 Conv (2048 Linear) 3×1 Conv (256) 1×1 Conv (192) 1×3 Conv(224) 1×1 Conv (192)
Figure 6 Proposed two-stream structure. The Inception-ResNet is
used as the basic CNN structure. The input of the O-stream is the original image, and the input of the P-stream is the preprocessed image. CNN, convolutional neural network.
Original image 512 512 512 512 Input Training Classification Output
Normal Precancerous Lesion Cancer
Fusion Inception-ResNet-V2 Inception-ResNet-V2 P-str eam O-str eam Preprocessing image
the sub-streams for EC classification are presented in Table 1. The fusion of the 2 streams show the final results. For the proposed structure, the concatenation fusion is employed.
For clarity, we defined a concatenation fusion function: f, 2 feature maps a
t
x and b t
x , and a fusion feature map y, where xa∈RH W D× × , xb∈RH W D× × , and y R∈ H W D′× ×′ ′, and
where W, H, and D are the width, height, and the number of channels of the feature maps. The concatenation fusion method was described as follows:
Concatenation fusion y=fcat(xa,xb) stacks the 2 features at
the same location i, j across the feature channels d.
a i, j,d i, j,d y = x , b i, j,D+d i, j,d y = x [8] where y R∈ H W 2D× × . Learning parameters
The key to achieving promising results is training a model with the correct weight parameters, which influence the performance of the entire structure. In training, the weight
parameters of the proposed network are learned by using mini-batch stochastic gradient descent with a momentum set to 0.9. The 10 image batches are sent to the network with a weight decay of 0.0005. The base learning rate is set to 10−3, and the value is further dropped until the loss stops decreasing. The convergence range of the validation loss is 0.05–0.1, and the average validation accuracy after 10 k epochs was 0.8583 (Figure 7).
Experiments and validation parameters
The proposed approaches were implemented in the TensorFlow deep learning framework, which was run on a PC with NVIDIA GeForce GTX 1080Ti GPU (8 G) (NVIDIA CUDA framework 8.0, and cuDNN library).
For the elimination of contingencies in the classification results and to evaluate the performance of the proposed EC model, the results were quantitatively evaluated by 3 metrics; these were accuracy (ACC), sensitivity (SEN), and specificity (SPEC), and were defined as the following:
TP Sen = TP+ FP [9] TP Spec = FP+TN [10] TP+TN Acc = TP+TN + FP+ FN [11] where
True positive (TP) is the number of positive images correctly detected.
True negative (TN) is the number of negative images correctly detected.
False positive (FP) is the number of correctly detected wrongly as the esophagus images. False negative (FN) is the number of positive samples misclassified as negative.
In the evaluation phase, all the metrics were calculated Figure 7 Training curves of the proposed classification approach
on the EC database. EC, esophageal cancer.
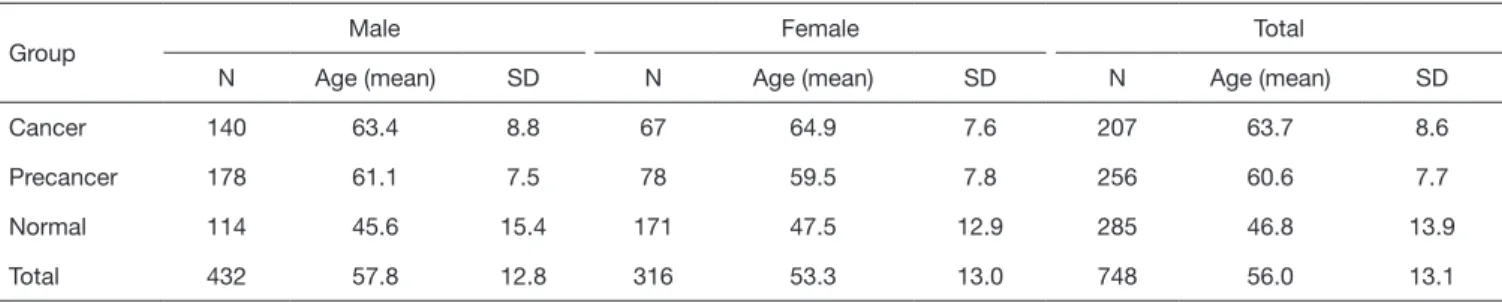
Table 1 Size and demographics of the study sample
Group Male Female Total
N Age (mean) SD N Age (mean) SD N Age (mean) SD
Cancer 140 63.4 8.8 67 64.9 7.6 207 63.7 8.6 Precancer 178 61.1 7.5 78 59.5 7.8 256 60.6 7.7 Normal 114 45.6 15.4 171 47.5 12.9 285 46.8 13.9 Total 432 57.8 12.8 316 53.3 13.0 748 56.0 13.1 Loss_Acc_Graph 0 20000 40000 60000 80000 100000 0.95 0.90 0.85 0.80 0.75 0.70 0.65 0.60 0.55 1.6 1.4 1.2 1.0 0.8 0.6 0.4 0.2 0.0 ACC Loss Loss ACC
Annals of Translational Medicine, Vol 8, No 7 April 2020 Page 7 of 10
based on the five-fold cross-validation results. The dataset was divided into the training (80%) and testing (20%) datasets, respectively.
The detailed data statistics distribution from the EC database is shown in Table 2.
Results
A total of 748 patients were included in this analysis. Table 1 presents the sizes and demographics of the database. Overall, no significant age difference was observed between males and females in each group. However, the normal control group was 15 years younger on average than the other two groups. Cancer and precancerous lesion groups had more males than females, both of which were around 60 years old.
The comparative results of the proposed network and sub-streams (the O-Stream and the P-Stream) in the database are listed in Table 3. This database contains all images, including those of the normal esophagus, precancerous lesions, and EC. And the results are the overall ACC, SEN, and SPEC of each methods. The O-stream focuses on exploiting the color and global features of the esophageal images, and its ACC
by itself was 66.93%. Using the preprocessed image as the input, the P-stream focuses on exploiting the textures and detailed features of the esophageal images, and the ACC of p-stream alone was 79.53%. The fusion of the two streams led to the best results of 85.83%.
Table 4 shows the ACC of each category in the EC database based on the proposed network. The normal type was easier to identify probably because the amount of data in the normal type was greater than the other two types.
Figure 8 presents the confusion matrix for the EC database. In the confusion matrix, the diagonal values are the A of each category classification, and the others are the confusion degrees between the two categories. This method diagnosed 74 total lesions as esophageal lesions (the precancerous lesion or cancer); 3 were normal cases with a PPV of 95.94% and a negative predictive value (NPV) 92.45%. The PPV and the NPV of EC were 87.09% and 91.67%, respectively. The accuracy of the cancer category was 77.14%, which implies that it is easy to confuse EC with the precancerous lesions.
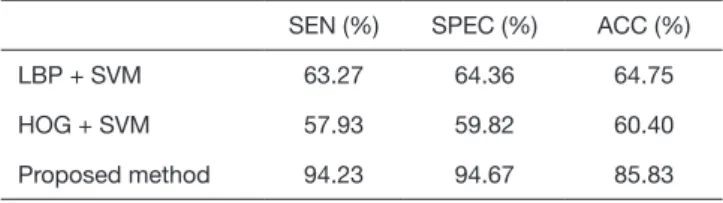
Table 5 demonstrates a comparison made between the method we proposed and the methods of LBP+SVM and HOG+SVM using the same dataset. The total sensitivity, specificity, and accuracy of our method were 94.23%, 94.67%, and 85.83%, respectively, which are higher than those of the other methods.
Discussion
Endoscopy plays a crucial role in the diagnosis of EC, Table 2 Statistics distribution from EC database
Images Normal Precancerous lesion Cancer
Train 1,017 424 310 283
Validation 126 53 38 35
Test 129 54 39 36
EC, esophageal cancer.
Table 3 Results of the proposed network and the sub-streams in the
EC database
SEN (%) SPEC (%) ACC (%)
O-Stream 98.08 85.33 66.93
P-Stream 96.15 88.00 79.53
Proposed structure 94.23 94.67 85.83 EC, esophageal cancer; SEN, sensitivity; SPEC, specificity; ACC, accuracy.
Table 4 Results of the proposed network in the EC database
Normal Precancerous lesion Cancer
ACC 94.23% 82.50% 77.14%
EC, esophageal cancer; ACC, accuracy.
Figure 8 Confusion matrix of the proposed structure in EC
database. EC, esophageal cancer.
Confusion matrix 49 33 27 2 1 3 4 0 8
Normal Precancer Cancer
Predicted label 40 30 20 10 0 Normal Precancer Cancer True label
which is the sixth leading cause of cancer-related death (1). However, diagnosing EC at an early stage by endoscopy is difficult and requires experienced endoscopists. An alternative method for EC classification is done by using a deep leaning method. It is more helpful and has been applied in various fields, such as computer vision (29) and pattern recognition (30). The application of deep learning methods achieves complex function approximation through a nonlinear network structure and shows powerful learning abilities (31). Compared with traditional recognition algorithms, deep learning combines feature selection methods or extraction and classifier determination methods into a single step and can study features to reduce the manual design workload (32).
The CNN model is one of the most important deep learning models for computer vision and image detection. In the most recent study, Hirasawa et al. achieved the automatic detection of gastric cancer in endoscopic images by using a CNN-based diagnostic system and obtained an overall sensitivity of 92.2% and a PPV of 30.6% (20). Sakai et al. proposed a CNN-based detection scheme and achieved high accuracy in classifying early gastric cancer and normal stomach (33). Our study has developed a CNN-based framework to classify esophageal lesions with an overall accuracy of 85.83%. The images were preprocessed first, then the features of the image information were extracted and annotated manually; finally, these images were used for training the CNN model. This model was applied to distinguish normal esophagus, premalignant lesions from EC.
According to our study, the trained network achieved an accuracy of 85.83%, a sensitivity of 94.23%, and a specificity of 94.67% with the fusion of the 2 streams. The accuracy rates of classifying normal esophagus, premalignant lesions, and EC were 94.23%, 82.5%, and 77.14%, respectively. LBP+SVM and HOG+SVM methods are classical machine learning methods. Compared with them, the system we
presented achieved better results. Therefore, the CNN system we proposed can easily distinguish whether samples suffer from esophageal lesions. In some cases, however, there were some discrepancies between EC and precancerous esophageal lesions. For instance, 85% of the lesions diagnosed by the CNN as premalignant lesions were EC. The most probable reason for misdiagnosis was that cancerous lesions were extremely localized in the precancerous lesions, and their surface characteristics were not obvious. Some other reasons may include the fact that the cancer was hard to detect on the surface or the poor angle at which the image was taken.
The main contributions of this paper are twofold. First, the esophageal endoscopic database was built. The database included 1,272 endoscopic images, which consisted of 3 types of endoscopic images (normal, premalignant, cancerous). Each image in this database had a classification label. Secondly, we presented a two-stream CNN that can automatically extract global and local features from endoscopic images.
The significant strength of the study was that our proposed two-stream CNN consisted of 2 subnetworks (O-stream and P-stream). The original images were input with the O-stream to extract the colors and global features, and the pre-processed esophageal images were input with the P-stream to extract the texture and detail features. Advanced Inception-ResNet V2 was adopted as our CNN framework. Finally, two-stream CNN effectively extracted the two-stream feature and achieved promising results.
This study had some limitations. First, the detection of EC was based on images in white light view only. Designing a universal detection system with images under more views, such as NBI and chromoendoscopy using indigo carmine, is possible. Second, our sample size was small, and we obtained all endoscopic images from a single center. The type of endoscopy and its image resolution are highly variable across different facilities. Therefore, we will obtain endoscopic images from other centers and use other types of endoscopy in future research. Third, the anatomical structure of the squamocolumnar junction was also misdiagnosed as EC, which is unlikely to be misdiagnosed by endoscopists. If CNNs can have more systematic learning about the normal anatomical structures and various lesions, the accuracy of EC detection will improve in the future.
In future studies, we will add the precise location of lesion areas and video analysis to allow for real-time computer-aided diagnosis of esophageal tumors.
Table 5 Comparison of the proposed network with other methods
SEN (%) SPEC (%) ACC (%)
LBP + SVM 63.27 64.36 64.75
HOG + SVM 57.93 59.82 60.40
Proposed method 94.23 94.67 85.83 SEN, sensitivity; SPEC, specificity; ACC, accuracy; LBP, Local Binary Patterns; SVM, Support Vector Machine; HOG, Histogram of Gradient.
Annals of Translational Medicine, Vol 8, No 7 April 2020 Page 9 of 10
Conclusions
We constructed a CNN system to classify EC and premalignant lesions with high accuracy and specificity. The system distinguished early EC from premalignant lesions and was able to increase the detection rate of early EC. Our method showed better detection performance than other detection methods. In the future, the burden of endoscopists can be reduced, and the difficulties of the shortage of professionals in primary hospitals can be alleviated.
Acknowledgments
Funding: This research was supported by the Jiangsu Science and Technology Department Basic Research Program of the Natural Science Foundation [No. BK20171508 (DA17)].
Footnote
Conflicts of Interest: All authors have completed the ICMJE uniform disclosure form (available at http://dx.doi. org/10.21037/atm.2020.03.24). The authors have no conflicts of interest to declare.
Ethical Statement: The authors are accountable for all aspects of the work in ensuring that questions related to the accuracy or integrity of any part of the work are appropriately investigated and resolved. The study was approved by the Ethics Committee of the First Affiliated Hospital of Nanjing Medical University (No. 2019-SR-448). Informed consent for upper gastrointestinal endoscopy (UGE) was obtained in all cases.
Open Access Statement: This is an Open Access article distributed in accordance with the Creative Commons Attribution-NonCommercial-NoDerivs 4.0 International License (CC BY-NC-ND 4.0), which permits the non-commercial replication and distribution of the article with the strict proviso that no changes or edits are made and the original work is properly cited (including links to both the formal publication through the relevant DOI and the license). See: https://creativecommons.org/licenses/by-nc-nd/4.0/.
References
1. Bray F, Ferlay J, Soerjomataram I, et al. Global cancer statistics 2018: GLOBOCAN estimates of incidence and
mortality worldwide for 36 cancers in 185 countries. CA Cancer J Clin 2018;68:394-424.
2. Hu Y, Hu C, Zhang H, et al. How does the number of resected lymph nodes influence TNM staging and prognosis for esophageal carcinoma? Ann Surg Oncol 2010;17:784-90.
3. Janurova K, Bris R. A nonparametric approach to medical survival data: Uncertainty in the context of risk in mortality analysis. Reliab Eng Syst Safe 2014;125:145-52. 4. Lee JS, Ahn JY, Choi KD, et al. Synchronous second
primary cancers in patients with squamous esophageal cancer: clinical features and survival outcome. Korean J Intern Med 2016;31:253-9.
5. Chadwick G, Groene O, Hoare J, et al. A population-based, retrospective, cohort study of esophageal cancer missed at endoscopy. Endoscopy 2014;46:553-60.
6. Li J, Xu R, Liu M, et al. Lugol Chromoendoscopy Detects Esophageal Dysplasia With Low Levels of Sensitivity in a High-Risk Region of China. Clin Gastroenterol Hepatol 2018;16:1585-92.
7. Khalil Q, Gopalswamy N, Agrawal S. Missed esophageal and gastric cancers after esophagogastroduodenoscopy in a midwestern military veteran population. South Med J 2014;107:225-8.
8. Menon S, Trudgill N. How commonly is upper gastrointestinal cancer missed at endoscopy? A meta-analysis. Endosc Int Open 2014;2:46-50.
9. Visrodia K, Singh S, Krishnamoorthi R, et al. Magnitude of Missed Esophageal Adenocarcinoma After Barrett's Esophagus Diagnosis: A Systematic Review and Meta-analysis. Gastroenterology 2016;150:599-607. e7; quiz e14-5.
10. Rodríguez de Santiago E, Hernanz N, Marcos-Prieto HM, et al. Rate of missed oesophageal cancer at routine endoscopy and survival outcomes: A multicentric cohort study. United European Gastroenterol J 2019;7:189-98. 11. Yan H. Computer Vision Applied in Medical Technology:
The Comparison of Image Classification and Object Detection on Medical Images. Proceedings of the 2018 International Symposium on Communication Engineering & Computer Science (CECS 2018), 2018:98-103.
12. Fritscher K, Raudaschl P, Zaffino P, et al. Deep Neural Networks for Fast Segmentation of 3D Medical Images. Medical Image Computing and Computer-Assisted Intervention, 2016:158-65.
13. Kage A, Münzenmayer C, Wittenberg T. A Knowledge-Based System for the Computer Assisted Diagnosis of Endoscopic Images. Bildverarbeitung für die Medizin
2008:272-6.
14. Van der Sommen F, Zinger S, Schoon EJ, et al. Supportive automatic annotation of early esophageal cancer using local gabor and color features. Neurocomputing 2014;144:92-106. 15. de Souza L, Hook C, Papa JP, et al. Barrett’s esophagus
analysis using SURF features. Bildverarbeitung für die Medizin: Springer, 2017:141-6.
16. Suzuki K. Overview of deep learning in medical imaging. Radiol Phys Technol 2017;10:257-73.
17. Shin HC, Roth HR, GaoM, et al. Deep convolutional neural networks for computer-aided detection: CNN architectures, dataset characteristics and transfer Learning. IEEE Trans Med Imaging 2016;35:1285-98.
18. Yamashita R, Nishio M, Do RKG, et al. Convolutional neural networks: An overview and application in radiology. Insights Imaging 2018;9:611-29.
19. Shichijo S, Nomura S, Aoyama K, et al. Application of convolutional neural networks in the diagnosis of Helicobacter pylori infection based on endoscopic images. EBioMedicine 2017;25:106-11.
20. Hirasawa T, Aoyama K, Tanimoto T, et al. Application of artificial intelligence using a convolutional neural network for detecting gastric cancer in endoscopic images. Gastric Cancer 2018;21:653-60.
21. Byrne MF, Chapados N, Soudan F, et al. Real-time differentiation of adenomatous and hyperplastic diminutive colorectal polyps during analysis of unaltered videos of standard colonoscopy using a deep learning model. Gut 2019;68:94-100.
22. Komeda Y, Handa H, Watanabe T, et al. Computer-aided diagnosis based on convolutional neural net-work system for colorectal polyp classification: Preliminary experience. Oncology 2017;93:30-4.
23. Zhang R, Zheng Y, Mak TWC, et al. Automatic detection and classification of colorectal polyps by transferring
low-level CNN features from nonmedical domain. IEEE J Biomed Health Inform 2017;21:41-7.
24. Horie Y, Yoshio T, Aoyama K, et al. Diagnostic outcomes of esophageal cancer by artificial intelligence using convolutional neural networks. Gastrointest Endosc 2019;89:25-32.
25. Yang CK, Yeh JY, Yu WH, et al. Deep convolutional neural network-based positron emission tomography analysis predicts esophageal cancer outcome. J Clin Med 2019;8:844.
26. Chen G, Clarke D, Giuliani M, et al. Combining unsupervised learning and discrimination for 3D action recognition. Signal Process 2015;110:67-81.
27. Szegedy C, Ioffe S, Vanhoucke V, et al. Inception-v4, inception-ResNet and the impact of residual connections on learning. Thirty-First AAAI Conference on Artificial Intelligence, 2017:4278-84.
28. Wu Z, Shen C, Hengel AVD. Wider or deeper: Revisiting the ResNet model for visual recognition. Pattern Recognit 2019;90:119-33.
29. Zhang J, Luo HB, Hui B, et al. Image interpolation for division of focal plane polarimeters with intensi-ty correlation. Optics Express 2016;24:20799-807.
30. Bengio Y. Learning deep architectures for AI. Foundations and Trends® In Machine Learning 2009:1-127.
31. LeCun Y, Bengio Y, Hinton G. Deep learning. Nature 2015;521:436-44.
32. Arel I, Rose D, Coop R. DeSTIN: A scalable deep learning architecture with application to high-dimensional robust pattern recognition. AAAI Fall Symposium: Biologically Inspired Cognitive Architectures 2009:11-5.
33. Sakai Y, Takemoto S, Hori K, et al. Automatic detection of early gastric cancer in endoscopic images using a transferring convolutional neural network. Conf Proc IEEE Eng Med Biol Soc 2018;4138-41.
Cite this article as: Liu G, Hua J, Wu Z, Meng T, Sun M, Huang P, He X, Sun W, Li X, Chen Y. Automatic classification of esophageal lesions in endoscopic images using a convolutional neural network. Ann Transl Med 2020;8(7):486. doi: 10.21037/atm.2020.03.24