HAL Id: hal-01346455
https://hal.archives-ouvertes.fr/hal-01346455
Submitted on 19 Jul 2016
HAL is a multi-disciplinary open access archive for the deposit and dissemination of sci-entific research documents, whether they are pub-lished or not. The documents may come from teaching and research institutions in France or abroad, or from public or private research centers.
L’archive ouverte pluridisciplinaire HAL, est destinée au dépôt et à la diffusion de documents scientifiques de niveau recherche, publiés ou non, émanant des établissements d’enseignement et de recherche français ou étrangers, des laboratoires publics ou privés.
Photodissociation UV-VIS spectra of cold protonated
azobenzene and 4-(dimethylamino)azobenzene and their
benzenediazonium cation fragment
Géraldine Féraud, Claude Dedonder-Lardeux, Christophe Jouvet, Ernesto
Marceca
To cite this version:
Géraldine Féraud, Claude Dedonder-Lardeux, Christophe Jouvet, Ernesto Marceca. Photodissociation UV-VIS spectra of cold protonated azobenzene and 4-(dimethylamino)azobenzene and their benzene-diazonium cation fragment. Journal of Physical Chemistry A, American Chemical Society, 2016, 120 (3897), �10.1021/acs.jpca.6b03505�. �hal-01346455�
Reprinted with permission from The Journal of Physical Chemistry A. Copyright 2016 American Chemical Society
J. Phys. Chem. A, 2016, 120 (22), pp 3897–3905
Photodissociation UV-VIS spectra of cold protonated azobenzene and
4-(dimethylamino)azobenzene and their benzenediazonium cation fragment
GéraldineFéraud †a; ClaudeDedonder-Lardeuxa; ChristopheJouveta,Ernesto Marcecab*a)
CNRS, Aix-Marseille Université, PIIM UMR 7365, Avenue Escadrille Normandie-Niémen, 13397 Marseille Cedex 20, France
b)
INQUIMAE-FCEN, UBA, Ciudad Universitaria, 3er piso, Pabellón II, 1428 Buenos Aires, Argentina
† Present address: LERMA, Sorbonne Universités, UPMC Univ. Paris 06, Observatoire de Paris, PSL Research University, CNRS, F-75252, Paris, France
*corresponding author :marceca@qi.fcen.uba.ar
Abstract:
Gas phase photodissociation electronic spectra of protonated azobenzene (ABH+) and 4-(dimethylamino)azobenzene (dmaABH+) were measured in a cryogenically-cooled ion trap at temperatures of a few tens of Kelvin. Experimental results were complemented with electronic structure calculations in the ground state at the MP2/cc-pVDZ level of theory, and in the low lying excited states using the RI-CC2 method. Calculated energies revealed that only the trans isomers of the azoniummolecular ions (protonation site on the azo group) will likely exist in the trap at the temperatures achieved in the experiment. The first transitionof
trans-ABH+was found ππππ* in character, and the absorption band in the spectrum appears strongly red-shifted from that of the neutral molecule.The calculations showed that upon excitation the quasi-planar ground state (S0)transforms into a chair-like excited state (S1) by
twisting the CNNC dihedral angle about 96 degrees. A 41 cm1 active vibrationalprogression found in the ABH+ spectrum may be associated with the twisting of the azo bond. Conversely,
the electronic spectrum of dmaABH+exhibits a steep and unstructured S1S0absorption
corresponding to a less distorted S1 state. The next two quasi-degenerate bands in the
ABH+spectrum evidence sharper onsets and a charge transfer character. Using a second fragmentation laser and an additional He cooling pulse in the trap, it was possible to measure the UV spectrum of cold benzenediazoniumfragments.
1. Introduction:
In the electronic ground state, azobenzene(C6H5N=NC6H5, hereafter denoted
AB)can adopt cis and trans configurationsdefined by the relative orientation of the two phenyl rings attached to the azogroup, the transisomer being approximately 0.6 eV1 more stable than the cis one,and the transcis isomerization barrier in the gas phase isabout 1.1 eV.2It is well known3,4 that transcis isomerizationof AB takes place in the electronic excited statewhen
the molecule is excited at 365 nm, whereas the reverse reaction can be thermally activated in the ground state (in the dark, thehalf-life of cis-AB in solution is several hours, at room temperature) or induced photochemicallyby irradiation at 420 nm (lifetime in the ps scale).5The photoisomerization mechanism of AB remains a matter of debate despite many years of experimental6,9 and theoretical10,13studies. These results have been interpreted in terms of the contribution of two basic pathways that can in principle take place depending on the excitation scheme used: an inversion mechanism involving an in-plane bending of the azo-ring bonds and an out-of-plane rotation of the NN double bond.The advantageous photochromic properties of AB and its derivative compounds, as well as the ease of attaining optical controlof the switching process between twophotostable states, motivated researchconcerning the use of these moleculesas molecular devices. A wide variety of complex molecular systems functionalized with ABs that exhibit phototriggerableoptical, mechanical and functional changes have been reviewed in the last years.14,17
When dissolved in strong acidic aqueous solutions, ABscan attach a hydrogen ionto a free electron pair in the azo group forming azonium ions (see Scheme 1a for the particular case of protonated trans-azobenzene, denoted trans-ABH+). In azonium ions the positive charge is delocalized by resonance in the aromatic system, lowering the energy of the * level. As a result, the * absorption band of trans-ABH+is shifted 100 nm to the red with respect to the same transition of AB.18
The introduction of additional functional groups on the phenyl rings of AB can dramatically alter the absorption spectra and the photochemical properties. Aminoazobenzenesare of particular interest because these molecules are known to experience tautomeric equilibria in solution, as a result of their multiple protonation sites, and therefore significant pH dependence in their optical absorption spectra.In acidicsolutions, protonated aminoazobenzenes (denoted aABH+s)may form azonium or ammoniumions depending,respectively, on whether the hydrogen ion is attached to the azoor the amino group. See Scheme 1b for the particular case of protonated trans-4-(dimethylamino)azobenzene (denoted trans-dmaABH+).There are two possible structures for theazonium tautomer, depending on the protonation site, indicated in Scheme 1b as (I) when the H atom is next to the unsubstituted ring and (II) when it is attached to the other nitrogen atom. The positive charge in the azoniumform (I) is easily delocalizedon the aminosubstituted aromatic ring by formation ofa quinoid structureand, consequently,the NN bond adopts a hydrazone character. On the other hand, the ammonium tautomer localizes the positive charge on the sp3 nitrogen atom, preserving the azo character of the NN bond.The equilibrium between aABH+sazonium and ammonium ions in liquid solutionhas been extensively studied19,20on account of the distinct UV-VIS absorption spectrum of the different tautomers: i) the visible absorption at max500 nm is assigned to the * transition of azonium ions, which is supported by the high
electronic delocalization in the molecule, and ii) the UV band appearing at max320
nmisattributed to the ammonium ions,because this type of tautomer is expected to have a spectrum similar to that of the neutral AB molecule (max321 nm).18
Scheme 1.a) Azonium form of protonated trans-azobenzene (trans-ABH+). b) Azonium forms (I) and (II), and ammonium form of protonated trans-4-(dimethylamino)azobenzene (trans-dmaABH+).Molecular ions studied in the present paper are underlined.
Protonated azo compounds show faster cistransthermal isomerization rates, which
has been explainedin terms of a weaker double bond character of the azo bonddue to the strong electron withdrawing effect of the positive charge introduced in the molecule upon protonation.20,21The possibility of modulating the activation barrier for the cistrans
reactionofazo compounds by triggering the local pH has been proposed in the literature19,20 as an additional means of controlling a photodevice.
In spite of the abundant research available in the literature on the structural and photophysical properties of protonated azo compounds, no experimental studies have been performed in the gas phase for these molecular ions. Spectroscopic information about isolated ABH+ and aABH+s will contribute to clarify the assignments of the bands observed in solution by working in a solvent-free environment, allowing a more reliable comparison of
azoniumform of trans-dmaABH+ (I)
ammoniumform of trans-dmaABH+ azoniumform of trans-ABH+
a)
b)
the experimental data with the calculations. Moreover, an additional advantage of probing isolated ions at very low temperatures in the gas phase is the very low possibility that intramolecular proton transfer reactions take place. Therefore, structural details as the protonation site22 in the molecule and the flexibility of the molecular structure upon excitation will also be attainable from the gas phase spectra of the cold ions complemented with ab initio calculations.
In this work we have measured theUV-VIS spectra of isolated cold ABH+anddmaABH+ ions via photofragmentation spectroscopy. The ions were prepared and cooled down to few tens of Kelvin into a cryogenic ion trap. Under these conditions and according to ab initio calculations both molecules are protonated on the azo group (azoniumtautomer) and the ions adopt a non-planar configuration (see text).We have also recorded the UV-VIS spectrum of the benzenediazonium cation (C6H5N2+, denoted BD+) one
the most abundant photofragments generated from the studied protonated azocompounds. This cation is a fundamental reaction intermediatewith well-known applications to the dye industry, andfor which UV-VIS spectroscopic characterization is scarce.
2. Methods:
The experimental set-up has been described in detail in earlier work.23,24 Here,we will present a brief summary of the main components of the apparatus and give a short explanation of the technique used to prepare the ions and record the photofragmentationelectronic spectra.The protonated parent ion (ABH+ or dmaABH+) is producedin an electrospray source from a solution of water/methanol (1:1 in volume) at a concentration of 0.1mM, containing a trace of acetic acid. The ions formed in the source are injected in a cryogenically-cooled Paul trap through a mass gate. It takes several tens of milliseconds to cool down the ions to a temperature of about 40 K by collisions withcold He atoms pulsed into the trap. After this time, a first laser pulse is triggered and photodissociation of the cold parent ions takes place. Ionic fragments as well as the remaining parent ions can be extracted from the trap, mass-analyzed in a time of flight (TOF) mass spectrometer and their intensities quantified as a function of the laser wavelength. In addition, the ion fragments can be cooled down by introducing a second He pulse in the trap 1 ms after the fragmentation laser pulse, and probed by a second laser pulse triggered after a delay of some tens of milliseconds. Well resolved
electronic spectra of cold daughter ions can be obtained in this way.In order to ensure proper cooling conditions in the trap (product ion temperatures as low as those of parent ions, namely
T<40 K), a solution ofbenzylaminewasoccasionally electrosprayed in the sourceand the
absence of vibrational hot bands in the benzylium ion (m/q = 91) spectrum (produced by photofragmentation of protonated benzylamine) was verified.One or more specific photofragments can be removed from the ion trap by exciting their axial micromotionapplying specific auxiliarydipolar radiofrequencies, according to a procedure recently implemented in the set-up.25
Two optical parametric oscillator lasers(EKSPLA model-NT342B) were used in the experiments, operating at a 10 Hz repetition rate and having 8 cm−1of spectral resolution and a scanning step of0.02 nm. The lasers were focused to a 2 mm2 spot in the trapand the laser power was roughly 5 mW.
Abinitio calculations were carried out with the TURBOMOLEprogram package,26 making use of the resolution-of-the-identity(RI) approximation in order to evaluate the electron-repulsionintegrals. Ground state (S0) equilibrium geometries of protonated species
were optimized at the MP2 (second order Møller–Plesset perturbation)level of theory using the cc-pVDZ(correlation-consistentpolarized valence double-zeta) basis set. Vertical excitation energies, oscillator strengths and equilibrium geometry of the lowestexcited singlet stateswere computed atthe CC227(second order Approximate Coupled Cluster) level, since standard time-dependent DFT (Density Functional Theory) is well-known to produce substantial errors in representing charge transfer (CT) excited states.28Moreover, we have chosen the RI-CC2 method because it proved useful in describing the electronic transitions of similar aromatic ions with nitrogen functional groups.29,30In all the calculations the starting geometries had Cs symmetry and were constrained to distinguish between π or orbitals and A' or A'' excited states. In the case of the benzenediazonium ion fragment, adiabatic excitation energies were calculated in addition to the vertical excitation values. For doing this, the energiesof the ground and the first two excited states were computed for the optimized S1(A')
and S2(A') excitedstategeometries,in Cs symmetry. Additional excited stateoptimizations were
performed for this system and protonated azobenzene, relaxing the condition of maintaining Cs symmetry and allowing non-planar geometries.
3. Results:
3.1 Electronic spectra of ABH+ and dmaABH+ parent ions
Fig. 1a shows the difference mass spectrum (in presence and in absence of the fragmentation laser) obtained upon photodissociationof the parent ion ABH+(m/q = 183, negative peak) at 384.0 nm.The two most abundant ion fragments (positive peaks) correspond to the phenyl cation (m/q = 77), formed by heterolytic cleavage of the C–Nbond between one of the aromatic rings and the azo group, and BD+ (m/q = 105), formed by loss of benzene (B).The CID mass spectrum31at low fragmentation energy also yields the phenyl cation as the main fragment, followed by BD+ which is about 5 times less intense.
Figure 1. a) Difference mass spectrum (fragmentation laser on laser off) of ABH+ (m/q = 183, negative peak) at = 384.0 nm. Ion fragment signals (positive peaks) at m/q = 77 and 105 correspond respectively to phenyl and BD+ cations. b) Photodissociationelectronic spectra of ABH+ obtained from m/q = 77 and 105 mass channels. The absorption starts at =480.3 nm (m/q = 77 spectrum) and exhibits a vibrational progression, zoomed in the inset at a higher spectral resolution. Loss of benzene from ABH+ to yield BD+ (m/q = 105spectrum) is restricted to the wavelength range 300410 nm.c) Electronic spectrum of the conjugated acid of AB in strongacid solution (bulk).18
a)
b)
15
20
25
30
35
m/q = 77 parent ion: m/q=183 m/q = 105TOF (
s)
250 300 350 400 450 500 550 600 474 480 acid solution excitation wavelength (nm) m/q = 77 m/q = 105 m/q = 77 4 8 0 .3 n mc)
Photodissociationelectronic spectra of ABH+are given in Fig. 1b for the mass channels
m/q = 77 and 105. The absorption starts at = 480.3 nm for the spectrumrecorded on m/q =
77 evidencing 3 additional electronic transitions: two sharp bands starting at = 407.6 nmand = 389.9 nm, and an UV band starting at =263.3 nm.Both visible and UV absorptions are also present in the spectrum of the conjugated acid of AB measured in an ethanol-water solution having 65% sulfuric acid18(Fig. 1c).
The first excited state exhibits a low frequency vibrational progressionin the vicinity of the band origin that can be analyzed in terms of a 41 cm1 active mode starting most likely at wavelengths 480.3 nm and 479.8 nm (FWHM of peaks = 12 cm1 ).In the inset of Fig. 1b there is a zoomed view of this spectral region where the laser was scanned in 0.02 nm steps to achieve the maximal spectral resolution. The transition starting at = 480.3 nm is very weak and cannot be straightforwardly assigned to the 00 transition. The absence of a strong 00transition implies a largechange in geometry in the excited state, as it will be discussed later.The second spectrum in Fig. 1b reveals that at = 410 nm a new fragmentation channel opens with the production of BD+ and then closes at about = 300 nm.In Scheme 3 we propose a mechanism for this fragmentation channel in the excited state, which involves a charge transfer in the molecule followed by an Hatom migration.
Photodissociation difference mass spectrum of dmaABH+ (m/q = 226) at = 275.0 nm is given in Fig. 2a. As in the case of ABH+, phenyl (m/q = 77) and benzenediazonium (m/q = 105) cations are the main photofragments, followed by the dimethylaminophenyl cation (m/q = 120) and other minor fragments. Phenyl and dimethylaminophenyl cations likely originate from heterolytic cleavage of the C–N bond at both sides of the azo group, while BD+ forms by loss of benzene.In contrast to what is observed for ABH+, the photoproduct branching ratio of dmaABH+ is invariant as a function of the excitation wavelength and, therefore, the photodissociation electronic spectra in the Fig. 2b results from adding up the signal from all mass channels.
Figure 2. a) Difference mass spectrum (fragmentation laser on laser off) of dmaABH+ (m/q = 226, negative peak) at = 275.0 nm. Ion fragment signals (positive peaks) at m/q = 77, 105 and 120 correspond respectively to phenyl,BD+and dimethylaminophenylcations. b) The photodissociation electronic spectra of dmaABH+is the same for all fragment mass channels (m/q77,105 and120) and,therefore, we present the sum of all of them. The absorption starts at =558.3 nm, and the band rising is zoomed in the inset.c) Electronic spectrum of the conjugated acid of dmaAB in acid solution (bulk).19
The electronic spectrum of dmaABH+exhibits a two-band system, one in the visible and the other in a spectral range given by = 240360 nm.Considering the width of the bands it remains uncertain how many electronic states are involved in the absorption spectrum.The visible absorption of this ion is shifted about 80 nm to the red in comparison to ABH+ (the band starts at = 558.3 nm), which is a direct consequence of the extended conjugation caused by the presence of the electron-donating dma group.The absorption spectrum of a solution of dmaABH+ in acidulated acetonitrile19 is shown in Fig. 2cfor comparison.
The absorption bands of dmaABH+ are found broad and do not exhibit a sharp vibrational structure,in contrast to the ABH+ spectrum. This is shown in the inset of Fig. 2.b
15 20 25 30 35 parent ion: m/q=226 m/q = 120 m/q = 105 m/q = 77 Y Axi s T itl e TOF (s)
a)
b)
c)
250 300 350 400 450 500 550 600 excitation wavelength (nm) acid solution all fragments 550 554 558 all fragmentswhere the onset of the visible band origin was scanned with a higher resolution. Although the onset of the band at =558.3 nmdoes not appear to be a well-defined00 transition, the absorption rises moresteeply (within 50cm1) than in the case ofABH+, as evidenced by comparing the low-energy parts of ABH+ and dmaABH+ spectra plotted in Fig. 3.It is not clear whether the broadened spectrum ofdmaABH+ is originating fromvery low vibrations or from lifetime broadening, which wouldreveal that the excited state is relatively short-lived as it was found in protonated DNA bases.32By using a multi-Lorentzian fit,a FWHM of 70 cm1can be determined for the two bands in the inset of Fig. 2.b, which accounts for an excited state lifetime of about 50 fs,ifthe broadening is exclusively limited bythe lifetime.
Figure 3. Low-energy part (350 wavenumbers) of ABH+ and dmaABH+spectra normalized by the corresponding absorption band maxima.
3.2Electronic spectrum of the DB+ fragment
20800 20900 21000 21100
17900 18000 18100 18200
wavenumber (cm-1) dmaABH+
Photolysis of benzenediazonium salts in solution is known33 to occur principally via dissociative loss of molecular nitrogen,giving the corresponding phenyl cationas primary product. Likewise, the photofragmentation mass spectrum of isolated BD+ ions provides clear evidence for the formation of phenyl cations upon absorption of UV light. BD+ ions produced in the trapby photodissociation of ABH+at = 384 nm were cooled down to T< 40 K before making use of a second laser to record the electronic spectrum.As an example, we present in Fig. 4 two mass spectraof BD+ ions recorded before (a) and after (b) excitationat = 265 nm, where it becomes clear that the phenyl cation is the main photoproduct. The absence of ABH+ parent ions and phenyl fragmentsbefore excitation was ensured by the use of auxiliary dipolar radiofrequencies25which removed these ions from the trap.
Figure 4. a) Mass spectrum of ABH+photofragmentsat = 384 nm after removal of phenyl and residual parent ions from the trap by applying an auxiliary radiofrequency; under these conditions, BD+(m/q = 105) is the most abundant ion in the trap. b) Photodissociation mass spectrum of BD+ions at 265 nm; the main resulting fragment is the phenyl cation (m/q = 77). c) Photofragmentationspectrum of BD+ ions obtained from the m/q = 77 mass channel.The band starting at = 276.0 nm is zoomed in the inset. d) Electronic spectrum of benzenediazonium fluoroborate in ethanolic solution (bulk).34
225 250 275 300 325 350 375 400 excitation wavelength (nm) m/q = 77 m/q = 77 264 270 276
a)
b)
c)
d)
m/q = 105 Fragmentation of benzenediazonium ions at = 265 nm m/q = 77 m/q = 10520
25
30
Preparation of benzenediazonium ions (m/q = 105) in the trapIn view of the high efficiency of production of BD+fragments from ABH+ ions, we were able to perform a photodissociation experiment as a function of the wavelength of a second laser.The absorption spectrum of cold BD+ ions recorded in this way on the phenyl cation (m/q = 77) mass channelis shown Fig. 4c. The spectrum consists in two bands, one in the 280330nm spectral region starting at = 327.1 nmand the other one starting at =276.0nm.In the inset of Fig. 4c the onset of the stronger bandis zoomed at higher resolution (0.02 nmscanning step) with no evidence of sharpvibrational structures,despite the low temperature achieved. For comparison, the spectrum of benzenediazonium fluoroborate in ethanolicsolution is given in Fig. 4d.34
3.3Calculations
Calculations done on ABH+ were restricted to ions protonatedon one of the two equivalent nitrogen atoms of the azo group (Scheme 1a), which is the most plausible situation.We found that the trans isomer of ABH+is the most stable structure, about 0.35 eV (MP2 level of theory, cc-pVDZ basis set) lower in energy than the cishomologue,which adopts a twisted conformationupon geometry optimization(Scheme 2a). The same result was obtained using DFT B3LYP/cc-pVDZlevel calculations, where the transcisenergy difference
results 0.48 eV. Consequently, we focused our attention to the trans-ABH+ ion, since the population of the cisisomer is expected to be negligible in the trap. Compared to the neutral
trans-AB molecule, for which a planar structure is well established, trans-ABH+ ion is slightly twisted out of the plane in the ground state due to steric hindrance between theacidic H atom and the adjacent aromatic ring.A small angle of 18º comes out from our S0calculation
(Scheme 2a), which is enough to break the Cs symmetry.The lowest frequency vibrational modes calculated for trans-ABH+ in the ground state are also depicted in Scheme 2a; they can be associated to a torsional movement around the azo bond, an out of the plane butterfly motion and a nearly-in-plane collective molecular bending.In panel b of Scheme 2 we show the optimized twisted structure of the S1 state of trans-ABH+formed by torsion of the CNNC
dihedral angle (96° in S1), as well as the structure of cis-ABH+ which maintains its chair-like
form in S1.We have observed in the optimization process that the S1 state of
Scheme 2.a) MP2-optimized structures of trans-ABH+and cis-ABH+in the S0 state,and lower frequency
vibrations of trans-ABH+. b) CC2-optimized structures of trans-ABH+and cis-ABH+in the S1state.
The calculated vertical transition energies of the Si=13 excited states,and the
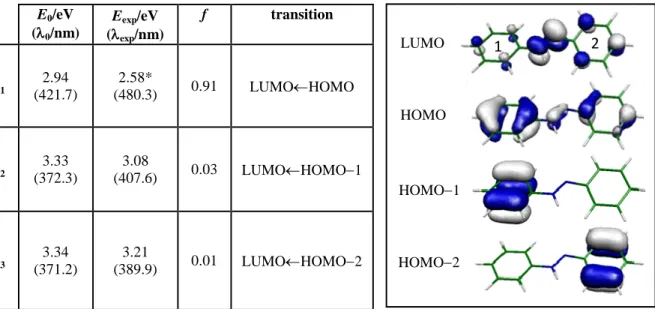
corresponding wavelengths and oscillator strengths are given in Table 1for trans-ABH+, as well as the corresponding frontier orbitals. The energies of the band onsets measured inthe experiment are also included in the table for comparison.The first excited state (S1) exhibits a
marked ππ* character (bonding π-HOMO to antibonding π*-LUMO transition) and an oscillator strength close to 1 (see Table 1). We have assigned the first band of the ABH+spectrum starting at = 480.3 nm to theS1S0transition, which represents a strong red
shift in comparison to the analogousππ*ππexcitation in neutral AB. The next two
torsion, = 35 cm1 butterfly, = 59 cm1 nearly-in-plane bending, = 74 cm1
S0 state
b)
S1 state
trans-ABH+ cis-ABH+ trans-ABH+ cis-ABH+
a)
transitions are close in energy, showing an important CT character as it is suggested by the shape of the molecular orbitals involved in the S2S0 (LUMOHOMO1) and
S3S0(LUMOHOMO2) transitions.Upon excitation, electron density is transferred from
the π orbitals of rings 1 or 2 towards the protonated azo group. We have assigned thesharp bands observed at 407.3 nm and 389.9 nm to the S2S0and S3S0 CT transitions, in that
order.The CC2 vertical transition energies reported in Table 1 are always larger32than the corresponding experimental energies since the excited state potential is not optimized.
E0/eV (0/nm) Eexp/eV (exp/nm) f transition S1 2.94 (421.7) 2.58* (480.3) 0.91 LUMOHOMO S2 3.33 (372.3) 3.08 (407.6) 0.03 LUMOHOMO1 S3 3.34 (371.2) 3.21 (389.9) 0.01 LUMOHOMO2
Table 1.Left panel: CC2 vertical excitation energies (E0)for trans-ABH+in the S0 geometry, transition
wavelengths (0), and oscillator strengths (f). Experimental wavelengths (exp) are taken from band origins; (*)
weak band, the onset may not correspond to the 00 transition. Ground state geometry was optimized, in the Cs symmetry, at MP2 level of theory, using the cc-pVDZ basis set. Right panel:isodensity of the involved frontier orbitals. The ring closer to the protonation site is indicated as 1.
The band assignment presented in Table 1 allowed us to propose a plausible photofragmentationmechanism for the (ABH+ BD+ + B) reaction which, as shown in Fig. 1b, only takes place when the excitation wavelength is restricted to the 300-410 nm spectral range. Under these conditions, both S2S0and S3S0excitations are able to neutralize the
positive charge in the protonated azo group by CT from one of the rings,and this triggersthe concurrent homolytic cleavage of the NH bond and an H radical migration to the other ring (see fragmentation pathwaysinS2 and S3excited states in Scheme 3).
LUMO
HOMO
HOMO1
HOMO2
Scheme 3. Plausible fragmentation pathways of trans-ABH+ in S2 and S3 excited statesfor the (ABH +
BD+ + B) reaction. Excitation wavelengthsare restricted to the 300410 nm spectral range.
Unlike what happens with AB, where the molecule has two equivalent protonation sites in the azo group, dmaAB can be protonated in three different positions corresponding to each one of the lone electron pairs on the nitrogen atoms (see Scheme 1b). Due to the asymmetry of the molecule, the two nitrogen atoms of the azo group are slightly dissimilar, leading to theazoniumstructures indicated as (I) and (II). The S0 geometry optimization of
both azonium ions of trans-dmaABH+evidenced that the structure (I) is 0.06 eV lower in energy than (II) at the MP2 level, and 0.20 eV lower when using the DFT method. The small computed energy difference between isomers (I) and (II) points out that both azonium ions might in principle coexist in the trap under our experimental conditions. However, recent Raman studies19 performed on dmaAB/acetonitrile acidic solutions excited on the band maximum of Fig. 2c evidencedselective enhancement of quinoidmodes, implying that the preferred protonation site corresponds to the structure (I) (see Scheme 1).The third conceivableprotonation site on the amino group leads to a significantly less stable tautomeric structure in the ground state, being 0.29 eV higher in energy than the azonium structure (I) at the MP2 level, and 0.75 eV higher from DFT calculations. The preference ofstructure (I) is
ground state S0 excitedstate S2 1 2 excitedstate S3 BD+ B B BD+
consistent with previous 13C- and 15N-NMR measurements combined with MINDO calculations35 done on 4-aminoazobenzene, and is in accordance with the higher proton affinity computed for the dmaAB azo nitrogen using semiempirical AM1 and ab initioSTO-3G studies.36 By considering the low temperatures achieved in our experiment and taking into account the larger stability of the azonium structures derived from the calculations, it is possible to assume that the ammonium tautomer will likely not be present in the trap. Consequently, we have assigned the entire spectrum shown in Fig. 2b to theazonium form of
trans-dmaABH+, without the possibility to distinguish between isomers (I) and (II).
The vertical transition energies (ground state geometry) calculated for the first three excited states of isomers (I) and (II) oftrans-dmaABH+ are given in Table 2. The resulting energy values are close to those calculated previously19 for the azonium ion of 4-aminoazobenzene. The excitation to the S1 state (LUMOHOMO) can be characterized as a
ππ*ππtransition with a significant oscillator strength, which can be associated to the first band of the dmaABH+ spectrum starting at = 558.3 nm.
iso-mer E0/eV (0/nm) Eexp/eV (exp/nm) f transition S1 (I) 2.62 (473.2) 2.22 (558.3) 1.35 LUMOHOMO (II) 2.38 (520.9) S2 (I) 3.76 (329.7) 0.01 LUMOHOMO1 (II) 3.60 (344.4) S3 (I) 4.00 (310) 0.01 LUMOHOMO2 (II) 3.77 (328.8)
Table 2.Left Panel: CC2 vertical excitation energies (E0) of the azonium tautomer of trans-dmaABH+ in the S0
geometry, transition wavelengths (0), and oscillator strengths (f). Experimental wavelength (exp) is taken from
the band origin. Ground state geometry was optimized,in the Cs symmetry, at MP2 level of theory, using the cc-pVDZ basis set. Right panel: isodensity of the involved frontier orbitals. The ring closer to the protonation site is indicated as 1.
According to our calculations, the second band system observed in the experiment starting at = 376.7 nm (3.29 eV) could originate from the S2S0or
LUMO
HOMO
HOMO1
1 2
S3S0transitionsalthough,unlike what happens in unsubstituted ABH+, these two
transitionscannot be easily assigned in the spectrum of dmaABH+.The excited state energies of isomers (I) and (II) in Table 2 are very close and, since the experimental bands are very broad, it is not possible to exclude the contribution of isomer (II) to the spectrum.
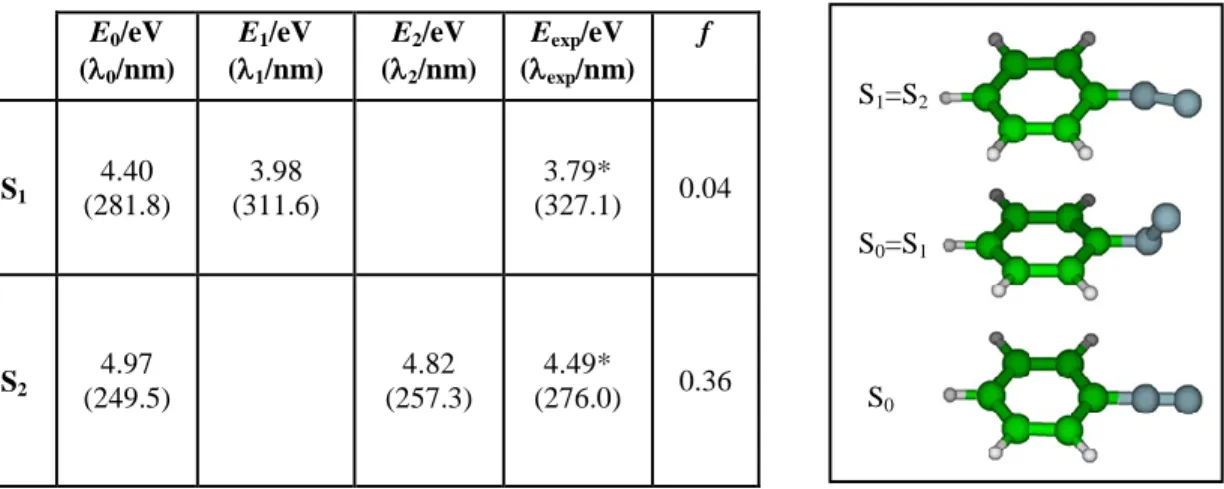
Finally, both vertical (E0: S0 geometry) and adiabatic (E1: S1 geometry,and E2: S2
geometry) low-lying excitation energies were computed for thebenzenediazoniumfragmentand summarized in Table 3, relative to the ground state energy.The two band systems observed in the spectrum of BD+wereassigned to the first two ππππ* transitions (S1S0 and S2S0) shown in the table. As usual, calculated vertical
excitationsE0are about 0.5 eV higher than the experimental values, and the adiabatic transition
energies E1 (S1 geometry) and E2 (S2 geometry) become closer to the experimental values.The
experimental band onsets included in the table may not correspond to 00 transitions, considering the absence of sharp absorption peaks in the spectrum.
E0/eV (0/nm) E1/eV (1/nm) E2/eV (2/nm) Eexp/eV (exp/nm) f S1 4.40 (281.8) 3.98 (311.6) 3.79* (327.1) 0.04 S2 4.97 (249.5) 4.82 (257.3) 4.49* (276.0) 0.36
Table 3.Left Panel: CC2vertical (E0: S0 geometry) and adiabatic (E1: S1optimized Cs geometry, E2: S2optimized
Cs geometry)excitation energies of BD+, transitionwavelengths (i=0-2), and oscillator strengths (f). Experimental
wavelengths (exp) are taken from band origins; (*) weak band, the onset may not correspond to the 00
transition.Ground and excited state geometries were optimized,in the Cs symmetry, respectively at MP2 and CC2 level of theory, using the cc-pVDZ basis set. Right panel: BD+ geometries corresponding to the ground state (S0) and the conical intersections(S0=S1) and (S1=S2), determined by performing out-of-plane
optimizationsof the first and second excited states.
4. Discussion:
S1=S2
S0
The slow rising of the first trans-ABH+band system (Fig. 1b) implies a substantial change in the potential upon photoexcitation and hence a low Franck Condon factor for this transition.The large geometrical change adopted by the molecule upon excitation can be visualized by comparing the optimized structures of trans-ABH+ in the S0andS1states that are
displayed in Scheme 2. It results that half of the molecule flips to a perpendicular position leading to a chair-like structure,with aCNNC dihedral angleof about 96 degrees. This implies that in the S1excited state the observed planar-to-chair isomerization reactionof
trans-ABH+proceeds via a mechanism that resembles the rotation pathway described for the
transcis isomerization in neutral ABs.Rotation about the NN bond will be certainly favored
by protonation on one of the N atoms because it decreases the double bond character.
The loss of planarityof ABH+ in S1could also be responsible ofthe absence of
BD+fragments (m/q = 105)in the photodissociation spectrum above = 410 nm. According to the fragmentation mechanism proposed in Scheme 3,the (ABH+ BD+ + B) reactionwould be favored by an in-plane ringazo electron transfer, in which one π electron of the ring migrates to the empty p orbital on the positively-charged N atom in order to extend the conjugation. In addition, the twisting process occurring in the S1 state would convert very
quickly the electronic energy intoS0vibrational energy through the S1-S0 conical
intersectionfound in the calculations, and this will favor the release of m/q = 77 fragments like in the case of CID fragmentationin the ground state. The 41 cm1 active vibrational progression observed in the ABH+ spectrum (inset of Fig. 1b) may also be associated with the twisting of the azo bond if one considers that the calculated NN torsional mode in the ground state is very close in energy ( = 35 cm1, in Scheme 2).
The next two quasi-degenerate bands in the spectrum of ABH+ exhibitsharper onsets than that of the first band. This observation is compatible with having sufficiently large Franck Condon factorsin order to compensate the low oscillator strength values calculated for S2S0and S3S0 excitations. As a result, it can be assumed that the geometry of S2 and S3
states will be akin to that of the S0 state.
As shown in Fig. 3, the first band in the spectrum of dmaABH+ exhibits a different behaviorthan that of ABH+. The onset is markedly steeper in the case of dmaABH+evidencing a smaller distortion of the S1 equilibrium geometry. One can tentatively assign this difference
preserve a quasi-planar geometry in the excited state.The similar geometries of the ground and first excited states of dmaABH+may also account for the production of m/q = 105 fragment ions.
As it was already pointed out, in the conditions of the trap, protonation of ABor dmaABleads to the azonium form of the molecular ions. We have neglected the presence of the ammonium mesomerof dmaABH+because of the large energy difference found in the S0
states. Moreover,supplementary excited state calculations carried out for the ammonium tautomer of dmaABH+ have shown that the first transition having a non-negligibleoscillator strength value appears at 3.79 eV ( = 327 nm), and this does not match with the observed spectrum or in any case the ammonium band would be obscured by the S2S0 transition of
the azonium form.
The spectrum of cold BD+ given in Fig. 4c does not present well resolved vibrationalstructures as those observed for similar systems in comparable conditions.30,37 This is an indication that a substantial change in geometry occurs in the excited state or that its lifetime is very short. In order to study this possibility we have optimized S1and S2excited
states of BD+ by releasing the constraint of maintaining the ground state Cs geometry at cc-pVDZ/CC2 level. The computed S1 and S2 geometriesshow that the diazonium group
(+NN:)abandons the plane defined by the aromatic ring and bends. Two conical intersections associated with the crossings S1=S0 and S2=S1emerge from the calculations at the
geometries depicted in the right panel of Table 3, and no barrier was found in these optimization processes. A fast internal conversion through thetwo aforementioned conical intersections couldaccountfor the absence of a well-defined vibrational progression in the BD+absorption bands. Accordingly, a fast deactivation of BD+is expected to take place by relaxation processes linked to the torsion of thediazonium group.
5. Conclusions:
UV-VIS electronic spectra of ABH+,dmaABH+and BD+ions confined in a cryogenically-cooled trap were measured by photodissociation spectroscopy and the results were interpreted with the aid of ab initio calculations that include vertical excitation energies, normal modesin the S0 state, and geometry optimizations in the ground and low lying excited
According to our ab initio computations, cisisomers do not exist at the temperature of the trap, andthe protonated forms of trans-ABand trans-dmaAB in the trap correspond to azonium structures, with no preferencebetween isomers (I) and (II) in the case of dmaABH+.We have visualized that the S1S0 transition of ABH+anddmaABH+ mainly
correspond to a LUMOHOMO excitationwith ππππ* character, the band of the substituted azobenzenebeing strongly red-shifted due to the donating effect of the dmalone electron pair into the π system.At slightly higher energies, two intense CT transitions (S2S0
and S3S0) are clearly distinguished in the ABH+ spectrum. In contrast to S1, S2 and S3states
preserve a quasi-planar structurein which an electron transfer takes place via the π orbitals system, along with the production of BD+photofragments; this fragmentation channel is not active for S1nor for S4 excited states. Despite the size of the molecular ions involved in this
study, we conclude that fragmentation is not exclusively due to internal conversion but some electronic properties of the excited statesare revealed in the measured fragmentation patterns.
An efficient photoisomerization process connected to the torsion of the azo bond was shown in this study for ABH+ ions. It consists in a planar-to-chair dynamics that is related to the transcisrotation mechanism described in photoexcited neutral ABs. However, the yield
of cis-isomers might be very low in the case of protonated ABs, since the chair-to-planarback reaction is expected to be very fast.Photoisomerization was found very sensitive to substitution by dma groups. The more pronounced rising of the first absorption band measured in the dmaABH+electronic spectrum, and the good yield of BD+ fragments upon S1
excitation, allowed us to speculate that the planar-to-chairdynamics is hindered in this case. A reason for that is the larger resonance delocalization induced by the dmaterminal group, which may contribute to preserve a quasi-planar geometry in the S1excited state.
In addition, we are presenting the photofragmentationUV spectrumof BD+, a very stable and fundamental ion which results from photofragmentation of ABH+. Althoughthe ion is cooled down in the trap, the observed spectrumis not well resolved,which is indicative of a strong change in the excited state geometry by torsion of thediazonium group or/and fast relaxation processes.
This works was supported by ECOS-MinCyT cooperation program (A11E02) the ANR Research Grant (ANR2010BLANC040501), FONCyT, CONICET,UNC and SeCyT-UBA. We acknowledge the use of the computing facility cluster GMPCS of the LUMAT federation (LUMAT FR 2764). These researches have been conducted within the international CNRS/CONICET laboratory LEMIR.
6. Bibliography:
1. Schulze, F. W.; Petrick, H. J.; Cammenga, H. K.; Klinge, H. Z.Phys. Chem. Neue
Fol.1977, 107, 1–19.
2. Andersson, J.A.; Petterson, R.; Tegner, L. J. Photochem. 1982, 20, 17–32. 3. Ikeda, T.; Tsutsumi, O. Science1995, 268, 1873–1875.
4. Tamai, N.; Miyasaka, H. Chem. Rev.2000, 100, 1875–1890.
5. Kobayashi, T.; Degenkolb, E. O.; Rentzepis, P. M. J. Phys. Chem.1979, 83, 2431– 2434.
6. Rau, H.; Lueddecke, E.J. Am. Chem. Soc.1982, 104, 1616–1620. 7. Fujino, T.; Tahara, T.J. Phys. Chem. A2000, 104, 4203–4210.
8. Chang, C.-W.; Lu, Y.-C.; Wang, T.-T.; Diau, E. W.-G. J. Am. Chem. Soc.2004, 126, 10109–10118.
9. Tan, E. M. M.; Amirjalayer, S.; Smolarek, S.; Vdovin, A.; Zerbetto, F.; Buma, W. J.
Nat. Commun.2015, 6, 5860: 1–7.
10. Monti, S.; Orlandi, G.; Palmieri, P. Chem. Phys.1982, 71, 87–99. 11. Crecca, C. R.; Roitberg, A. E. J. Phys. Chem. A2006, 110, 8188–8203. 12. Conti, I.; Garavelli, M.; Orlandi, G. J. Am. Chem. Soc.2008, 130, 5216–5230. 13. Cusati, T.;Granucci, G.;Persico, M.J. Am. Chem. Soc.2011, 133, 5109–5123. 14. Bandara, H.M.D.; Burdette, S.C. Chem. Soc. Rev.2012, 41, 1809–1825.
15. Mahimwalla, Z.; Yager, K.G.; Mamiya, J.; Shishido, A.; Priimagi, A.; Barrett, C.J.
Polym. Bull. 2012, 69, 967–1006.
16. Beharry, A. A.; Woolley, G. A.Chem. Soc. Rev. 2011, 40, 4422–4437. 17. Shishido, A. Polymer J. 2010, 42, 525–533.
19. Matazo, D. R. C.; Ando, R. A.; Borin, A. C.; Santos, P. S. J. Phys. Chem. A2008, 112, 4437–4443.
20. Dunn, N. J.; Humphries, W. H.; Offenbacher, A. R.; King, T. L.; Gray, J. A. J. Phys.
Chem. A2009, 113, 13144–13151.
21. Sokalski, W. A.; Góra, R. W.; Bartkowiak, W.; Kobylinski, P.; Sworakowski, J.; Chyla, A.; Leszczynski, J. J. Chem. Phys.2001, 114, 5504–5508.
22. Féraud, G.; Esteves-López, N.; Dedonder-Lardeux, C.; Jouvet. C. Phys. Chem. Chem.
Phys.2015, 17, 25755–25760.
23. Alata, I; Bert, J.; Broquier, M.; Dedonder-Lardeux, C.; Féraud, G.; Grégoire, G.; Soorkia, S.; Marceca, E.; Jouvet, C. J. Phys. Chem. A2013, 117, 4420–4427.
24. Féraud, G.; Dedonder-Lardeux, C.; Jouvet, C.; Inokuchi, Y.; Haino, T.; Sekiya, R.; Ebata, T. J. Phys. Chem. Lett.2014, 5, 1236–1240.
25. Kang, H.; Férraud, G.; Dedonder-Lardeux, C.; Jouvet, C. J. Phys. Chem. Lett.2014, 5, 2760−2764.
26. Ahlrichs, R.; Bär, M.; Häser, M.; Horn, H.; Kölmel, C. Chem. Phys. Lett.1989, 162, 165–169.
27. Hättig, C.; Weigend, F. J. Chem. Phys.2000, 113, 5154–5161.
28. Dreuw, A.; Head-Gordon, M.J. Am. Chem. Soc.2004, 126 4007–4016.
29. Féraud, G.; Broquier, M.; Dedonder-Lardeux, C.; Grégoire, G.; Soorkia, S.; Jouvet, C.
Phys. Chem. Chem. Phys.2014, 16, 5250–5259.
30. Féraud, G.; Dedonder-Lardeux, C.; Soorkia, S.; Jouvet, C. J. Chem. Phys. 2014, 140, 024302:1–10.
31. Horai, H.; Arita, M.; Kanaya, S.; Nihei, Y.; Ikeda, T.; Suwa. K.; Ojima, Y.; Tanaka, K.; Tanaka, S.; Aoshima, K.; Oda, Y.; Kakazu, Y.; Kusano, M.; Tohge, T.; Matsuda, F.; Sawada, Y.; YokotaHirai, M.; Nakanishi, H.; Ikeda, K.; Akimoto, N.; Maoka, T.; Takahashi, H.; Ara, T.; Sakurai, N.; Suzuki, H.; Shibata, D.; Neumann, S.; Iida, T.; Tanaka, K.; Funatsu, K.; Matsuura, F.; Soga, T.; Taguchi, R.; Saito, K.; Nishioka, T. J. Mass Spectrom., 2010, 45, 703714.
32. Berdakin, M.; Féraud, G.; Dedonder-Lardeux, C.; Jouvet, C.; Pino, G. A. Phys. Chem.
33. Gasper, S. M.; Devadoss, C.; Schuster, G. B. J. Am. Chem. Soc.1995, 117, 52065211.
34. Sukigara, M.; Kikuchi, S. Bull. Chem. Soc. Japan 1967, 40, 461–466. 35. Kuroda, Y.; Lee, H.; Kuwae, A. J. Phys. Chem.1980, 84, 3417–3423.
36. Liwo, A.; Tempczyk, A.; Widernik, T.; Klentak, T.; Czermiński, J. J. Chem. Soc.,
Perkin Trans. 21994, 7175.