HAL Id: hal-01796107
https://hal.archives-ouvertes.fr/hal-01796107
Submitted on 29 May 2018
HAL is a multi-disciplinary open access archive for the deposit and dissemination of sci-entific research documents, whether they are pub-lished or not. The documents may come from teaching and research institutions in France or abroad, or from public or private research centers.
L’archive ouverte pluridisciplinaire HAL, est destinée au dépôt et à la diffusion de documents scientifiques de niveau recherche, publiés ou non, émanant des établissements d’enseignement et de recherche français ou étrangers, des laboratoires publics ou privés.
Combining freeform-shaped holographic grating and
curved detectors in a scheme of multi-slit astronomic
spectrograph
Eduard Muslimov, Emmanuel Hugot, Marc Ferrari
To cite this version:
Eduard Muslimov, Emmanuel Hugot, Marc Ferrari. Combining freeform-shaped holographic grating and curved detectors in a scheme of multi-slit astronomic spectrograph. SPIE Optics + Optoelectron-ics, Jun 2017, Prague, Czech Republic. �10.1117/12.2264790�. �hal-01796107�
Combining freeform-shaped holographic grating and curved detectors
in a scheme of multi-slit astronomic spectrograph
Eduard R. Muslimov*
a ,b, Emmanuel Hugot
a, Marc Ferrari
aa
Aix Marseille Univ, CNRS, LAM, Laboratoire d’Astrophysique de Marseille, Marseille, France;
bKazan National Research Technical University named after A.N. Tupolev-KAI 10 K. Marx, Kazan,
Russian Federation 420111
ABSTRACT
In the present work we consider optical design of a multi-slit astronomic spectrograph for UV domain with freeform reflective elements. The scheme consists of only two reflective elements – a holographic grating imposed on freeform surface and a freeform mirror. The freeforms are described by standard Zernike polynomials and the hologram is recorded by two coherent point sources. We demonstrate that in such a scheme it’s possible to obtain quite high optical quality for an extended field of view and relatively high dispersion on a curved image surface. The spectrograph works with linear field of view of 76x32 mm and provides reciprocal linear dispersion equal to 0.5 nm/mm and typical resolving power of 15 000 over the UV range of 100-200 nm. Feasibility of the optical components is discussed and coupling of the spectrograph with a TMA telescope is demonstrated.
Keywords: multi-slit spectrograph, freeform surface, holographic grating, curved detector.
1. INTRODUCTION
A number of science cases in modern astrophysical studies requires a high-efficiency, high-angular resolution imaging spectrograph [1-3]. In the recent years a few designs of future instruments for multi-slit (or multi-object) spectroscopy in the UV domain were developed. Among them we would like to emphasize the instruments presented by K. France et al. [4, 5], studied in the frame of the current NASA decadal survey, covering most of its’ scientific goals in the field of UV spectroscopy.
There are a few critical requirements for the type of spectrographs under consideration. Firstly, it should provide high optical quality over an extended field of view along with a high linear dispersion. Secondly it should provide minimum possible flux losses, that implies minimum number of optical surfaces among other means for the losses reduction. Any moving or changing components are undesirable, because their use can reduce the instrument operation reliability and decrease its’ actual observation time. In addition, as for any other space application the instrument should be as compact and lightweight as possible.
In the present paper we study how can be improved the design of a UV multi-slit spectrograph by use of different optical components, which experienced significant progress in the recent years. Firstly, we consider freeform surfaces in the spectrograph scheme and their combination with variable line-spacing (VLS) and holographic gratings. Also, we discuss possibilities of use of curved detectors in the optical scheme.
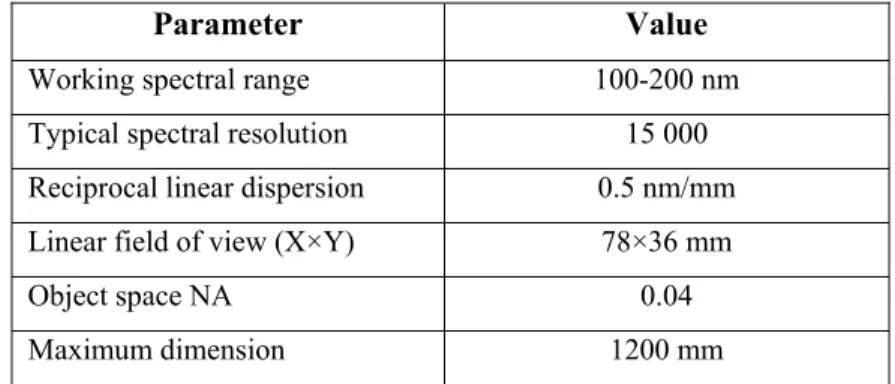
The target values of the spectrograph main parameters are presented in Table1. They are defined mainly by the two above mentioned instruments. It’s supposed that the entire spectral range is covered in one exposure with the same grating. The entrance aperture corresponds to F/# of the incoming beam equal to 1:12.5. In the beginning we consider the spectrograph separately, so the entrance slits array is self-emitting, further we discuss questions of the aperture coupling with a telescope.
freefor focusing mirror
..-.,.
a`ya
_- -
freeform holographic grating microshutter array detector surfaceTable 1. Target values of the spectrograph parameters.
Parameter Value
Working spectral range 100-200 nm
Typical spectral resolution 15 000 Reciprocal linear dispersion 0.5 nm/mm
Linear field of view (X×Y) 78×36 mm
Object space NA 0.04
Maximum dimension 1200 mm
2. OPTICAL DESIGN
2.1 Optical scheme
The best optical quality was obtained with the configuration presented on Fig.1. It consists of the entrance slits (or micro-shutters) array, two reflective freeform surfaces – the grating and the auxiliary focusing mirror, and a detector with spherical surface.
Figure 1. Optical scheme of the multi-slit UV spectrograph. The total size is 168×626×1153 mm (X×Y×Z).
We should note a few assumptions taken into account in this design. The linear magnification in the scheme is equal to -1×. The width of an individual slit (or microshutter) is supposed to be 20 µm, which is not possible today, though this
value can be achieved in the nearest future [6, 7]. Thus to provide a proper sampling the pixel size should be 10µm or less, which is also close to the parameters of the state-of-art UV detectors [8].
The entrance pupil in this design is located on the grating surface. The pre-optics, i.e. the telescope isn’t taken into account in this version of the design. These assumptions can be valid when the object is bright enough, so the slit size is noticeably smaller than that of the intermediate image.
OBJ: 38.00, 16.00 mm OBJ: 38.00, -16.00 mm E
Z
r
IMA: -38.055, -15.802 mm lISA: -37.935, 16.254 mm OBJ: 0.00, 16.00 mm OBJ: 0.00, 0.00 mm IMA: -0.000, 0.000 mm OBJ: -38.00, 16.00 mm IMA: 39.055, -15.902 -_.. IMA: -19.000, -7.952 mm IMA: 0.000, -16.000 mm OBJ: 19.00, 8.00 mm OBJ: 38.00, 0.00 mm OBJ: 0.00, -16.00 mmok,
IMA: -37.995, 0.214 mm OBJ: -38.00, -16.00 mm IMA: 37.935, 16.254 mm OBJ: 19.00, -8.00 mm IMA: -0.000, 16.027 mm OBJ: -38.00, 0.00 mm4
IMA: 37.995, 0.214 mm OBJ: -19.00, 8.00 mm IMA: -10.971, 0.067 mm IMà: 19.000, -1.952 mmô
ó
m Úi
LLE/Emax E/Emem E/Emax
_ dy m N s -g dy, Nm _ dY. Nm -g dy, Nm
=MIL
MN FAMBMA
N
1W
o i..o s. E/Emax -0..0.o E/Emax .o si.s 0..0 _s a.o 0. E/Emax a.o si.. , MP 0PI
m m2.2 Image quality and resolution
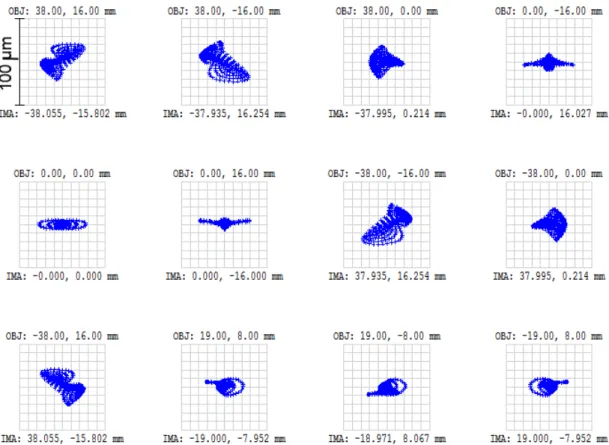
The image quality achieved in the presented scheme is estimated by means of spot diagrams (Fig.2) and instrument functions (Fig.3).
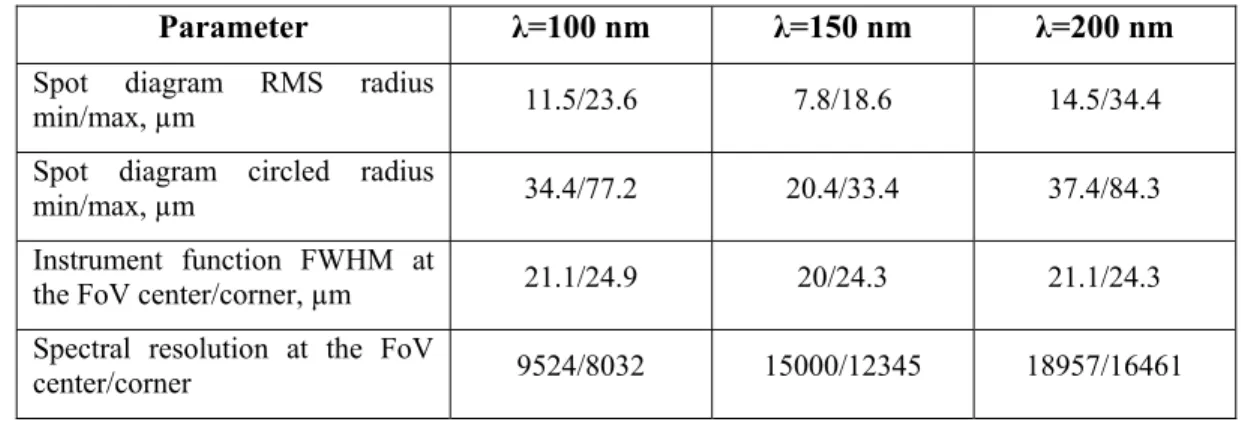
The characteristic values describing the optical quality across the working range and the field of view (FoV) are summarized in Table 2. The observed maximum radii of the spots can be explained by the optimization features, namely use of the RMS radii to build the merit function and assignment of lower weight coefficients to the aberration terms along the X axis. The reciprocal linear dispersion of the spectrograph is 0.5 nm/mm and it remains almost constant across the image. The spectral resolution limit is defined as its’ product with the full width at half maximum (FWHM) of the instrument function, and it’s also very uniform for all the wavelengths and field points. The unites spectral resolution value varies significantly, but it is typical for low and medium resolution instruments.
Table 2. Optical quality parameters of the spectrograph
Parameter λ=100 nm λ=150 nm λ=200 nm
Spot diagram RMS radius
min/max, µm 11.5/23.6 7.8/18.6 14.5/34.4
Spot diagram circled radius
min/max, µm 34.4/77.2 20.4/33.4 37.4/84.3
Instrument function FWHM at
the FoV center/corner, µm 21.1/24.9 20/24.3 21.1/24.3
Spectral resolution at the FoV
center/corner 9524/8032 15000/12345 18957/16461
The obtained spectral resolution values generally correspond to the requirement specified in the beginning. Below we describe in more details design of the individual scheme components and discuss their complexity, feasibility and influence on the total spectrograph performance.
3. ANALYSIS OF THE OPTICAL DESIGN
3.1 Surface shape
The freeform surfaces shapes are described by the standard Zernike polynomials [9]. For both of the grating and the mirror the highest used term number is 15. However, due to symmetry in respect of the ZY plane, only seven Zernike terms are used for each of the surfaces. To estimate their shapes, we provide residuals after subtraction of the best fit spheres (BFS) from the sags on Fig. 4. Here we understand the BFS as a sphere defined by radius of curvature and position of the center, which provides the minimum RMS residual from the actual freeform surface. The BFS parameters for the grating are as follows: Rgr=-1797.00 mm, zgr= 0.89mm. They provide the residual RMS discrepancy
of 4.6 µm and the maximum discrepancy equal to 11.9µm. The obtained values are within the existing technological limits [10]. It’s clear from the plot that the surface has a complex shape providing compensation of astigmatism and coma. The BFS parameters calculation for the focusing mirror gives the following results: Rm=2298.02 mm,
zm= -7.19mm. The RMS and maximum deviation from the sphere are 17.64 and 62.00 µm, respectively. It should be
noted here, that the given values are rather overestimated, because the calculations are performed over a full circular aperture instead of a real working one, which is rectangular.
1
f
000+300'O 000+3SS'S S OO+3Z0'S S OO+3£S'S S OO+360'Z S OO+3SS'Z S OO+3L0'£ T00+389 'S S OO+360'6 S OO+309'6 S OO+3SS'SI
000+300'O 000+380'S 000+350'Z 000+380'£ 000+305'6 000+3£S'S 000+3SS'9 000+385'L 000+355'8 000+385'6 qLO0+3£0'LI
G Grooves frequency, gr /mmFigure 4. Residuals of the surfaces sag after the BFS subtraction: a – grating surface, b – focusing mirror surface. The units on scalebar are microns.
3.2 Grating parameters
Preliminary modeling had shown that use of a grating with a freeform surface doesn’t provide enough degrees of freedom for aberration correction across entire FoV for all the wavelength. Use of a non-classical grating, i.e. a grating with curved and/or unequally spaced grooves presented an evident way to increase the parameters number. The simplest option was use of a Variable Line Spacing (VLS) grating. This approach was attractive because it offers the possibility to compensate for a few tangential aberration terms, and also because of simplicity of its’ implementation in a raytracing software. The effective grooves spacing in a point on the grating surface is calculated as
;
1
2 3 4 5 0y
y
y
y
y
N
d
eff=
+
α
⋅
+
β
⋅
+
γ
⋅
+
δ
⋅
+
ε
⋅
(1)where N0 is the grooves frequency in the vertex and y is the coordinate of the point.
Use of a VLS grating allows to achieve an appropriate optical quality. The RMS spots radii similar to that presented in Table 2 are 12.8-25.7, 12.4-22.5 and 16.3-26.4 µm for 100,150 and 200 nm respectively. The obtained dependence of the grooves frequency is shown on Fig. 5.
1145.8 mm grating substrate lstrecording source 30.01° 2 "d recording source 1141.6 mm
The frequency variation across the surface doesn’t exceed 20 gr/mm, i.e. 1.2%. However, the mechanical ruling of the grating can be unrealizable because of complex shape of the substrate.
Both of these disadvantages can be excluded if the grating is considered and modelled as a holographic one. In this case the equation, given by Welford in [11] is used for raytracing during optimization and analysis:
)
(
)
'
'
(
0 o r o rr
k
n
r
r
r
n
r
×
r
−
r
=
r
×
r
−
r
λ
λ
(2) Herenr
is the normal vector,r r
r ,
rr
o are vectors of the recording rays,r
r
'
r,
r
r
o'
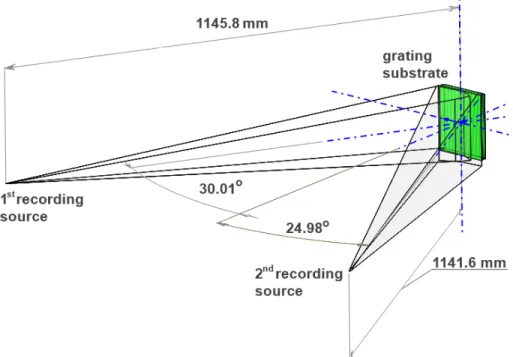
are that of the incident and diffracted rays, k is the order of diffraction, λ0 and λ are the recording and working wavelengths respectively.The grating is recorded by two coherent point sources at 532 nm. The grooves are curved and unequally spaced, while the curvature and spacing in an arbitrary point is defined by the recording geometry presented on Fig.6.
Figure 6. The holographic grating recording scheme.
Thus the holographic grating has realizable recording parameters and provide the highest optical quality. In addition, the holographic manufacturing technique is versatile and applicable to different surface shapes. We consider that the holographic grating has a priority in this case and the rest of the analysis is performed for the spectrograph scheme with the holographic grating.
3.3 Influence of the detector shape
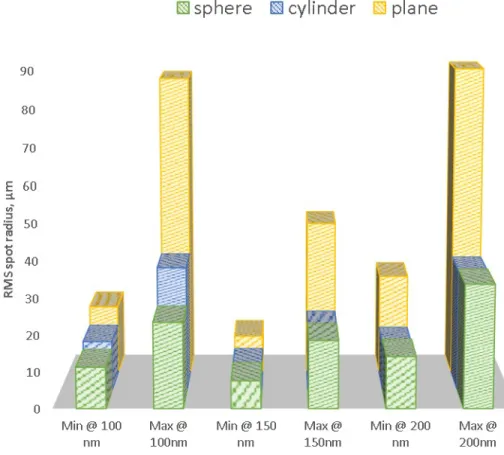
To demonstrate the influence of the image surface shape on the resolution we considered different cases, namely a plane, spherical and cylindrical detectors. Each time the optical scheme was re-optimized with the same conditions. The obtained spot radii are given as a chart (Fig.7).
90 80 70 60 50 40 30 20 10
Li sphere
E] cylinder
plane
Min @ 100 Max @ Min @ 150 Max @ Min @ 200 Max @
nm 100nm nm 150nm nm 200nm
Figure 7. Dependence of the maximum and minimum RMS radii of the spots on the detector shape.
It’s clear that a curved detector provides much better image quality than a flat one. The results for cylinder and sphere are very close to each other, though the sphere gives a better resolution on the shortwave edge of the spectrum. In the final version of the spectrograph design its’ surface has the radius of curvature equal to 878.78 mm and the maximum sag of 8.43 mm. Such a detector an analogous to that described in [12,13] and can be manufactured using the same technique.
3.4 Coupling with a telescope
To exemplify the case, when the intermediate image is smaller than the slit, we consider coupling of the spectrograph with a telescope. We use scheme of an on-axis three-mirror anastigmat (TMA) given in [14] with focal length of 108.08m and F/# of 12. The linear field specified above corresponds to angular field of 72.5×30.5” in this case. The main difficulty of the coupling is that the slit cannot be considered as a self-emitting one and the spectrograph entrance pupil has position and diameter dictated by the telescope scheme. If the spectrograph scheme is used without changes(see Fig.2 and Table 2.), the spot sizes increases to 9.4-30.3, 7.5-20.3 and 11.5-32.3 µm for 100, 150 and 200 nm respectively. So the optical quality and spatial resolution will not change, though the actual spectral resolution will be defined by the object size. The observed decrease of the spot size can be explained by the TMA central obscuration. The optical scheme and the spot diagrams obtained for the spectrograph coupled with the telescope are shown on Fig.8.
a
L.
bsecondary
--mirror
primary
mirror
folding
mirror #3
spectrograph
tertiary
mirror
Ifolding
mirror #1 WI! -0.1700, 0.0104 (timg) E (:) (:):-.KC-3.8.1e,C, -81.597 9e... lui -0.000, -83.793 nm
entrance
slit
folding
mirror #2
ORT! -0.0710, 0.0000 Meg) 11421: 28.100, -83.591 mn -38.105, -99.484 milUBJ: 0.0000, 0.0000 (dog: 0I5J: 0.0200, 0.0000 (deg) 011.1: -0.0200, -0.0084 (deg) OBJ: 0.0000, -0.0084 (deg)
TM! 10.105, -44.400 mm TIA! :41.251, -115.410 nm na! 0,007, 115.1A1 mm
387: 0.0200. -0.0)84 (ceg: 063: -0.0100, 0.0084 (deg) OK: 0.0100, 0.0084 Ideg) OBI: -0.010), -0.00E4 'deg)
7V2. -19.03), -83.141 nm IMO: 19.03), -83.141 mn lui: -15.111, -111.119 mn
Figure 8. Coupling of the spectrograph with an on-axis TMA telescope: a – optical scheme, b – spot diagrams.
4. CONCLUSION
In the present paper we considered potential improvement of a multi-slit UV spectrograph by means of freeform surfaces, a holographic grating and a curved detector. We demonstrated, that combining these novelties in the same optical design makes it possible to achieve spectral resolution of 8000-19000 with a typical value of 15000 across the UV domain from 100 to 200 nm. The entire range is registered simultaneously. The linear field of view reaches 76×32 mm. It’s notable that the design uses only two reflective surfaces, so the total throughput can be increased. In addition, it’s very compact – the dimensions don’t exceed 170×630×1200 mm.
The key element of the design is a freeform holographic grating. It’s characterized by relatively small sag deviation from the BFS and realizable parameters of the recording sources, but provides wide possibilities for aberration correction. The approach to modelling and optimization of such an optical element presented here can be useful for further development of high-performance spectrographs.
It was shown that the spectrograph performance is highly dependent on the image surface shape, use of a curved detector can drastically enhance optical quality achieved in such designs.
The presented design can be of a special interest for astronomy and astrophysics, especially for the future space telescopes missions, though it’s possible applications is not limited by the specified points.
ACKNOWLEDGEMENT
The authors acknowledge the support of the European Research council through the H2020 - ERC-STG-2015 – 678777 ICARUS program.
REFERENCES
[1] Clarke, J. T. et al. "Ultraviolet emissions from the magnetic footprints of Io, Ganymede and Europa on Jupiter,” Nature 415, 997 - 1000 (2002).
[2] Walter, F. M. et al. “Mapping the Circumstellar Environment of T Tauri with Fluorescent H2 Emission,” The Astronomical Journal, 126(6), 3076 (2003)
[3] France, K. et al., “The SLICE, CHESS, and SISTINE Ultraviolet Spectrographs: RocketBorne Instrumentation Supporting Future Astrophysics Missions,” Journal of Astronomical Instrumentation, 5(1), 1640001 (2016) [4] France K, Fleming B, Hoadley K; “Chisl: the combined high-resolution and imaging spectrograph for the luvoir
surveyor,”. J. Astron. Telesc. Instrum. Syst., 2(4),041203 (2016).
[5] McCandliss, S. R. et. al. “Project Lyman,” Proc. SPIE 7011, 701120 (2008).
[6] Li, M. J. et . al. “JWST microshutter array system and beyond,” Proc. SPIE 7594, 75940N (2010).
[7] Vallerga, J. “Development of a flight qualified 100 x 100 mm MCP UV detector using advanced cross strip anodes and associated ASIC electronics,” Proc. SPIE 9905, 99053F (2016).
[8] Born, M. and Wolf, E. [Principles of Optics], Pergamon press, New York, 464-466, 767-772 (1959). [9] Hentschel, R.; Braunecker, B.; Tiziani, H. J. [Advanced Optics Using Aspherical Elements], SPIE Press,
Bellingham, Washington USA, 211-282 (2008).
[10] Welford, W.T. “A vector raytracing equation for hologram lenses of arbitrary shape,” Optics Communications, 14(3), 322-323 (1975)
[11] Hugot, E. et al. “Flexible focal plane arrays for UVOIR wide field instrumentation,” Proc. SPIE 9915, 99151H (2016)
[12] Lampton, M.; Sholl, M. “Comparison of On-Axis Three-Mirror-Anastigmat Telescopes,” Proc. SPIE 6687, 66870S (2007).