Massachusetts Institute of Technology
Department of Electrical Engineering and Computer Science
Thesis in Partial Fulfillment of the Requirements for the Degree of Master of Science Title: Computer Simulation of the neuromuscular reaction to electrical
stimulation of the spinal cord of a spinalized frog . Submitted by: Ari Wilkenfeld
34 The Fenway Boston, MA 02215 Date of Submission:
Work done in the Eric P and Evelyn E Newman Laboratory for Biomechanics and Human Rehabilitation with partial support from a grant by the National Science Foundation
@ 1997 Massachusetts Institute of Technology. All rights reserved.
(Afied by Neville Hogan, lrof.Mechanical Engineering and Brain and Cognitive Science
Thesis AdYisor _
Accepted by Arthur C.
Smt<-Chairman, Committee on Graduate Students
Department of Electrical Engineering and Computer Science
Table of Contents
Page
Abstract 4
Chapter 1: Introduction 5
Chapter 2: Theoretical Background of the Equilibrium Point Hypothesis 9
a. Alpha and Lambda Hypothesis 9
b. The Equilibrium Point Hypothesis in Motor Control 15 Chapter 3: Experimental data available and data processing 18
a. Experimental Data Available 18
b. Processing of Force Data 22
Chapter 4: Testing Potential Models 37
a. Modeling Goal 37
b. Possible Models 37
c. Testing Model one 38
d. Testing Model two 42
Chapter 5: Future Work, Discussion 47
a. Future Work 47
b. Discussion 50
References 51
Appendix 1: Verification of the software for integration of forward dynamics 53
Title: Computer Simulation of the neuromuscular reaction to electrical stimulation of the spinal cord of a spinalized frog
Submitted by: Ari Wilkenfeld, September 1997
Thesis in Partial Fulfillment of the Requirements for the Degree of Master of Science for the Department of Electrical Engineering and Computer Science,
Massachusetts Institute of Technology
@ 1997 Massachusetts Institute of Technology. All rights reserved. Abstract
This thesis presents models of the mechanical behavior of a frog limb when the lumbar region of the spinal cord is activated using electrical stimulation. Data was obtained from the electrical stimulation of several spinalized preparations. Isometric data was available from measuring the force at the ankle while the limb was held isometrically
with a force transducer and the spinal cord stimulated. Free limb trajectories were also available using the same electrical stimulation patterns and attaching the frog's ankle to a small two link mechanism with the ability to sense position.
Possible models were considered based on the equilibrium point hypothesis- the idea that movements are planned as a series of stable postures with some impedance between the motion of the limb and the trajectory of equilibrium postures- the so-called "virtual trajectory". Two possible classes of models were eliminated. Any model consisting solely of an elastic element and a moving mechanical equilibrium point was eliminated by comparing isometric forces on the limb to inertial forces required to move it along its actual trajectory. Any model relying solely on a viscous element between the limb and the ground frame for energy dissipation was eliminated by noting that such an element would have to be active for some portion of the motions . This was determined by comparing the isometric forces measured with the forces required to actually move the
limb and noting the difference. For these purposes, the frog leg was modeled as a two link manipulandum and dynamic equations were formulated. Future work is suggested.
Supervised by: Neville Hogan, Prof. of Mechanical Engineering and Brain and Cognitive Science
Chapter 1: Introduction
A classic problem in neural control of movement is to determine at what level movements are controlled. It is generally assumed that there is some hierarchy in this process. The brain is the highest level, planning out the movement based on primarily visual data. It is possible that all calculations are in fact done at this level with the brain explicitly calculating necessary joint torques from required hand accelerations (via inverse
dynamics) and then firing muscles accordingly via alpha motor neurons, taking all the nonlinear properties of muscle into account. This is unlikely for a variety of reasons, among them the fact that small errors in the calculations, in the brain's knowledge of the system properties (limb inertias, etc.), or from external perturbation, could compromise performance. For example, it can be shown that for a movement starting and ending with zero velocity, infinite precision is needed if pure torque control is utilized. From a
computational standpoint, the inverse dynamic calculations required for a multi-joint system are also extremely complex (Hogan, 1997).
The "equilibrium point hypothesis" (actually a family of related theories) states in essence that some responsibility for motion is relegated to lower in the system. The theory states that movement is generated by commanding a series of postures, which is then translated into firing commands (Feldman, 1966). Each of these postures is stable due to the apparent elastic and viscous nature of muscle and/or the effects of spinal feedback circuitry.
Experimentally, it has been confirmed by Emilio Bizzi and colleagues
preparation will in the majority of cases cause the hind limb to converge to a
stable posture within the frog's reach. This leads to the possibility that the equilibrium point phenomenon is hardwired into the gray matter of the spinal cord.
A further result noted by researchers (Mussa-Ivaldi, 1990, Lemay, 1997) was that the force measured at a point in the frog's workspace when two points in the spinal cord were simultaneously stimulated was the vector sum of the force produced by each site stimulated alone. It was also observed that the relative contribution of the two force vectors could be scaled by scaling the relative stimulation of the two electrode sites.
The motivation behind this thesis's research was to develop a competent computer model to allow prediction of the motion of a frog's leg due to spinal stimulation. The ultimate goal of such a simulation, aside from purely scientific interest, is for application to human neural prosthetics.
Current rehabilitation technology allows for Functional Electrical Stimulation (FES) of muscles in spinal cord injured patients to restore functionality to areas no longer receiving descending neural commands. There are, however, several problems limiting clinical practicality of the technology, among them a) it requires 48 implanted electrodes to achieve something approaching functional gait, b) the control algorithm is extremely complex and c) because the muscles are not generally recruited in the most efficient possible manner, fatigue results very quickly (Chizeck, 1992).
An FES system using electrodes implanted in the spinal cord could more simply drive the limb to an equilibrium position. Fewer electrodes would probably be needed and
the control could be extremely simplified compared to current strategies since individual muscles would not need to be innervated by separate electrodes.
Theoretically, any posture in the limb's workspace could be reached by stimulating the combination of spinal sites whose force vectors sum up to produce a stable equilibrium point at the desired location. By stimulating multiple sites in the spinal cord and
controlling the magnitude of stimulation, one could conceivably move the limb stably from one posture to another. These moves could then be used to build up complex motions such as locomotion.
The specific goal of this thesis was to develop a model that would competently reproduce trajectory data of a frog hind leg under electrical stimulation of the lumbar spinal cord given measurements of the isometric force when the ankle was held at different spots under that same stimulation. Such a model would be useful for prediction of motion given different combinations of multiple electrodes stimulating simultaneously. It would eliminate the need to run an experiment to determine the motion obtained from each combination of stimulus levels in a multiple electrode system. This would facilitate investigation of possible limb control strategies using this technique.
In order to produce such a model, it is necessary to make assumptions about the specific structure of the system made up of the limb and the equilibrium point. The major contribution of this work is to evaluate some of the common assumptions in the literature regarding such a system. Specifically, the competence of models based on dissipating energy by modeling a damper between the limb and ground is investigated at some length.
The major conclusion of this work is that this class of models is not tenable. For it to be a viable model would require violating the properties of damping elements. This casts doubt on previous work in the field which assumed a model of this structure.
In chapter two, a brief summary of the relevant literature regarding motion control based on attractor trajectories is presented. Chapter three describes the experimental data available for this work as well as the processing algorithms used. Chapter four reviews the results of testing the competence of the two simplest models- the ones which most easily lend themselves to parametrization based on isometric data. Chapter five discusses the results and suggests future work to test more complex models.
Chapter 2: Theoretical Background of the Equilibrium Point Hypothesis
Alpha and Lambda Hypothesis
The theory that that the spring-like properties of muscles led to stable postures which could be used for motion control was first put forth by Feldman and colleagues (Feldman, 1966, 1986), who formulated it in a version now known in the literature as the
'lambda hypothesis'.
The lambda hypothesis relies heavily on the reflex loop to generate the equilibrium phenomenon. In essence, it states that a) the stretch reflex threshold is an independent measure of central commands descending to alpha and gamma motor-neurons b) the nervous system uses the stretch reflex to perform movements and c) muscle together with reflex and central control mechanisms behave like a nonlinear spring, the zero length of which is a controllable parameter. (Feldman, 1986). When the zero lengths of agonist and antagonist muscles (and the associated reflexes) about the same joint are changed, the force-length relation of each muscle is shifted and the position of the joint at which they balance is changed (see figure 1).
Two major criticisms of this model have been cited. First, the inherent
propagation delays in the reflex loop would likely lead to instability if the gain of the reflex loop was sufficient to produce the impedance commonly observed, and second,
experiments done with deafferented animals have shown that they are still capable of stable motions.
a
c
..L
S length x
Figure 1: The 'lambda hypothesis': (Taken from Feldman, 1986). The Torque vs. length curves show that torque produced by an agonist or antagonist at a given position can be modulated by shifting the rest length of the muscle. The experimental subject was able to move one joint, which was connected to a servo motor. The limb was placed at a given position and held against a constant torque. The torque was then suddenly reduced. The subject was told not to intervene, and the final angle of the limb was
measured. Each curve represents a series of experiments with the limb starting at the black dot and moving to the different open dots as the torque was lowered by different amounts. All torque length curves were found to be repeatable and further to have the same shape (referred to as an "invariant
characteristic") even when shifted. The dotted line represents passive muscle forces. The point where one curve meets the curve of passive forces allows the determination of X on the scale of muscle lengths
An alternative hypothesis, referred to by Feldman as the 'alpha hypothesis' was developed by Emilio Bizzi and colleagues (Polit, 1979). This theory states that
equilibrium can be shifted by altering the impedance of the muscle directly via the alpha-motor-neurons. This is a result of impedance (apparent stiffness and viscosity) changing with the level of activation. Muscles are arranged about joints in agonist/antagonist pairs. By changing the slope of the force-length curves of agonists and antagonists, the system can change the position of the joint at which the forces balance. Likewise, by co-contracting both agonist and antagonist, the same posture can be maintained while increasing stiffness about the joint (see figure 2). Critics of the 'Alpha' model generally point to the fact that it makes no direct prediction about EMG activity, therefore making it
0o W tV. Angle U
B
anragonzs
1o Angle 0
Figure 2: The 'alpha hypothesis': (taken from Won, 1983) The torque vs. length curves show (in a simplified version) that torque produced by an agonist or antagonist at a given length can be modulated by increasing or decreasing the stiffness of the muscle. Agonist curves start on the left. Antagonist curves start on the right and are made positive so their point of intersection with the agonist curve can be seen. A: By changing the stiffnesses of the opposing muscles (from the solid lines to the dotted lines) one can change the equilibrium position about the joint. B: By changing the stiffnesses of the opposing muscles (from the solid lines to the dotted lines) one can keep the same position and change the stiffness about the joint
The debate between 'alpha' and 'lambda' has not yet been settled. A distinct possibility is that the truth lies somewhere in the middle, with impedance modulated equilibrium being fine tuned or 'conditioned' by afferent feedback (Hogan, 1997).
It was originally assumed that motion could be performed by instantly shifting the equilibrium point and having the limb follow as soon as its dynamics would allow. An experiment performed by Bizzi, Hogan, and colleagues (Bizzi, 1984) showed that it was more likely that there was in fact a continuous transition of the equilibrium point from start to end position.
The experiment consisted of training a monkey to point at a series of illuminated panels (see figure 3 for experimental setup). The animal's upper arm was immobilized and its lower arm attached to a torque motor and position sensor. A cover prevented the animal from seeing its own arm. The animal was trained to point at a light until it went out and another lit, at which point it was to shift its arm to point to the new target.
Figure 3: Experimental setup for monkey experiment (taken from Polit, 1979)
After it had been trained, the animal was deafferented, depriving it of
proprioceptive feedback from the upper limb. The experiment was then repeated. In a variant of this experiment, however, the arm was servoed to the second target while the first target was still lit and held there. The animal was unaware of this due to the lack of afferent feedback. The second light was then lit, and the arm released.
Surprisingly, the arm started to move back towards the first target before turning around and finishing at the second target. This data was interpreted to mean that the
equilibrium position was still moving from the first to the second target at the time the limb was released from the second target. From this experiment came the concept of the "virtual trajectory" or "equilibrium point trajectory", the time history of the attractor point during a motion.
The Equilibrium Point Hypothesis in Motor Control
The Equilibrium Point hypothesis is a highly controversial theory. One of the major criticisms is that there is no recordable physiological phenomenon related to the proposed "Equilibrium Point" that attracts the limb, so it is impossible to either prove or disprove as a hypothesis (Smith, 1991). However, work by Bizzi and colleagues (Giszter, 1993) shows that the limb at least demonstrates stability properties which must be
explained in some manner.
One test that has been applied to test the theory is to examine the "virtual" and "actual" trajectories for the same movement and to see which is more complex. It is generally assumed that if the theory is valid, the virtual trajectory should be simpler than the actual trajectory, which will be modified by the dynamic effects created by moving the limb. If the virtual trajectory were in fact more complex, then there would be no
computational advantage to using it rather than computing the inverse dynamics for the move directly (Hodgson, 1994, Uno, 1993).
The typical approach to applying this test has been to model the impedance
between the attractor point and the limb and between the limb and ground. This has been done in both the single joint (Hogan, 1984) and multi-joint (Flash 1987) case by assuming
a model with an elastic element between the limb and the attractor point and a viscous element between the limb and the ground reference frame. Both concluded that there was
good evidence that actual motions could be reproduced using relatively simple virtual trajectories.
These results, however have been widely challenged. Kawato and colleagues (Katayama, 1993) cite the unnaturally high values for the elastic element in the model used by Flash. They instead used the empirically measured values for dynamic stiffness
reported by Bennett and colleagues (Benett, 1991) and calculated a virtual trajectory far more complex than the actual motion. Gribble and colleagues countered that if a more complex and physiologically plausible model of muscle and its associated neural anatomy
was used, including afferent feedback, a simple virtual trajectory control signal could be obtained from the same data (Gribble).
Hodgson attempted to estimate the path of the virtual trajectory without model-based assumptions by providing the necessary inertial forces to move the limb with a small robotic arm. This meant that no force was being applied by the impedance element
between the attractor point and the limb and the path of the limb tracked that of the attractor point. He found that in general the path of the equilibrium point was no simpler than that of the limb itself. However, his estimates of the profile of the virtual trajectory
were also very different from those calculated by Kawato et al (Hodgson, 1994). Different sources have brought forward evidence both for and against the assumptions of high stiffness in motion. It is not reviewed in detail in this work since it
will be shown in chapter four that the structure of the model is untenable regardless of parameters.
In a later work, Won (Won, 1993) attempted a similar modeling based on a virtual trajectory with both an elastic and damping element between the virtual and actual
trajectories. Chapter five will briefly the difficulties in obtaining the virtual trajectory needed to predict motion from such a model from isometric data.
It should be noted once again that the use of attractor trajectories for motor control is still highly debated. Kawato and colleagues (Uno, 1989) have proposed an alternate hypothesis based on the minimization of torque change over the course of the movement. This would make an equilibrium based model unnecessary as there would be no computational advantage if the torques had to be directly computed.
Lackner and Dizio (Lackner, 1994) have brought a significant objection to the entire notion of the equilibrium point hypothesis by noting that when placed in a spinning
room, subjects attempting to reach a point will end up with a steady state error which does not appear when the room is not rotating. This should not be the case in an equilibrium point model as the Coriolis force driving the limb away from its target should go to zero at
steady state when the limb is not moving'
In this work, it is generally assumed that there is some validity to the equilibrium hypothesis and concentration is placed on what specific form of the model will give the best convergence with observed data.
1 Coriolis forces are proportional to the product of the velocity of the moving object and the angular velocity of the reference frame in which they are moving. At steady state, the velocity of the limb goes to zero, as should the Coriolis force
Chapter 3: Experimental data available and data processing Experimental Data Available
Experimentally, it has been shown by Emilio Bizzi and colleagues (Giszter, 1993), that microstimulation of the lumbar spinal cord of a decerebrated frog preparation will in the majority of cases cause the hind limb to converge to a stable posture within the frog's reach. It has been shown that it is extremely unlikely that this tendency of the limb to develop a stable point of equilibrium upon stimulation is random, but rather that it is likely an integral part of the neural control system (Loeb, 1995, Giszter, 1993, Bizzi, 1995).
Several experiments were undertaken to determine the location of these
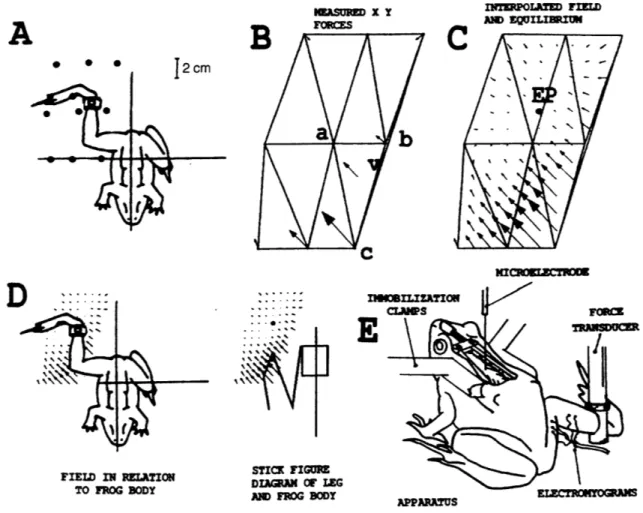
equilibrium points. The nature of the experiment was to clamp the ankle of the frog in a fixed location with a force transducer. The spinal cord was then stimulated electrically with a pulse train and the isometric force measured in both the x and y (orthogonal horizontal axis) directions. This was repeated at nine locations within the frog's workspace (see figure 4 (Giszter, 1993)).
INTRmPOLATD FIED ANM EQILIEIUM KInIoEKCTRnO FIELD IN RELATION TO FROG BODY
%
r"
STICK rFIRE DIAGRAM OF LEG AN FROG BODYFigure 4- Experimental Setup (taken from Bizzi, 1995) A: Orientation of frog preparation B: Measured
force vectors C: Force vectors interpolated between measured locations and calculated location of
equilibrium point D: Field in relation to frog body and stick diagram of leg and frog body E: Experimental
setup- Note that our setup, unlike his, did not include an electromyogram recorder
Forces between measured points were linearly interpolated and the equilibrium point was defined to be the point at which both the x and y forces were zero. Giszter reported that as stimulation proceeded, the equilibrium point moved smoothly from
A
* * * ,KmSUI~ X Y TmoTn
di. APPARATUS m Wrmulbit's prestimulation value to a spot within the reach of the frog. This motion of the equilibrium point during the course of (and after) stimulation was referred to as an equilibrium trajectory. He further reported that when the limb was released (i.e., not held isometrically) it's actual trajectory generally followed this 'virtual trajectory'.
Experiments similar to those reported in (Bizzi, 1995) are currently being repeated by Dr. Michel Lemay in the Newman laboratory. Each frog is spinalized. Microelectrodes are then inserted into the lumbar region of the spinal cord. The time varying isometric field of forces is then measured using the method described above. Several free motion trajectories are also recorded for each frog. A typical field for a frog is shown in figure 5 (Lemay, 1996) The field shown is the maximum force at each location over the course of stimulation2 (and linearly interpolated points in between in space). Three trajectories when the limb is released from different spots are also shown. The vectors represent the magnitudes and directions of the forces. The three curves represent measured free limb trajectories.
2 On average, the maximum force at each point was reached 0.45 seconds after onset of stimulation. The
40 60 E E 0 CL 8 80 100 192 ; \ . I \ \ \ \ \ \ I Newton IN
'Ilk
'1. 11-4
Il
-. ~---I I 0 20 40 60 80 100 x position (mm)Figure 5: A typical force field for a frog. The field shown is the maximum force at each location over the course of stimulation (and linearly interpolated points in between in space). The vectors represent the magnitudes and directions of the forces. The three curves represent measured free limb trajectories (starting at the x's). The asterisk is the Equilibrium Point (where the x and y forces would go to zero)
Seventeen trajectories were available, measured from two frog preparations. The relevant parameters for each are shown in Table 1. The force data was measured at 50 Hz with an ATI Industrial Automation force transducer with a precision of 0.02N. The trajectories were measured by connecting the limb to a small, 2 link mechanism with no actuators but the ability to measure its position based on 1% accuracy linear Bourns potentiometers at the joints . Position data was gathered at 997 Hz.
Table 1: Trajectory information
Trajectory Frog Number Force Field Date Stimulation Stimulation Stimulation Length of
Number Number pulse width pulse Frequency Stimulation
amplitude
1 1 ffl4 5/27/96 variable 5gA 40 Hz 300 msec
2 1 ff14 5/27/96 variable 5tA 40 Hz 300 msec
3 1 ffl6 5/29/96 0.5 msec 5tA 10 Hz 500 msec
4 1 ffl6 5/29/96 0.5 msec 5gA 10 Hz 500 msec
5 1 ff16 5/29/96 0.5 msec 5tpA 10 Hz 500 msec
6 1 ff16 5/29/96 0.5 msec 5gA 10 Hz 400 msec
7 1 ff16 5/29/96 0.5 msec 5pA 10 Hz 400 msec
8 1 ffl6 5/29/96 0.5 msec 5pA 10 Hz 400 msec
9 1 ff17 5/30/96 0.5 msec 5gA 40 Hz 300 msec
10 1 ff17 5/30/96 0.5 msec 5gA 40 Hz 300 msec
11 1 ffl7 5/30/96 0.5 msec 6pA 40 Hz 300 msec
12 1 ffl7 5/30/96 0.5 msec 6gA 40 Hz 300 msec
13 1 ffl7 5/30/96 0.5 msec 7pA 40 Hz 300 msec
14 1 ff17 5/30/96 0.5 msec 7.tA 40 Hz 300 msec
15 2 ff22 6/10/96 0.5 msec 5pA 40 Hz 400 msec
16 2 ff22 6/10/96 0.5 msec 5.tA 40 Hz 400 msec
17 2 ff22 6/10/96 0.5 msec 5.tA 40 Hz 400 msec
Processing of Force Data
Several different types of forces need to be distinguished in these experiments.
Those directly measured are isometric forces at a given location at sampled intervals of time. The software used for this thesis interpolates linearly between these data points in both space and time, giving an approximation of what forces the limb would be exerting if
held at a given position in space at any given time (i.e., Fisometric(space,time)).
From these forces, it is possible to calculate the equilibrium point at any given time, as the location at which the force in both the x and y direction go to zero. This defines an equilibrium trajectory as a function of time which can be compared to the actual motion of the limb when released.
Both the trajectories and the measured forces were in general extremely repeatable
trajectories measured using nominally the same starting point on the same frog with the same stimulation parameters. Part A shows the trajectories separately. Part B shows the extreme points for each time sample. The dashed lines connect points from the same time sample. Part C shows the distance over time of between the two extremes shown in part B. The sum of this distance at each time point divided by the number of time points yields an average distance of approximately 2.4 mm.
Figure seven shows multiple measurements of the time course of the force magnitude using the same location for the same frog with the same stimulation
parameters3. The sum of the difference between the minimum and maximum force at each time point, divided by the number of time points, yields an average range of approximately 0.06 Newtons.
5 50 55 60 65 70 75 80 85 90 x position (mm) B 50 55 60 65 70 x position (mm) 75 80 85 90 M 0 0.2 0.4 0.6 0.8 1 1.2 1.4 1.6 Time(sec)
Figure 6: Three trajectories measured using the same starting point on the same frog with the same stimulation parameters (starting at the x's). Part A shows the trajectories separately. Part B shows the extreme points for each point in time. The dashed lines connect points from the same time sample. Part C shows the distance over time of between the two extremes shown in part B. On average, there is a
difference of approximately 2.4 mm.. 80 S85 E0 0. > 90 95 -E 85 0 S90 95 45 "I I( 'II
40 30 (o E 20 E 0 > 10 0 0.0 0.2 0.4 0.6 0.8 1.0 time (sec)
Figure 7: Multiple measurements of the time course of the force magnitude using the same location for
the same frog with the same stimulation parameters.
In order to get velocity and acceleration, the trajectory data was digitally
differentiated. The finite difference method was used followed by low pass filtering with a 100th order filter with a cutoff frequency of 10 Hz4 The effectiveness of this filter is shown in figure 8. Part A shows the step response of the filter. Part B shows the magnitude of the velocity obtained by differentiating the three trajectories from figure 6 (which were obtained using supposedly identical experimental conditions). Part C shows the magnitude of the acceleration obtained by differentiating again and reapplying the filter. The average range of the calculated velocity for any given time sample is 13.4 mm/sec. The average range of the calculated acceleration for any given time sample is 237 mm/sec2.
4 The filter used was generated with the 'firl' command in MatlabTM . It followed the windowing method with a hamming window. The filter itself was an implementation of Program 5.2 in the IEEE programs for digital signal processing tape.
300 400 500 600 700 800 900 B I.
t I
I Ci S': -I,I I I: II IlI. Time(sec) C Time(sec)Figure 8: The effectiveness of the low pass filter used after differentiation: Part A shows the step response of the filter. Part B shows the magnitude of the velocity obtained by differentiating the three trajectories from figure 6 (which were obtained using supposedly identical experimental conditions). Part
C shows the magnitude of the acceleration obtained by differentiating again and reapplying the filter. As
can be seen, the velocities and accelerations are very similar
II I · · · · I r r I r I r 0 100 200 1000
One difference between these experiments and those previously reported is the lack, in general, of a smooth path of the equilibrium point during the course of (and after) stimulation from the starting point to a stable equilibrium, and then back to the 'passive' position (Giszter, 1993). In fact, for 75% of reported trials, actual and virtual paths were reported to differ by less than 8mm (in a work space of around 500 square mm) in
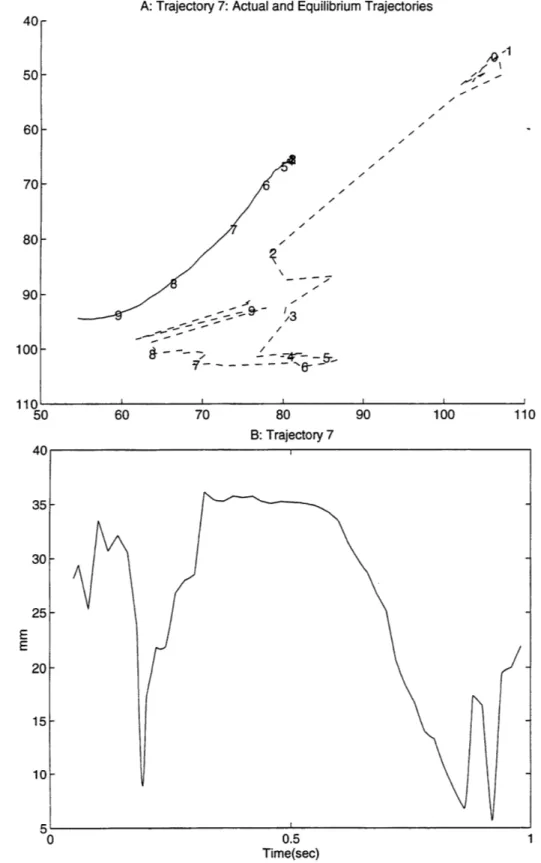
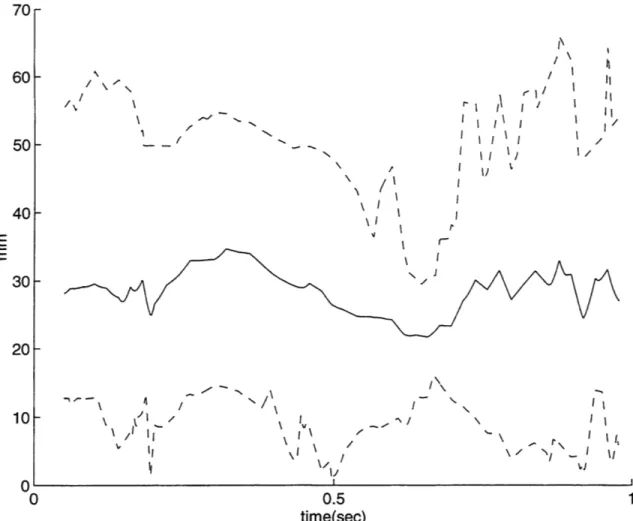
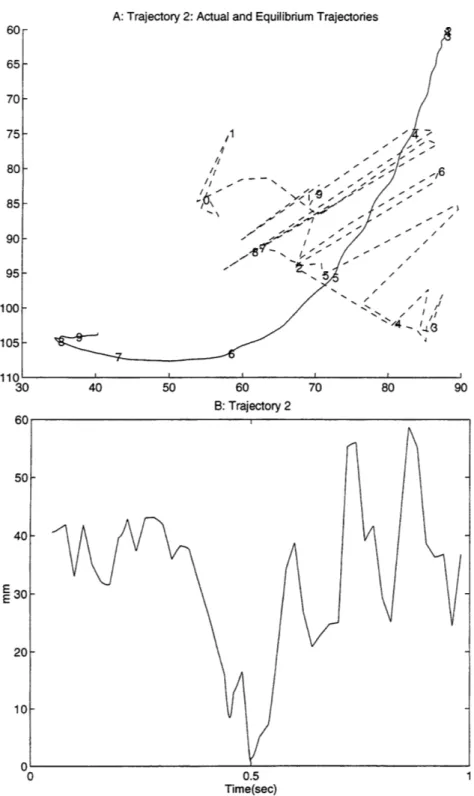
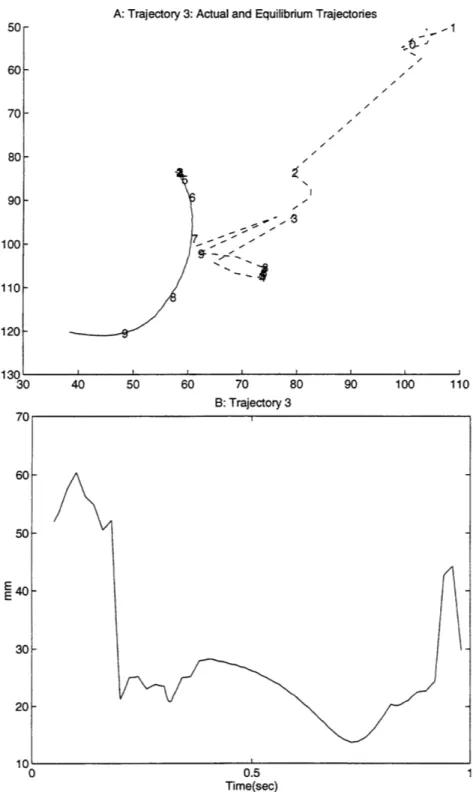
previous work (Giszter, 1993). Even when smoothed5, the path of the equilibrium point in the current data shows significant deviation from that of the free limb trajectory. Figure 9 shows a typical example of the distance, from the actual position of the limb to where the equilibrium point is calculated at that time. Part A shows the actual (solid) and virtual (dashed) trajectories, each marked off in increments of 0.1 seconds. Part B shows the magnitude of the distance between the two over time. Similar plots for all 17 trajectories are included in appendix 2. Figure 10 shows the minimum, maximum, and average distance over time between the actual and virtual trajectories for all 17 trajectories (average is solid, minimum and maximum are dashed).
5 The path of the EP is linearly interpolated between times when its value can be calculated. If there is no initial EP calculated, it is assumed that the EP starts at the first place one appears. If there is a time segment where no EP is calculated, the previous and subsequent time samples are spatially averaged. If there is no EP calculated at the end of the data, it is assumed the EP stays at its last calculated position
A: Trajectory 7: Actual and Equilibrium Trajectories Ad '-I E "/ 8/ 80 B: Trajectory 7 0.5 Time(sec)
Figure 9 shows a typical example of the distance over time for a trajectory, from the actual position of the
limb to where the equilibrium point is calculated at that time. Part A shows the actual (solid) and virtual (dashed) trajectories, each marked off in increments of 0.1 seconds. Part B shows the magnitude of the distance between the two over time.
140 50 60 70 80 90 110 50 100 14U 35 30 25 20 I · · · · · V-rr\ -~ E -"" - - - - Ne " -F; -L -E
60 50 40 E E 30 20 10 r1 r I fl r\ I I r I/ 1 \ / I'I \ I I/ Il I \I r \ /I Il \ I /\I \I II I II Ii I . ' 4 I., 0.5 0 0.5 1 time(sec)
Figure 10 shows the minimum, maximum, and average distance over time between the actual and virtual
trajectories for all 17 trajectories (average is solid, minimum and maximum are dashed).
For each available trajectory, the average (over time) and standard deviation of this error was calculated. This data is summarized in Table 2. If the limb in fact followed closely to the virtual trajectory, it would be possible to predict movement by simply predicting the motion of the EP. The large errors, relative to the length of the frogs leg (around 12 cm total on average- roughly the same as those used in (Giszter, 1993)), underscore the need to create a model that takes the dynamics of the limb into account.6
6 It is unknown at this point why such a large discrepancy was obtained with past results. It could be
related to a change in experimental protocol. In (Giszter, 1993), the limb was suspended in a sling from the ceiling, whereas in Lemay's work, it was not.
Table 2: Distance between actual limb position and calculated equilibrium point
Trajectory Average of distance Standard deviation of
between actual limb position distance between actual limb and calculated equilibrium position and calculated point (over time) in mm equilibrium point in mm
1 27.5 11.6 2 32.7 12.4 3 28.1 12.5 4 27.6 10.5 5 21.9 9.1 6 26.5 14.7 7 26.0 9.0 8 20.0 8.5 9 27.2 11.9 10 32.4 15.4 11 32.2 13.7 12 36.3 12.3 13 30.9 12.9 14 36.1 12.2 15 19.8 8.4 16 31.0 15.9 17 29.1 12.0 Average 28.5 11.9
From measured trajectories and knowledge of the inertial properties of the limb, it is also possible to perform inverse dynamic calculations to determine the forces required to drive the limb along that trajectory (i.e. Finertial(trajectory,time)).
Inertial data for the frog leg (masses, lengths, etc.) were taken from actual post operative measurements. It was assumed for the purposes of this project that the frog leg consisted of a two bar mechanism, with each bar consisting of a homogenous cylinder at the density of water. The lengths and masses of the cylinders were taken from the upper and lower shanks of the leg. Table 3 shows the lengths and masses for each frog.
Table 3: Inertial Parameters of Frog legs
Length of upper Mass of upper Length of lower Mass of lower
shank (cm) shank (grams) shank (cm) shank (grams)
Frog 1 6.5 43.0 6.2 16.0
Frog 2 6.0 39.0 4.5 14.0
The software written for this project (using the MatlabTM programming language) allowed for both calculation of accelerations given torque functions (forward dynamics) and torques given accelerations (inverse dynamics). Both were calculated using the general form:
t = I(0) + C(,o) (1)
where t is the vector of joint torques, I is the position dependent inertia tensor, 0 is the vector of joint positions, co is the vector of joint velocities, x is the vector of joint accelerations, and C is the vector of nonlinear centripetal and Coriolis forces.
Several factors could effect the accuracy of inverse dynamic calculations. One source of potential error is inaccuracy in the measurement of the trajectory. Figure 11 a shows the magnitudes of the inertial forces required to move the limb through the three trajectories in figure 6a. The average range of calculated forces for any given time is 0.05 Newtons.
Two other possible sources of error in the calculation of inertial forces are
mismeasurements of the geometry or the inertial properties of the frog leg. To get an idea of the range of errors likely as a result of a plausible mismeasurement, inverse dynamic calculations were performed using a trajectory obtained from one frog but using either a) the limb lengths or b) the limb masses from a different frog in the calculations. Figure 1 lb
shows the calculated inertial forces under three different assumptions, with the solid line representing the calculation using all the parameters from the correct frog, the dashed line using the limb lengths from a different frog and the dash-dotted line using the limb masses from a different frog. The average range of forces for any given time is 0.03 Newtons.
To be conservative, the greater of the two possible error sources is assumed for the rest of this work, and a range of 0.05 Newtons is taken into account in the calculations in chapter 4 of this thesis.
0 z 0 U. Time(sec) B U.U 0.0 o C 0 z 0) UR LL. 0.0 5 Time(sec)
Figure 11 A: Shows the magnitudes of the inertial forces required to move the limb through the three trajectories in figure 6a. As can be seen, they are very similar, as they should be considering the similarity of the original trajectories. B: Shows the calculated inertial forces under three different assumptions, with
the solid line representing the calculation using all the parameters from the correct from, the dashed line using the limb lengths from a different frog and the dash-dotted line using the limb masses from a different frog.
Another source of potential error in the calculation of inverse dynamics is the introduction of bias. The nonlinear matrix in equation (1) represents centripetal and Coriolis forces. The terms accounting for centripetal forces include functions of angular velocity squared for a given joint (i.e. t 2, where o, is the angular velocity of the nth joint and n is either 1 or 2). The terms accounting for Coriolis forces include functions of the angular velocity of one joint multiplied by the angular velocity of the other (i.e. 0t *0, where o~ is the angular velocity of the nth joint). Because of this nonlinearity, an evenly distributed error about a nominally measured angular velocity will result in calculated Coriolis and centripetal forces which are biased towards larger magnitudes.
The problem is demonstrated in figure 12, where angular velocity (omega) is plotted against angular velocity squared. On the horizontal axis, a nominal value for omega is marked as well as points evenly spaced by some delta to each side. As can be seen, the regular distribution in angular velocity one the horizontal axis maps to a biased distribution in angular velocity squared on the vertical axis.
omegeO
Angular velocity versus Angular velocity squared
AnWAW ve"cx
Figure 12: Angular velocity (omega) is plotted against angular velocity squared. On the horizontal axis,
a nominal value for omega is marked as well as points evenly spaced by some delta to each side. As can be seen, the regular distribution in angular velocity on the horizontal axis maps to a biased distribution in angular velocity squared on the vertical axis.
To estimate the bias introduced, a typical value of angular velocity was obtained by averaging the magnitudes of the angular velocities of the trajectories in figure 6a (which
came to 0.6 rad/sec). The bias was then calculated as the ratio of the average of this nominal velocity plus some delta7 squared and minus the same delta squared to the value
of the nominal velocity itself squared. That is:
bias= (omega(nominal) + delta)
2+ (omega(nominal) -delta)2
2*omega(nominal)2
7 The average range of velocity error (as shown in figure 8) is 13.4mm/sec and frog shank lengths (as
shown in table 3) are on the order of 62mm. A reasonable estimation of error range in angular velocity is linear velocity error / shank length. This yields a range of 0.22 rad/sec or +/- 0.11 rad/sec. 0.11 rad/sec was used for delta in this case.
The estimated value for the bias yielded by this method was 1.03. Due to the complex and nonlinear nature of the dynamic equations, it is not immediately clear how the introduction of a bias factor will affect the calculation of inertial forces. To be
conservative, calculations in chapter 4 will be done both with this nominal value of bias and assuming no bias at all. It will become obvious that bias has no relevant effect for this data.
The software used a fixed step numerical integrator for the forward dynamics and utilized routines to convert from Cartesian to joint space (and vice versa) for the 2 link
mechanism representation of the frog's leg. The software was tested using simple physical examples of two-bar mechanism motion, conservation of energy, and other tests (see appendix 1).
Chapter 4: Testing Potential Models
Modeling Goal
The purpose of the proposed model is to represent the dynamic behavior of the frog leg with a relatively simple mechanical analog. The requirements for such a model include the ability to predict free-limb motion based on a knowledge of the inertial parameters and measured isometric forces.
Such a model is necessary to both verify the basic concept of controlling limb movement based on an attractor trajectory and to simulate possible control algorithms without having to run an experiment for each potentially required movement.
Possible Models
There are several configurations one could envision to represent the impedance relating the limb, the attractor point, and ground. The limb itself is an inertia. In the spirit
of the equilibrium hypothesis, it is assumed that there is some 'desired' or 'rest' position for the endpoint of the limb. There is also a ground reference frame as there is in any mechanical system. Possible mechanical elements to connect these three include elasticities (elements that produce a force proportional to their displacement) and viscosities (elements that produce a force proportional to their rate of change of
displacement). Both elasticities and viscosities can be either linear or nonlinear. They can also be arranged in multiple combinations.
Several of these combinations are shown in Figure 13 where M represents the inertia of the limb, springs represent elastic components (possibly nonlinear), dashpots
represent viscous components (again, possibly nonlinear), and Xd is the attractor point. Note that the models shown are one dimensional representations of what is actually a two dimensional system.
Xd
Xd
Xd
Xd
5. 6.Xd
Xd
Figure 13: Diagram representing the structure of some possible models
Testing Model one
To test model one, I compared magnitudes of Fisometric(space,time) and Finertial(space,time) for a series of trajectories. For each trajectory, the average of Fisometric and Finertial (as well as their ratio) was calculated. A typical example of the time course of Fisometric(space,time) and Finertial(trajectory,time) is shown in figure 14. The dashed line in figures 14c and 14d represents the magnitude of the isometric force.
The confidence band shown around it represents the expected error range as calculated in chapter 3. Likewise, the solid line represents the magnitude of the inertial force. The small size of the confidence band surrounding the inertial force plot makes it hard to see on the scale of the graph. Figure 14d is the equivalent to figure 14c with the exception that the bias factor calculated in chapter 3 is used in calculating the inertial forces in 14d but not in 14c. Similar plots for all 17 trajectories are included in Appendix 2.
A:Taetry1 :Tajcoy1 82 84 86 ,88 E E 0 90 0 92 94 96 98 82 84 86 E £90 r92 94 In 45 50 55 60 65 70 75 80 85 90 45 50 55 60 65 70 75 80 85 90 x-pos (mm) x-pos (mm) C: Trajectory 16 D: Trajectory 16 1 z S0.5 0 L. n I -II \ II/ I \ III \\\ r,\ \l -I II \\li i II I II -II -I ,, ,,,. / iII III I /*,/ II I11 II Ilt I Ii I/• * I \ II /I I , , - " _ , 0 0.1 0.2 0.3 0.4 0.5 0.6 0.7 0.8 0.9 1 time(sec)
Figure 14: Example of the time course of Fisometric(space,time) and Finertial(trajectory,time). Part A:
Trajectory marked off in 100 msec increments with vectors representing directions and magnitudes of Fisometric(space,time) Part B: Trajectory marked off in 100 msec increments with vectors representing directions and magnitudes (scaled larger than part A so as to be visible) of Finertial(trajectory,time) Part C: Magnitude of Fisometric(space,time) (dashed) and Finertial(trajectory,time) (solid) vs. time.
Confidence bands are included for both based on the estimated errors from chapter 3. Note that Fisometric at all times and places is MUCH larger than what would be needed to actually accelerate the limb along the trajectory (Finertial) Part D: Same as part C but with inertial forces calculated with bias factor from chapter 3
50 5 0 5 7 7 8 85 90 45 50 55 0 5 0 7 8 8 9
0
U-B: Trajectory 16
The ratio of the average isometric force to the average inertial force in Figure 14c is 42.6. Taking the extreme case of using the minimum edge of the confidence band for the isometric forces and the upper edge of the confidence band for the inertial forces, the ratio of the average isometric force to the average inertial force is still 26.1. For the data using the bias factor in figure 14d, the ratio of the average isometric force to the average inertial force is 41.1 (26.1 for the extreme case)8.
For each trajectory, the average isometric force, average inertial force, and their ratio were calculated. These results are shown in table four.
Table 4: Difference in Fisometric(space,time) and Finertial for several trajectories
Trajectory Average of magnitude of Fisometric (space,time) 1 0.1730 2 0.0555 3 0.6685 4 0.6471 5 0.4348 6 0.5432 7 0.4994 8 0.3448 9 0.2379 10 0.2485 11 0.3068 12 0.3042 13 0.3513 14 0.3821 15 0.2395 16 0.3497 17 0.2979 Average 0.3579 Average of magnitude of Finertial 0.0226 0.0227 0.0130 0.0112 0.0067 0.0073 0.0088 0.0077 0.0081 0.0066 0.0089 0.0087 0.0103 0.0104 0.0162 0.0082 0.0116 0.0111
8 Note that the bias has almost no effects on the results Ratio of average of Fisometric to average of Finertial 7.65 2.44 51.42 57.78 64.90 74.41 56.75 44.78 29.34 37.65 34.47 34.97 34.11 36.74 14.78 42.65 25.68 38.27
One observations is immediately obvious. Fisometric(space,time) is much larger than Finertial(trajectory,time) for almost all trajectories and all times. On average, the force being measured is between one and two orders of magnitude higher than that actually required to move the limb.
Model one (inertia connected to attractor point without any viscous elements) is clearly not a usable model. If it were, the distance from the actual position to the desired would be the sole determination of force and Fisometric would always equal Finertial in both magnitude and direction. This is not at all surprising- it would have been very odd indeed if a model incorporating no dissapative element at all were able to capture the physical behavior of the system.
Testing Model two
To test Model two (inertia connected to attractor point with elastic element, viscous element to ground), the power that would go into the hypothetical viscous
element in the model was examined. If this were a competent model, the force on the mass would be the elastic force between the desired and actual position minus viscous forces to ground (e.g. friction). That is:
Finertial(trajectory,time) = Fisometric(space,time)-Fviscosity (3)
For a given trajectory, one can calculate the power over time that would have to go into the proposed damper by taking the dot product of the velocity with Fviscosity as
calculated by equation (3)9. An example of this data is plotted as figure 15. Part A shows
the trajectory marked off in 100 msec increments. Part B shows the power that would have to go into the damper vs. time. By convention, negative power means that the damper was GENERATING energy. A line is drawn at zero on the power axis for all time. The confidence band shown around the power plot represents the combined error ranges for inertial forces and isometric forces as calculated in chapter 3. Figure 15c is the equivalent to figure 15b with the exception that the bias factor calculated in chapter 3 is used in calculating the inertial forces in 15c but not in 15b. Similar plots for all 17 trajectories are included in appendix 2.
9 Calculations were done in both joint and Cartesian coordinates for verification purposes, yielding
A: Trajectory 16 82 84 86 88 E 90 92 94 96 98 100 45 50 55 60 65 70 75 80 85 90 x-pos (mm) B: Trajectory 16 C: Trajectory 16 0.14 S, \ 0.12 0.1 0.08 P 0.06 o0.04 0.02 - --, - ---- --;/ -0.02 \ / \ / I\ I \ r I\ I I 0 0.1 0.2 0.3 0.4 0.5 0.6 0.7 0.8 0.9 1 - 40 0.1 0.2 0.3 0.4 0.5 0.6 0.7 0.8 0.9 1 time(sec) time(sec)
Figure 15: An example of power into the proposed damper in model 2 for a typical trajectory. Part A
shows the trajectory marked off in 100 msec increments, and part B shows the power that would have to go into the damper vs. time. By convention, negative power means that the damper was GENERATING energy. A line is drawn at zero on the power axis for all time. Note that the damper would in fact be generating power for part of the trajectory. The confidence band shown around the power plot represents the combined error ranges for inertial forces and isometric forces as calculated in chapter 3. Figure 15c is the equivalent to figure 15b with the exception that the bias factor calculated in chapter 3 is used in calculating the inertial forces in 15c but not in 15b.
* 45 50 55 60 65 70 75 80 85 90 0.14 0.12 0.1 0.08 Z 0.06 0.04 0.02 0 -0.02 ^^ 80
-The power was negative 12.4% of the time for the example shown in figure 15b. Values were only counted as negative if they were lower than negative one times 2% of the absolute value of the peak power (this is to eliminate the 'noise' when the power is
very close to zero). Taking the extreme case of using the upper edge of the confidence band for power, it is still negative for 9.2% of the time. For the data using the bias factor in figure 15c, the percentage of time power was negative was identical to the non-biased case up to 4 significant figures for both the normal and extreme case. The percentage of time that the damper would be generating power for each trajectory is shown in table 4. Table 4: Model-2- Power flow through hypothetical damper for several trajectories
Trajectory Percentage of time hypothetical damper
would be generating power
1 24.4% 2 37.8% 3 6.8% 4 9.2% 5 5.6% 6 14.8% 7 5.1% 8 1.3% 9 15.6% 10 0% 11 12.5% 12 0% 13 6.7% 14 10.4% 15 15.9% 16 12.4% 17 16.3% Average: 11.5% Standard Deviation: 9.4%
The data shows that for a significant portion of the trials tested, the proposed damper is GENERATING power for some portion of the trajectory. For Model 2 to be valid, it is essential that the damper to ground be passive- it cannot generate power. It is therefore clear that any model based solely on damping to ground (e.g. friction) to
accommodate the difference between Fisometric(space,time) and Finertial(trajectory,time) cannot work.
Several other models are shown in figure 13, but all have an element in common- a viscous element between the attractor point and the inertia. As shown in the next section, this makes it difficult to determine the location of the attractor point and the values of the impedances based on present data.
To summarize, the power argument has shown that any model relying solely on a viscous element to ground (e.g. friction) for energy dissipation cannot work. The data does not show whether damping to ground will get within allowable tolerances of matching the simulated velocity profile to the actual for a working model.
Chapter 5: Future Work, Discussion
Future Work
With the exception of the two models from Figure 12 examined in chapter 4, all other models shown involve a viscous element between the attractor point and the limb. This raises a subtle but critical issue. If the impedance between the ankle and the attractor point is dependent on their relative velocities, it is impossible to determine the path of the attractor point from isometric force trials without assuming knowledge of the stiffness and damping parameters. Notice that I distinguish between "equilibrium point" which is where the statically measured forces go to zero and "attractor point" which is where the forces would actually be zero during motion. The "attractor point" cannot be directly measured in isometric experiments.
This can be seen in a linear case by looking at four data points in an isometric measurement of the force assuming that the system looks like model 3 in Figure 13. Assume that the measurements are taken at the same time in each case (time T) and hence the attractor point position (Xd) and attractor point velocity (vd) are the same in each trial. Further assume that the mass is moved to a different location (xl->x4) for each trial and Fisometric(space,T) measured (see figure 16).
Fiso(x 1,T)=k(Xd(T)-x 1)+b(vd(T)-v 1) (4a)
Fiso(x2,T)=k(Xd(T)-x2)+b(vd(T)-v2) (4b)
Fiso(x3,T)=k(Xd(T)-x3)+b(vd(T)-v3) (4c)
d,vd
xi
AU,VU
S. . xci,vd
Figure 16: Proposed Experiment: Move the mass (the limb) to four different locations. Stimulate the spinal cord and record the isometric force at the limb at some time T for each location. Xd and vd are the position and velocity of the equilibrium point which should be the same for each trial but are unknown. b and k are the damping and spring constant which should be the same for each trial but are unknown. xl->x4 are the position of the mass (the limb) which is different for each trial but is known. vl->v4 are the velocities of the mass (the limb) which is zero for each trial since the trials are isometric. Fiso(xl->x4,T) are the isometric forces at the limb which should be different for each trial but can be measured
experimentally. That leaves four unknowns at time T: Xd, vd, k and b
A
Xd,v
XX.vO-• V kW.
-- " " - AGVG
It can be seen fairly easily that it is impossible to determine both the damping coefficient (b) and the velocity of the attractor point (vd) from an isometric trial. In other words, if b is non-zero and vl->v4 are zero (i.e. the trial is isometric) the equations 4a->4d are non-linear and b and vd will always be multiplied together. Taking more measurements would not solve this, as it would still be impossible to separate out b and vd.
It will therefore be necessary to use a different method to determine the attractor trajectory. An appropriate starting point was proposed by Anthony Hodgson (Hodgson, 1994). The theory is to use an actuated robot to apply the force necessary to move the inertia. This means that no force is being applied by the impedance element between the attractor point and the limb and the path of the limb tracks that of the attractor point.
Using an actuated small animal robot and appropriate software that is being designed in our lab, it should be possible to track the attractor trajectory. A simple experimental protocol would be to
a) Stimulate the animal and track its motion
b) Use the robot to move the limb through the same motion without spinal stimulation and measure the inertial, Coriolis, centripetal, and frictional forces
c) Stimulate the animal again while applying the forces measured in (b) with the robot. Measure the force at the robot/animal interface and the new trajectory.
e) If the force measured in (d) is the same as the force measured in (c), the trajectory measured in (c) is the attractor trajectoryi". Otherwise, iterate until
convergence is reached.
Discussion
An attempt was made to model the movement of a frog limb as a result of spinal stimulation. Although no suitable model emerged, several possibilities have been
eliminated, most notably any model relying solely on damping relative to the ground frame for energy dissipation.
The major relevance of this is that it makes it extremely unlikely that an adequate dynamic model can be determined based on isometric data alone. It also throws doubt on previously published arguments both pro and con the equilibrium point hypothesis as a motor control method. Work in the past to both prove and disprove the equilibrium point hypothesis of motor control has often relied on models assuming a structure with
dissipation only to ground and examined the required complexity of a virtual trajectory control for a movement. If the model itself is incorrect, of course, then these predictions as to the virtual trajectories will be wrong as well.
Future work should most likely include experiments to directly measure the attractor trajectory by active perturbance of the limb.
10 Since the force being applied by the robot equals the force moving the limb, there is no work being done
by the impedance between the attractor point and the limb and hence no change in "length" of the impedance elements
References
Bennet, D.J. Relationship Between Stiffness and Net Joint Torque During Balistic Elbow Movement. Society of Neuroscience Abstracts, 1991, Volume 17:1029
Bizzi, Emilio, Giszter, Simon, Loeb, Eric Loeb, Mussa-Ivaldi Ferdinando, Saltiel Philippe. Modular Organization of Motor Behavior in the Frog's Spinal Cord. TINS, 1995,
Volume 18, number 10: 442-446
Bizzi, E., Accornero, N, Chapple, W., Hogan, N. Posture Control and Trajectory
Formation During Arm Movement. Journal of Neuroscience, November 1984, Volume 4, number 11: 2738-2744
Chizeck, Howard. Personal communication, 1992-1995
Feldman, A. G. Functional Tuning of Nervous System with Control of Movement or Maintenance of Steady Posture- II. Controllable Parameters of the Muscles. Biophysics, 1966, Volume 11, number 3: 565-578
Feldman, A.G. Once More on the Equilibrium Point Hypothesis (lambda model) for Motor Control. J. Motor Behavior, 1986, Volume 18, Number 1:17-54
Flash, T. The Control of Hand Equilibrium Trajectories in Multi-Joint Arm Movements. Biological Cybernetics, 1987, number 57, 257-274
Flash, Tamar, Hogan, Neville. The Coordination of Arm Movements: An Experimentally Confirmed Mathematical Model. Journal of Neuroscience, July 1985, Volume 5, number 7: 1688-1703
Giszter, Simon F., Mussa-Ivaldi, Ferdinando A., Bizzi, Emilio. Convergent Force Fields Organized in the Frog's Spinal Cord. Journal of Neuroscience, February 1993, 13(2): 467-491
Gribble, Paul L., Ostry, David J., Sanguineti, Laboissiere, Rafael. Are Complex Control Signals Required for Human Arm Movement?
Hodgson, Anthony J. Inferring Central Motor Plans from Attractor Trajectory Measurements. Doctoral Thesis. Massachusetts Institute of Technology, July 1994. Hogan, Neville. Lecture Notes for Course 'Biomechanics and Neural Control of Movement'. 1997
Hogan, Neville. An Organizing Principle for a Class of Voluntary Movements. Journal of Neuroscience, November 1984, Volume 4, number 11: 2745-2754
Katayama, Masazumi, Kawato, Mitsuo. Virtual Trajectory and Stiffness Ellipse During Multijoint Arm Movement Predicted by Neural Inverse Models. Biological Cybernetics,
1993, Volume 69: 353-362
Kearney, Robert E., Hunter, Ian W. System Identification of Human Joint Dynamics. Biomedical Engineering, 1990, Volume 18, issue 1: 55-87
Koebetic, Rudi, Triolo, Ronald, Marsolais, Byron. Muscle Selection and Walking Performance of Multichannel FES systems for Ambulation in Paraplegia. IEEE Transactions on Rehabilitation Engineering, March 1997, Volume 5, number 1: 23-29 Lemay, Michel. Personal communication and unpublished work. 1996, 1997
Loeb, Eric. Uses of Statistical Muscle Models, including a Test of an Equilibrium Point Control Theory of Spinal Cord Function in Rana Catesbiana. Doctoral Thesis.
Massachusetts Institute of Technology, May 1995.
Mussa-Ivaldi, F.A., Hogan, Neville, Bizzi, E. Neural, Mechanical, and Geometric Factors Subserving Arm Posture in Humans. Journal of Neuroscience, October 1985, Volume 5, number 10: 2732-2743
Mussa-Ivaldi, F.A., Giszter, S.F. and Bizzi, E. Proc. Natl Acad. Sci. USA 91: 7534-7538 Polit, A, and Bizzi, E. Characteristics of Motor Programs Underlying Arm Movements in Monkeys. J. Neurophysiology: 183-194
Smith, A.M., Humphrey, D.R., What Do Studies of Specific Motor Acts Such as Reaching and Grasping Tell Us About the General Principles of Goal-directed Motor Behavior? Motor Control: Concepts and Issues, DR Humphreys and HJ Freund (Eds), John Wiley and Sons, 1991:357-81.
Uno, Y., Kawato, M., Suzuki, R. Formation and Control of Optimal Trajectory in Human Multijoint Arm Movement. Biological Cybernetics, 1989, Volume 61: 89-101
Won, Justin. The Control of Constrained and Partially Constrained Arm Movements. Masters Thesis, Massachusetts Institute of Technology, February 1993.
Appendix 1: Verification of the software for integration of forward dynamics
Two fairly simple tests were conducted to verify that the software worked based on simple physical properties, one based on simplifying the dynamics to the point where the behavior could be predicted and the other on conservation of energy arguments.
To start, the dynamic properties were entered as though the two bar linkage were massless and there was a single point-mass at the end of the second link. The mechanism was given an initial velocity in both joints but no applied torque. Since the mechanism must obey the simple laws of particle physics under these conditions, the angle of
incidence when it reaches a kinematic extreme must always equal the angle of reflection. As can be seen in figure 17, this is in fact the case.
As a second test, the dynamics were set as typical for a frog leg and a constant torque of 1 mili-newton-meter was applied to each joint from 0.5 seconds to 1.0 seconds, with zero torque being applied at all other times and with the system starting at rest. The results can be seen in figure 18, where part A is the trajectory and part B is the energy of the manipulandum at each point in time as calculated by the equation:
Energy= 1/2 oT I(0)co (5)
where 0o is the vector of angular velocities, I is the position dependent inertia matrix, and T
is the transpose operator. As can be seen, the energy stays at zero until the beginning of the applied torque, rises while torque is applied, and then stays constant afterwards. As there is no dissipation in the system, this is as it should be.
2 1 0 0 -1 -2 -? -3 -2 -1 0 1 2 3 x position
Figure 17: Trajectory of a two bar linkage with dynamic properties were entered as though the two bar
linkage were massless and there was a single point-mass at the end of the second link. The mechanism was given an initial velocity in both joints but no applied torque. Since the mechanism must obey the simple laws of particle physics under these conditions, the angle of incidence when it reaches a kinematic extreme must always equal the angle of reflection. As can be seen, this is in fact the case.
160 140 120 100 20 8 7 6 5 cO 34 3 2
1
0 20 40 60 80 100 120 140 160 1 2 Time(sec)Figure 18 Conservation of Energy test. The dynamics were set as typical for a frog leg and a constant torque of 1 mili-newton-meter was applied to each joint from 0.5 seconds to 1.0 seconds, with zero torque being applied at all other times and with the system starting at rest. Part A is the trajectory of the endpoint and part B is the energy of the manipulandum at each point in time. Note that the energy is zero until the torque is applied, rises while power is put into the system, and stays constant thereafter
SI I I I
-Appendix 2: Figures
A: Trajectory 1: Actual and Equilibrium Trajectories - --/ .- ---/ --- -6 -/1 LI " . ,', ,1/ .40 45 50 55 60 65 70 B: Trajectory 1 50 40 E 30 20 10 0.5 Time(sec) 75 80 85 90
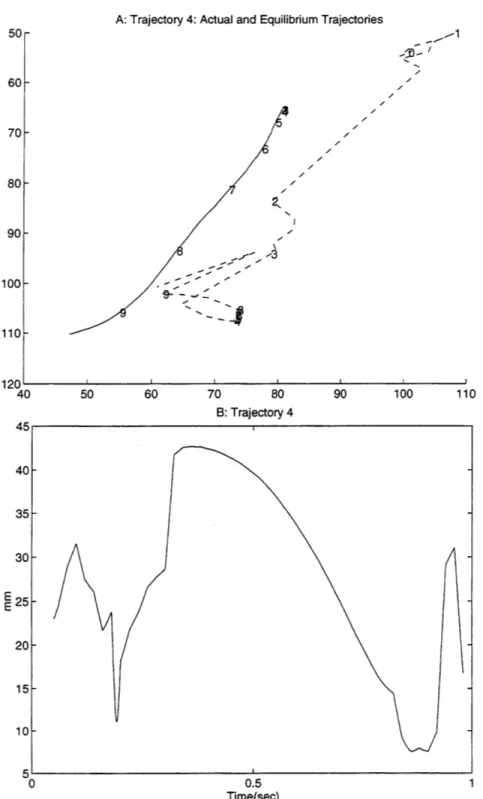
Figure 19: Distance over time for Trajectory 1, from the actual position of the limb to where the equilibrium point is calculated at that time. Part A shows the actual (solid) and virtual (dashed) trajectories, each marked off in increments of 0.1 seconds. Part B shows the magnitude of the distance between the two over time.
II // /I --I