HAL Id: hal-02509374
https://hal.archives-ouvertes.fr/hal-02509374
Submitted on 16 Mar 2020HAL is a multi-disciplinary open access archive for the deposit and dissemination of sci-entific research documents, whether they are pub-lished or not. The documents may come from teaching and research institutions in France or abroad, or from public or private research centers.
L’archive ouverte pluridisciplinaire HAL, est destinée au dépôt et à la diffusion de documents scientifiques de niveau recherche, publiés ou non, émanant des établissements d’enseignement et de recherche français ou étrangers, des laboratoires publics ou privés.
Increasing the Cytotoxicity of Ru(II) Polypyridyl
Complexes by tuning the Electronic Structure of Dioxo
Ligands
Anna Notaro, Marta Jakubaszek, Nils Rotthowe, Federica Maschietto, Robin
Vinck, Patrick Felder, Bruno Goud, Mickaël Tharaud, Ilaria Ciofini, Fethi
Bedioui, et al.
To cite this version:
Anna Notaro, Marta Jakubaszek, Nils Rotthowe, Federica Maschietto, Robin Vinck, et al.. In-creasing the Cytotoxicity of Ru(II) Polypyridyl Complexes by tuning the Electronic Structure of Dioxo Ligands. Journal of the American Chemical Society, American Chemical Society, In press, �10.1021/jacs.9b12464�. �hal-02509374�
1
Increasing the Cytotoxicity of Ru(II) Polypyridyl
Complexes by tuning the Electronic Structure of Dioxo
Ligands
Anna Notaro,a Marta Jakubaszek,a,b Nils Rotthowe,c Federica Maschietto,d Robin Vinck,a Patrick S. Felder,a Bruno Goud,b Mickaël Tharaud,e Ilaria Ciofini,d Fethi
Bedioui,f Rainer F. Winter,c and Gilles Gassera,*
a Chimie ParisTech, PSL University, CNRS, Institute of Chemistry for Life and
Health Sciences, Laboratory for Inorganic Chemical Biology, F-75005 Paris, France.
b Institut Curie, PSL University, CNRS UMR 144, Paris, France.
c Department of Chemistry, University of Konstanz, Universitätsstrasse 10, D-78457
Konstanz, Germany.
d Chimie ParisTech, PSL University, CNRS, Institute of Chemistry for Life and
Health Sciences, Chemical Theory and Modelling Group, F-75005 Paris, France.
e Université de Paris, Institut de physique du globe de Paris, CNRS, F-75005 Paris,
France.
f Chimie ParisTech, PSL University, CNRS, Institute of Chemistry for Life and
Health Sciences, Team Synthèse, Electrochimie, Imagerie et Systèmes Analytiques pour le Diagnostic, F-75005 Paris, France.
* Corresponding author: E-mail: gilles.gasser@chimeparistech.psl.eu; WWW: www.gassergroup.com; Phone: +33 1 44 27 56 02
ORCID Number
Anna Notaro: 0000-0003-0148-1160 Marta Jakubaszek: 0000-0001-7590-2330 Nils Rotthowe: 0000-0002-0073-136X
2 Federica Maschietto: 0000-0002-5995-2765 Patrick S. Felder: 0000-0003-2325-9026 Bruno Goud: 0000-0003-1227-4159 Fethi Bedioui: 0000-0002-0063-4412 Ilaria Ciofini: 0000-0002-5391-4522 Rainer F. Winter: 0000-0001-8381-0647 Gilles Gasser: 0000-0002-4244-5097
Keywords: Bioinorganic Chemistry, Cancer, DNA, Medicinal Inorganic Chemistry,
3
Abstract
Due to the great potential expressed by an anticancer drug candidate previously reported by our group, namely, Ru-sq ([Ru(DIP)2(sq)](PF6) (DIP:
4,7-diphenyl-1,10-phenanthroline, sq: semiquinonate ligand), we describe in this work a structure-activity relationship (SAR) that involves a broader range of derivatives resulting from the coordination of different catecholate-type dioxo ligands to the same Ru(DIP)2 core.
More in detail, we chose catechols carrying either donating or electron-withdrawing groups EDG or EWG and investigated the physico-chemical and biological properties of their complexes. Several pieces of experimental evidences demonstrated that the coordination of catechols bearing EDGs led to deep red positively charged complexes 1–4 in which the preferred oxidation state of the dioxo ligand is the uninegatively charged semiquinonate. Complexes 5 and 6, on the other hand, are blue/violet neutral complexes, which carry an EWG substituted dinegatively charged catecholate ligand. The biological investigation of complexes 1–6 led to the conclusion that the difference in their physico-chemical properties has a strong impact on their biological activity. Thus, complexes 1–4 expressed much higher cytotoxicities than complexes 5 and 6. Complex 1 constitutes the most promising compound of the series and was selected for a more in-depth biological investigation. Apart from its remarkably high cytotoxicity (IC50 = 0.07–0.7 µM in different cancerous cell lines)
complex 1 was taken up by HeLa cells very efficiently by a passive transportation mechanism. Moreover, its moderate accumulation in several cellular compartments (i.e. nucleus, lysosomes, mitochondria and cytoplasm) is extremely advantageous in the search of a potential drug with multiple modes of action. Further DNA metalation and metabolic studies pointed to the direct interaction of complex 1 with DNA and to the severe impairment of the mitochondrial function. Multiple targets, together with its
4 outstanding cytotoxicity, make complex 1 a valuable candidate in the field of chemotherapy research. Noteworthy, a preliminary biodistribution study on healthy mice demonstrated the suitability of complex 1 for further in vivo studies.
5
Introduction
The worldwide approval of the anticancer drug cisplatin and later of carboplatin and oxaliplatin has made platinum-based drugs the leading compounds in the field of medicinal inorganic chemistry.1,2 However, the side-effects and resistance associated
with these compounds have spurred numerous investigations into other metal-based drugs as potential chemotherapeutic agents against cancer.1,3–6 Ruthenium complexes
are presently regarded as the successors/alternatives to the aforementioned platinum compounds.7–14 Three ruthenium complexes were (i.e., NKP-1019 and NAMI-A,
Figure 1) or are (i.e., IT-139, Figure 1) in clinical trials as chemotherapeutic agents. In addition, a Ru(II) polypyridyl complex, namely TLD-1433 (Figure 1) has just entered phase II of clinical trials as a photosensitizer for photodynamic therapy against bladder cancer.15–20 Ru(II) polypyridyl complexes, have also been extensively studied for their
cytotoxicity and sowed a great potential as chemotherapeutic agents.21–28 Recently, we
reported a detailed study on a very promising Ru(II) polypyridyl complex, namely [Ru(DIP)2(sq)](PF6) (Ru-sq, Scheme 1a), where DIP is
4,7-diphenyl-1,10-phenanthroline and sq is a semiquinonate ligand.29 Semiquinonate (sq) is the product
of the first one-electron oxidation of catecholate (cat) and can be further oxidized to quinone (q) (Scheme 1b).30,31 Catechol(ate) and its redox congeners semiquinonate and
1,2-benzoquinone are pivotal examples for the class of ‘non-innocent’ ligands.32 This
definition is more appropriately referring to a pair of a metal ion and a ligand which are both redox-active and whose frontier orbitals are strongly mixed, defying an unambiguous assignment of redox states to either component.32 Catechols are also
considered as pan-assay interference compounds (PAINS) due to their chelating and redox properties.33
6
Figure 1. Chemical structures of Ruthenium complexes that were (i.e., NKP-1019 and
NAMI-A, Figure 1) or are (i.e., IT-139 and TLD-1433) in clinical trials.
Ru-sq was, to the best of our knowledge, the first Ru(II) polypyridyl complex carrying
a semiquinonate moiety, which was investigated in depth as an anticancer drug candidate. We could demonstrate that it is a valuable option as a chemotherapeutic agent, both in vitro and in vivo. Interestingly, its mechanisms of action involve more than one cellular target. This finding could potentially be a key feature to overcome resistance, which is an inherent problem for platinum-based anticancer drug candidates.29 Driven by the promising properties unveiled for Ru-sq, we undertook a
structure-activity relationship (SAR) study, keeping the same Ru(II) polypyridyl core (i.e. Ru(DIP)2), but substituting the catechol-type dioxo ligand. Over the years, many
studies have been performed focusing on the non-innocent character of different metal complexes both from an experimental and theoretical point of view.34–41 In 2006, Wada
and co-workers demonstrated how the oxidation state of the dioxo ligand in a given metal-coligand environment depends on the nature of its substituents.42 More
specifically, the authors investigated a series of [Ru(OAc)(dioxolene)(terpy)] complexes with dioxo ligands carrying electron withdrawing (EWG) or electron
7 donating (EDG) groups.42 In particular, they observed that due to the non-innocent
nature of the dioxo ligand, all complexes lie on a continuum in between formal RuII(sq)
and RuIII(cat) descriptions, with an increase of the contribution of the RuII(sq) form for
complexes with an EDG-substituted dioxo ligand and vice versa.42 Herein, we present,
a new series of complexes carrying dioxo ligands substituted with EDGs or EWGs, namely [Ru(DIP)2(3-methoxysq)](PF6) (1), [Ru(DIP)2(3-methylsq)](PF6) (2),
[Ru(DIP)2(4-methylsq)](PF6) (3), [Ru(DIP)2(4-tert-butylsq)](PF6) (4),
Ru(DIP)2(tetrabromocat) (5) and Ru(DIP)2(4-nitrocat) (6) (Scheme 1a), where DIP is
4,7-diphenyl-1,10-phenanthroline, methoxysq is methoxysemiquinonate, 3-methylsq is 3-methylsemiquinonate, 4-3-methylsq is 4-methylsemiquinonate, tert-butylsq is tert-butylsemiquinonate, tetrabromocat is tetrabromocatecholate and 4-nitrocat is 4-4-nitrocatecholate. The physico-chemical and biological properties of these compounds were investigated in depth. As described in the literature,34–41 the variation
of the electron density on the dioxo ligand leads to the modification of its oxidation state when bound as a ligand. The different oxidation states of the dioxo ligands have a strong bearing on the physical properties of the complexes, affecting, among other parameters, their electronic structures and hence the charge state. Of note, we could unveil an interesting correlation between the oxidation state of the dioxo ligand and the biological activity of the complex. Complex 1 was found to be the most promising compound investigated. Its remarkable cytotoxicity in 2D models (IC50 values in the
low nanomolar range) was confirmed in a more accurate 3D model, which led to further biological investigation. In the course of this work, we demonstrate how the mechanism of action of complex 1 involves multicellular targets. This remarkable peculiarity is considered a key factor to overcome one of the main drawbacks associated to chemotherapy treatments, which is the occurrence of resistance. Moreover, as most
8 complexes of this kind, complex 1 displays poor water solubility.43 Recently, we
reported the formation of colloids of Ru-sq and complex 1 in water-DMSO (1% v/v) mixture, which could have been easily mistaken for solutions if no appropriate characterization had been performed.43 Poor aqueous solubility is usually considered a
limitation for in vivo applications. However, in this study, we could demonstrate that with an appropriate formulation, complex 1 is able to distribute in healthy BALB/c mice, which renders it a suitable candidate for further in vivo studies.
Scheme 1. a) Syntheses of complexes 1–6. I) DIP, LiCl, DMF, reflux, 24 h, 78%; II) (i)
NaOH, 3-methoxycatechol (1), or 3-methylcatechol (2), or methylcatechol (3) or 4-tert-butylcatechol (4) 2-propanol, reflux, 24h; (ii) air, 2 h; (iii) NH4PF6, 2-propanol/H2O
(1:8), 19% (Ru-sq), 23% (1), 24% (2), 29% (3), 16% (4). III) (i) NaOH, tetrabromocatechol (5) or 4-nitrocatechol (6), 2-propanol, reflux, 24h; (ii) air, 2 h; (iii) NH4PF6, 2-propanol/H2O (1:8), 54% (5), 27% (6). b) Catecholate (cat) and its oxidised
9
Results and Discussion
Synthesis and characterization of 1–6
The synthesis of compounds 1–6 was achieved by adapting a previously reported procedure.29 Ru(DIP)
2Cl2 was obtained starting from the known Ru(DMSO)2Cl244 as
previously reported.45 This precursor complex was then refluxed under nitrogen
atmosphere with the corresponding catechol derivative in the presence of NaOH in 2-propanol overnight.29 Subsequently, the reaction vessel was opened to air for 2 h to
allow for the final oxidation step. Interestingly, oxidation of the catecholate ligand to a semiquinonate occurred only for those complexes bearing catecholate ligands with EDG groups (complexes 1–4 in Scheme 1a). When the synthesis involved catechol derivatives bearing EWG groups, neutral complexes (5, 6) were generated. The drastic change of the electronic properties of the complexes studied in this work is also reflected by their color. EDG-containing derivatives are deep red solids, while EWG-containing derivatives are blue/violet. UV/Vis/NIR spectroscopy in DMF solution (Figure 2) confirms the assignment of the EDG-substituted ligands as semiquinonates in that compounds 1-4 display a band at ca. 885-900 nm. This absorption is characteristic for ruthenium-bis(diimine) complexes containing a semiquinonate ligand and is due to a Ru(II) sq transition.46 A set of bands, which is responsible for the
visual color impression of these compounds, is found in the range of 470 to 525 nm. Based on literature data on similar compounds, this band can be ascribed to MLCT and LL’CT transitions (MLCT = metal-to-ligand charge-transfer; LL’CT = ligand-to-ligand’ charge-transfer, electron transfer between a donor and an acceptor ligand). The two neutral compounds 5 and 6 are both characterized by a broad transition at 675 nm alongside two additional bands at ca. 600 and 500 nm; both of which are responsible for their blue/violet color. Their similarity to the absorptions in the precursor complex
10 Ru(DIP)2Cl2 is underlined by its similarly convoluted absorption profile with bands at
680, 570 and 485 nm. These data are in agreement with a previous report for the Ru(bpy)2Cl2 analogue whose bands can be assigned as Ru(II) DIP transitions.47 An
overview over the characteristic absorption bands of all compounds is provided in Table S1.
Figure 2. UV/Vis/NIR spectra in DMF solution of the complexes 1-6 and their
precursor Ru(DIP)2Cl2.
The paramagnetic nature of compounds 1–4 was indirectly confirmed by their characteristically broadened 1H-NMR spectra (Figure S1). In contrast, compounds 5
and 6, whose purity was confirmed by elemental analysis, are neutral and formally diamagnetic. However, the proton NMR spectra also provided severely broadened resonances. The addition of zinc dust to the NMR tube, slightly improves the resolution
11 of NMR signals which suggests the formation of paramagnetic species in solution (Figure S1 (5) and (6)). All complexes were characterized by ESI-MS, and their purity was verified by HPLC (Figure S2) and elemental analysis.
EPR, (Spectro-)electrochemistry and Electronic Structures
The oxidation state of the catecholate/semiquinonate ligand of complexes 1–6 was further investigated by electron paramagnetic resonance (EPR) spectroscopy, cyclic voltammetry (CV), rotating disc electrode voltammetry (RDE) as well as UV/Vis/NIR spectroelectrochemistry and supported by density functional theory (DFT) calculations. Compounds 1–4 are, as obtained from the synthesis, EPR active. At room temperature, they display a rather broad, featureless, isotropic signal (Figure 3a), which becomes slightly anisotropic at lower temperatures and in the frozen glass (Figure S3). The substituents on the dioxo ligand and their positions seem to have only little influence on the locus and the distribution of the unpaired spin density. Thus, the giso values of
1.9893, 1.9891, 1.9872 and 1.9840 for 1–4, respectively, are all close to the free electron value ge of 2.0023 and differ only slightly from each other.
12
Figure 3. (a) EPR spectra of (from top to bottom) 1–4 at room temperature. (b) RDE
and cyclic voltammograms of 1 (from -2.1 to +1.0 V) at a glassy carbon electrode in DMF (1 mM) containing NBu4PF6 (100 mM) as supporting electrolyte and
decamethylferrocene as an internal standard (0.25 mM). Data were recorded versus a saturated calomel electrode (SCE) at a scan rate of 100 mV/s and recalculated versus the Me10Fc0/+ potential value (E1/2 = 0.040 V vs SCE, feature marked with * in panel b).
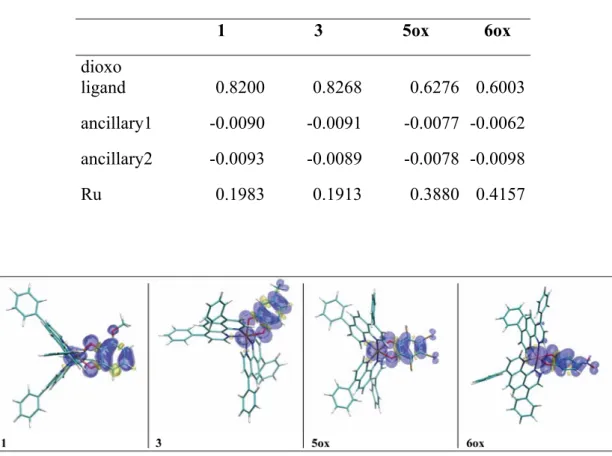
These data are also confirmed by the spin density distributions computed for compounds 1 and 3 reported in Table 1 and graphically depicted in Figure 4 (see the Experimental Section for computational details). Indeed, roughly 82% of the spin density is localized on the dioxo ligand with only limited delocalization onto the Ru center (0.19|e-|). Consequently, the computed g-tensors (reported as Table S2 in the SI) show very small anisotropies and shifts with respect to the free electron value. These results are consistent with the assumption that the 1,2-dioxo ligand can be formally represented by its semiquinonate form in the case of complexes 1–4.
13
Table 1. Computed Mulliken spin densities on the different fragments of the cationic
forms of the complexes.
1 3 5ox 6ox dioxo ligand 0.8200 0.8268 0.6276 0.6003 ancillary1 -0.0090 -0.0091 -0.0077 -0.0062 ancillary2 -0.0093 -0.0089 -0.0078 -0.0098 Ru 0.1983 0.1913 0.3880 0.4157
Figure 4. Isodensity plots of computed spin densities. Positive spin density corresponds
to blue lobes.
To further investigate the electrochemical properties of compounds 1–4 and to obtain a better insight into the effect of the substituent’s position and nature on the redox behavior of the complexes, cyclic voltammetry (CV) and rotating disc electrode (RDE) analyses were performed. Complexes 1–4 display reduction as well as oxidation features in line with what we have reported in our previous work on Ru-sq, carrying the non-substituted semiquinonate ligand.29 Figure 3 shows the RDE and cyclic
voltammograms of compound 1 while those of 2–4 are available in the SI (Figure S4). Like all other complexes bearing EDG-substituted dioxo ligands, complex 1 exhibits four well-defined reversible redox processes. The RDE experiment shows four features
14 with very similar limiting currents, which indicates that the same number of electrons are exchanged during every process. On the bases of our previous results,29 the redox
process at +0.595 V vs Me10Fc0/+ can be attributed to the oxidation of Ru(II) to Ru(III)
while the first reduction process at -0.201 V vs Me10Fc0/+ can be attributed to the sq/cat
redox process. UV/Vis/NIR-spectroelectrochemistry further supports this hypothesis. As evident from Figures 5a,b, reducing the complexes 1 or 2 at sufficiently negative potential yields spectra, whose general band structures closely resemble those of compounds 5 and 6. The observed red-shift with respect to the latter complexes is the result of the higher-lying donor orbitals (cat) and (Ru(II)), which is due to electron-rich nature of dioxo ligand in 1. Oxidation to the corresponding dications (Figure 5c,d) 1ox and 2ox (denoted as 12+ and 22+ in Figure 5) leads to a general blue-shift of the Vis/NIR
bands. The first visible transition is now found at 675 nm for both complexes. Compared to the [Ru(II)(bpy)2(q)]2+ reference, this corresponds to a red-shift by 810
cm-1.46 Adhering to the assignment of a Ru(II) diimine MLCT transition this effect
can be explained through the presence of a more extended -system in the DIP ligand as compared to bpy. We note, however, that a Ru(III)-sq scenario resulting in a dioxo ligand-to-metal charge-transfer (LMCT) is also possible. The strong electronic coupling between these two redox-active entities prohibits a clear assignment of redox states without additional experimental support or quantum chemical calculations.
15
Figure 5. UV/Vis/NIR-spectroelectrochemistry data for compounds 1 and 2.
The additional two reduction processes at the more negative potentials of -1.463 V and -1.758 V, respectively, are due to the stepwise one-electron reductions of the ancillary ligands (i. e. the DIP0/- couples). These processes were not further studied by
spectroelectrochemical investigations due to the high reduction potentials and the irrelevance of these processes to the bioactivities of these complexes. Table 2 summarizes the redox potentials associated with compounds 1–4 and compares them to those of Ru-sq carrying the unsubstituted semiquinonate ligand (see full data in Table S3 of the Supporting Information).29 Comparing the results, it is clear that the
presence of an EDG at the dioxo ligand increases the electron density on the metal center, hence shifting its redox process cathodically. These observations are perfectly in agreement with previous work from Wada and co-workers on the charge distribution between the ruthenium ion and the dioxo ligand.42 The stronger EDGs OMe and tBu
16 have the predictable effect of shifting the redox potentials of the sq/cat and RuII/III redox
couples cathodically, with however, a different ordering of these couples for complexes
1 and 4.
Table 2. Electrochemical data for 1–4 and Ru-sq.
DIP0/- DIP0/- Sq/cat RuII/III
Ru-sq* E1/2 a [V] (RDE) -1.876 ± 0.039 -1.578 ± 0.035 -0.249 ± 0.010 0.647 ± 0.018 1 E 1/2a [V] (RDE) -1.848 ± 0.015 -1.537 ± 0.008 -0.284 ± 0.005 0.595 ± 0.011 2 E1/2a [V] (RDE) -1.833 ± 0.007 -1.497 ± 0.012 -0.252 ± 0.011 0.615 ± 0.003 3 E 1/2a [V] (RDE) -1.836 ± 0.028 -1.472 ± 0.070 -0.265 ± 0.019 0.636 ± 0.011 4 E1/2a [V] (RDE) -1.839 ± 0.017 -1.515 ± 0.005 -0.271 ± 0.008 0.574 ± 0.001
* Values taken from[29] We however note that these experiments were performed on the same days. a E1/2 = half-wave.
While compounds 1-4 are easily oxidized by air, their reduction to the respective neutral forms within the cell is also feasible. The glutathione system (GSSG/2GSH redox couple) is the most abundant redox couple in a cell and therefore was selected for this experiment.48 Nearly full conversion of 1 to its neutral form could be achieved using 5
equivalents of glutathione in a 1:1 mixture of DMF and water containing 20 mM of NaHCO3 at 40°C, strongly suggesting that compounds 1-4 can at least be partially
reduced to their neutral form inside the cell (see Figure S5). Slightly alkaline conditions were thereby necessary in these experiments, most likely to either lower the oxidation potential of the thiol functional group on the cysteine building block through deprotonation or to prevent the formation of HPF6 (note that in a biological setting basic
17 amino acids or common intracellular buffers can easily serve this function). In addition, these measurements underline the charge-transfer nature of all transitions in the Vis/NIR region as all corresponding absorptions experience a blue-shift with an increase in solvent polarity; i.e., these complexes display negative solvatochromism. Remarkably, the presence of one or more EWGs on the dioxo ligand causes a distinct change in the electronic structure of the complex. The CV and RDE voltammograms of 5 are shown in Figure 6a, while the voltammograms of compound 6 are available in the SI (Figure S4). The voltammograms of 5 were recorded over two distinct potential ranges, from -1.0 V to -2.0 V and from -1.0 V to 1.0 V to avoid the adsorption of the complex on the electrode (Figure S4).
Figure 6. (a) RDE and cyclic voltammograms of complex 5 (from -2.0 to -1.0 V and
from -1.0 to +1.0 V) at a glassy carbon electrode in DMF (1 mM) containing NBu4PF6
(100 mM) as supporting electrolyte. Data were recorded versus SCE at scan rate of 100 mV/s and recalculated versus Me10Fc0/+ potential value (-0.001 V and -0.002 V for RDE
18 Complexes 5, 6 are EPR silent from 20 °C down to -150 °C which confirms that the dioxo ligand is present in its catecholate form as found by UV/Vis/NIR spectroscopy and the elemental analysis. To provide an attribution of the observed voltammetric features in the positive potential range, further EPR experiments were conducted on the monooxidized forms of 5 and 6 (5ox and 6ox, respectively, in Scheme 2). Complexes
5 and 6 were converted to their monocationc forms by treatment with an excess of
ferrocenium hexafluorophosphate (FcHPF6, E1/2 = 0.450 V vs SCE in DMF/0.1 M
NBu4PF6).49
Scheme 2. Structures of 5, 6 and 5ox, 6ox represented as two resonance structures. Ru
oxidation states +II and +III are marked in green and red respectively.
5ox and 6ox are EPR active, giving slightly anisotropic signals at -140 °C with a gav of
2.019 for 5ox and of 2.032 for 6ox (Figure 4 and 6b). The absence of an EPR signal at room temperature for the oxidized complexes is explained by the electron-poor nature of the per-brominated- and nitro-substituted ligands, which increases the contribution of the Ru center to the spin density in the case of the oxidized complexes at the expense of the dioxo ligand.50 Indeed, as reported in Table 1, the spin density on the Ru center
19 dioxo ligand of roughly 0.6 |e-|. Therefore, 5ox and 6ox have their spin density nearly equally shared between the Ru ion and the dioxo ligand, corresponding to a strong orbital mixing. This can be represented as the two resonance structures of Scheme 2, where the contribution of the Ru(III)/cat form is nearly as important as the Ru(II)/sq one. A higher metal contribution to the overall spin densities is also indicated by distinct anisotropy of the g-tensor, which is more clearly evident for 6ox (i.e., showing the larger computed spin density) with individual g-tensor components of gx = 1.870, gy =
2.025, gz = 2.190 as determined by simulation of the experimental spectrum (see Figure
S3 of the SI). Table 3 and S4 list the potentials related to the redox processes observed for compounds 5, 6.
Table 3. Electrochemical data for complexes 5 and 6.
Ph2Phen0/- Ph2Phen0/- Ox1 Ox2
5 E1/2 a [V] (RDE) -1.746 ± 0.003 -1.423 ± 0.002 0.182 ± 0.005 0.927 ± 0.008 6 E1/2a [V] (RDE) -1.737 ± 0.009 -1.440 ± 0.009 0.164 ± 0.013 0.970 ± 0.009 a E 1/2 = half-wave.
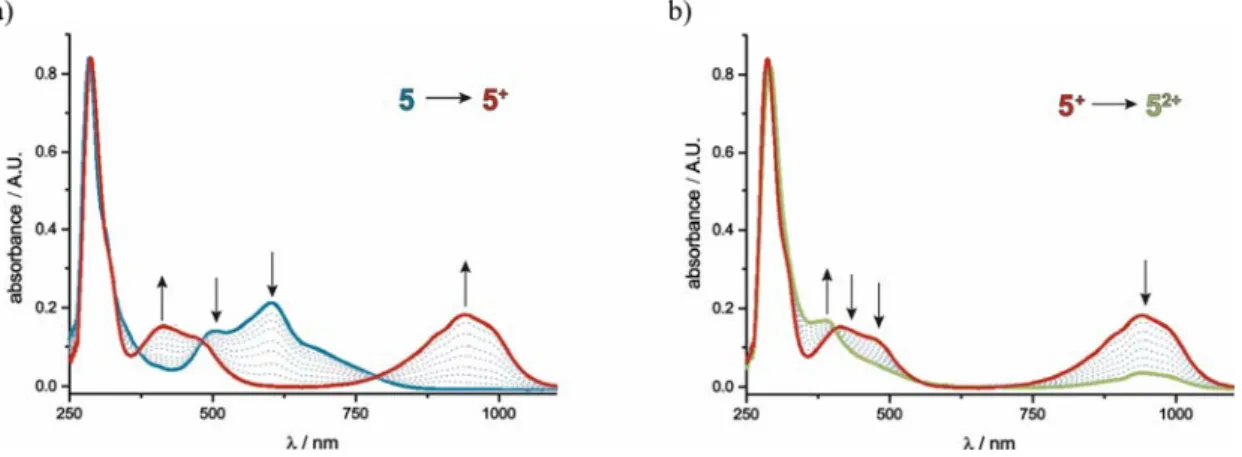
To shed additional light on the impact of the substituent on the dioxo ligand, complex
5 was also subjected to UV/Vis/NIR spectroelectrochemical investigations in the
positive potential range. As evident from Figure 7a, the generation of the monocation furnishes a structured, broad band with a maximum at 940 nm, while the features, characteristic to the neutral forms disappear. The significant red-shift of this band as compared to compounds 1-4 is a clear token of the electron poor nature of the corresponding semiquinonate ligand, which lowers the energy difference between the Ru(II) donor and the dioxo ligand acceptor orbitals. The relatively larger loss of
20 electron density experienced by the ruthenium atom and the rather electron-poor nature of the electrogenerated semiquinonate ligands in oxidized 5ox are further underlined by the blue shift of the RuDIP MLCT and sqDIP LL’CT bands in the visible range to 465 and 410 nm instead of 510 and 470 nm observed for 1. Further oxidation to the dication, in agreement with the CV studies, leads to decomposition as rereduction after electrolysis yielded spectra that considerably differed to those of their monocationic or neutral forms (see Figure 7b).
Figure 7. UV/Vis/NIR-spectroelectrochemistry data for complex 5.
The change from an EDG to an EWG at the sq/cat ligand has therefore two effects. First, the overall redox potential of the molecule is increased in such a manner that, applying the same synthetic procedure and under identical conditions, no longer a paramagnetic, cationic but a neutral, diamagnetic complex is obtained. Secondly, the spin density in the monocationic form presents distinctly larger contributions from the ruthenium center when EWG are present. This occurrence results in a slight increase in EPR signal anisotropy and, more importantly, the absence of a room temperature EPR signal in 5ox and 6ox.
21 Next, the stability of compounds 1–6 was investigated in DMSO and in human plasma. DMSO stability is a key factor to consider in medicinal chemistry as this solvent, in some cases, was found to be problematic for biological experiments for its coordinative property.51–53 The stability in DMSO was monitored by 1H NMR spectroscopy over 96
h at room temperature. Overall, all complexes are stable under these conditions as no significant new peaks appear in the spectra (Figure S6). Only complex 3 shows a certain degree of degradation after 96 h, displaying a conversion of about 15% of the initial complex. The spectrum of complex 3 shows new, more resolved peaks which are a clear indication of the formation of a non-paramagnetic product. Additionally, for estimating the stability under the physiological conditions, the stability of complex 1 (the most promising of the series) was investigated in human plasma. Complex 1 was incubated over 96 h in human plasma at 37 °C in the presence of an internal standard (caffeine). Figure S7 reveals a linear decrease of concentration of complex 1 over time and a half-life of 48h.
Cytotoxicity Studies
The first step toward the biological investigation of complexes 1–6 was the evaluation of cell viability in monolayer cultures of HeLa (human cervical adenocarcinoma), A2780 (human ovarian carcinoma), A2780 cis (human cisplatin resistant ovarian carcinoma), A2780 ADR (human doxorubicin resistant ovarian carcinoma), CT-26 (mouse colon adenocarcinoma), CT-26 LUC (mouse colon adenocarcinoma stably expressing luciferase) and RPE-1 (human normal retina pigmented epithelial) cell lines using a fluorometric cell viability assay (single graphs available in Figures S8).54
Doxorubicin and cisplatin, as well as the ligands and the Ru(DIP)2Cl2 precursor were
tested in the same cell lines as positive and additional controls (Table 4 and Table S5).55,56 Table 4 displays the IC50 (the half maximal inhibitory concentration) values of
22 the tested compounds and the previously reported Ru-sq.29 Ru-sq is the analogous
complex carrying the unsubstituted semiquinonate ligand. The comparison between
Ru-sq and the derivatives carrying an EDG and EWG substituted dioxo ligand
(compounds 1–4 and 5, 6, respectively) reveals how the electron density on the organic moiety impacts the observed cytotoxicity in the tested cell lines. In general, compounds
1–4 present higher cytotoxicity in most of the cell lines tested. In contrast, complexes
5 and 6 show much lower cytotoxicity with IC50 in the micromolar range for all the cell
lines tested. Of particular interest is complex 1 with an IC50 in the low nanomolar range
(0.07 μM) against the cisplatin resistant cell line which makes it 10 times more active than doxorubicin and around 200 times more active than cisplatin (0.54 μM and 18.33 μM for doxorubicin and cisplatin, respectively). Complex 1 presents an IC50 of 0.7 μM
against the doxorubicin resistant cell line, which is 10 times lower than the values for
Ru-sq and cisplatin (4.13 μM and 8.32 μM for Ru-sq and cisplatin, respectively).
Overall, complexes 1–4 display a cytotoxicity which is comparable to that of doxorubicin and much higher than that of cisplatin. The Ru(DIP)2Cl2 precursor (Table
4) and the different catechols (Table S4), display a much lower activity suggesting that the great activity shown by complexes 1–4 is the consequence of the coordination of electron rich sq ligands to the Ru(II) polypyridyl core.
Table 4. IC50 values for 1–6, Ru-sq, cisplatin, doxorubicin and Ru(DIP)2Cl2 on
different cell lines.
IC50 (μM) HeLa A2780 A2780 ADR A2780 cis CT-26 CT-26 LUC RPE-1
Cisplatin* 9.28 ± 0.20 4.00 ± 0.76 8.32 ± 0.71 18.33 ± 2.92 2.60 ± 0.18 2.42 ± 0.23 30.24 ± 5.11 Doxorubicin* 0.34 ± 0.02 0.19 ± 0.03 5.94 ± 0.58 0.54 ± 0.04 0.082 ± 0.003 0.18 ± 0.006 0.89 ± 0.17 Ru(DIP)2Cl2* 15.03 ± 0.4 4.69 ± 0.14 78.27 ± 4.9 6.36 ± 0.57 9.20 ± 1.22 6.65 ± 0.5 3.13 ± 0.07
23 Ru-sq* 0.50 ± 0.01 0.67 ± 0.04 4.13 ± 0.2 0.45 ± 0.03 1.00 ± 0.03 1.51 ± 0.14 0.90 ± 0.04 1 0.124 ± 0.004 0.0261 ± 0.0005 0.70 ± 0.05 0.076 ± 0.005 0.067 ± 0.004 0.269 ± 0.007 0.764 ± 0.23 2 0.353 ± 0.006 0.18 ± 0.03 1.05 ± 0.22 0.39 ± 0.07 0.31 ± 0.02 0.24 ± 0.01 0.67 ± 0.2 3 0.61 ± 0.07 0.20 ± 0.01 1.45 ± 0.14 0.39 ± 0.03 0.65 ± 0.04 0.42 ± 0.01 0.58 ± 0.01 4 2.11 ± 0.12 0.53 ± 0.03 1.91 ± 0.08 0.80 ± 0.03 1.167 ± 0.15 1.147 ± 0.224 2.965 ± 0.45 5 10.46 ± 0.25 10.23 ± 0.14 15.01 ± 0.75 17.17 ± 1.4 13.49 ± 0.5 11.64 ± 0.7 23.15 ± 2.5 6 10.03 ± 0.44 12.4 ± 0.8 18.63 ± 2.02 16.37 ± 2.04 7.61 ± 0.11 9.01 ± 0.19 16.55 ± 0.98
* Values taken from[29] We however note that these experiments were performed on the same days.
Complex 1 was found to be the most promising candidate among the series of complexes investigated in the 2D model due to its remarkably high cytotoxicity and its great activity towards resistant cell lines, its cytotoxicity was explored in a MultiCellular Tumour Spheroids (MCTS) model.57 In 3D spheroids, proper cell to cell
and cell to environment interactions, as well as cellular morphology and polarity is maintained. Additionally growth pattern, metabolism and gene expression mimic the complexity of initial stages of solid tumours.57,58 These features allow for a good
estimation of in vivo antitumor activity, qualifying MCTS as a more reliable model than monolayer cell cultures in cancer research.58–60 In addition to the complex of interest
(1), the Ru(DIP)2Cl2 precursor, the 3-methoxycatechol ligand and positive controls
(cisplatin and doxorubicin)59,60 were tested via a luminescent cell viability assay in
HeLa MCTS (single graphs are availabe in Figure S9). Moreover, Ru-sq was tested for comparative porposes. Table 5 shows the IC50 values after a 48 h treatment for all the
compounds tested. Complex 1 displays high cytotoxicity toward HeLa MCTS with an IC50 ≈ 21 µM. This value indicates an activity which is almost the double of the current
drugs cisplatin and doxorubicin (IC50 ≈ 46 µM and 39 µM, respectively). Nevertheless,
24 3-methoxycatechol proved to be nontoxic and the Ru(DIP)2Cl2 precursor showed a
cytotoxicity comparable to cisplatin.
Table 5. IC50 values for complex 1, cisplatin, doxorubicin, Ru(DIP)2Cl2 and
3-methoxycatechol in multicellular HeLa cancer cell spheroids.
IC50 (μM) Cisplatin* Doxorubic
in* Ru-sq* 1 Ru(DIP)2Cl2 3-Methoxyc atechol HeLa MCTSs 46.49 ± 4.18 38.59 ± 0.43 14.11 ± 0.09 21.01 ± 0.66 59.84 ± 3.05* >100 * Values taken from[29] We however note that these experiments were performed on the same days.
To evaluate the time dependent effect on the growth of MCTS treated with complex 1, an additional experiment was performed. 400 µm HeLa MCTS were treated with a range of different concentrations of 1. Every three days, half of the media in the wells was exchanged (treatment concentration consequently decreased by half) and pictures of the spheroids were taken (Figure 8a). HeLa MCTS had reduced diameter when treated with concentrations higher than the IC50 (20, 25 and 30 µM) of complex 1.
Additionally, Figure 8 indicates that this effect was maintained even after 13 days for the highest concentration, while, a slow regrowth was observed for 20 and 25 µM treatment. These findings are similar to the one previously reported for Ru-sq complex.29
25
Figure 8. Changes in growth kinetics of MCTSs treated with complex 1 at different
concentrations (1, 5, 10, 20, 25 and 30 µM). (a) Images collected at day 0 (before treatment) and at day 3, 6, 9 and 13. b) MCTSs diameter measured at different time points. Blue dotted line indicates day of seeding, red dashed line indicates day of treatment, green dotted lines indicate days of washing.
Overall, the outstanding activites shown by complex 1 in the monolayer cells model is confirmed by a MCTSs model. These findings represent a powerful encouragement to the further investigation of complexes 1 as potential chemotherapeutic agents.
Cell Death Mechanism.
Many of the novel or existing chemotherapeutic agents are developed to trigger cell death through apoptosis.63 This is considered a carefully regulated and energy
dependend type of cell death in contrast to necrosis considered a rapid, unregulated, energy- independent mode of death.64 The mode of cell death induced by the treatment
with complex 1 was investigated in HeLa cell line via flow cytometry using Annexin V and propidium iodide (PI) staining method. Figure 9a shows the obtained dot-plots at t = 24 h (see Figure S10 for the dot plots at each time point). Figure 9b represents the percentage of cell population in different stages of cell death, at different time points in
26 comparison to staurosporin (apoptosis inducer, positive control).72 Collected data
demonstrated that after 24 h treatment, a large population of HeLa cells was in the late apoptotic/necrotic stage. It is worth noting that apoptosis or necrosis are induced by different pathways and mechanisms, and it is highly unlikely for a cell to undergo necrotic death after several hours of early apoptotic stage. Hence, these data indicate that complex 1 is most probably inducing cell death through apoptosis.
Figure 9. a) Flow cytometry dot-plots of Annexin V and PI staining in HeLa cells
treated with complex 1 (10 μM) and staurosporine (1 μM) at 24 h. b) Percentage of cell population in different stages of cell death for staurosporin (positive control) and complex
Cellular Uptake, Biodistribution, and DNA Metalation.
The high cytotoxicity of complex 1 in the tested cell lines encouraged its further biological studies. Firstly, cellular uptake, mechanism of uptake and intracellular distribution were tested using Inductively Coupled Plasma Mass Spectrometry (ICP-MS). Working concentrations and incubation times were chosen accordingly to avoid extended cell mass loss due to the high cytotoxicity of the complexes but considering a final ruthenium amount that allowed for the determination of the metal content. Nevertheless, the working conditions (5 µM treatment for 2 h) allowed for a minor accumulation of the drug cisplatin, which was used as control.65,6667 Complex 1 shows
27 higher cellular accumulation than the positive control cisplatin and the Ru-sq analogue previously reported,29(Figure 10a). To clarify whether the mechanism of uptake
involves passive or active mechanisms additional experiments were performed. HeLa cells were kept at low temperature (4ºC) or were pre-treated with different uptake pathways inhibitors. Thus, 2-deoxy-D-glucose and oligomycin were used to block cellular metabolism, chloroquine or ammonium chloride were used to impede endocytic pathways, and tetraethylammonium chloride was used to block cation transporters. After pre-treatment, cells were incubated with the test compounds (2 h, 5 µM). The amounts of ruthenium found in cells were then quantified using ICP-MS. Low temperature slightly inhibited the uptake of complex 1 while all the other conditions (regulating active transportation mechanisms) did not affect the total uptake (Figure S11). These findings strongly suggest that the internalisation of complex 1 is due only to a passive, energy independent mechanism, unlike Ru-sq, whose mechanism of uptake involves both active and passive transports.29 Intracellular distribution among
cytoplasm, mitochondria, nucleus and mitochondria was determined by isolating pure cellular compartments. Most of the compounds accumulates in nucleus and lysosomes and in a smaller extent to mitochondria and cytoplasm (Figure 10b). To verify whether the accumulation in the nucleus lead to direct interaction with DNA, the genetic material was extracted from treated cells and the metal content analysed via ICP-MS. Figure 10c shows that complex 1 successfully binds DNA in a much higher extent when compared to cisplatin, which results are in perfect agreement with what previously reported.67 Even though the accumulation in the nucleus is lower, the DNA metalation
shows comparable results for complex 1 and Ru-sq, which can be explained by the overall higher uptake of complex 1.
28
Figure 10. Cellular uptake (a), cellular fractionation (b) and DNA metalation (c) of HeLa cells after treatment with tested compounds (5 µM, 2 h). Data are presented as the mean ± SD of at least 3 technical replicates. All data related to Ru-sq were previously reported by our group.29 We, however, note that these experiments were performed on
the same days.
JC-1 Mitochondrial Membrane Potential Test and Metabolic Studies.
Next, to gain more insights into the possible mechanism of action of complex 1, its effect on mitochondria membrane potential (MMP) and metabolic pathways were determined. First, the MMP (directly correlated to mitochondrial function68) was
studied via JC-1 staining method. JC-1 is considered the most reliable fluorescent dye to illustrate the MMP in living cells.69 It is present as an aggregate (red fluorescent) and
as a monomer (green fluorescent), respectively at high and low MMP.69 The net
distinction allows for an immediate analysis of the MMP.69 Figure 11a shows the red
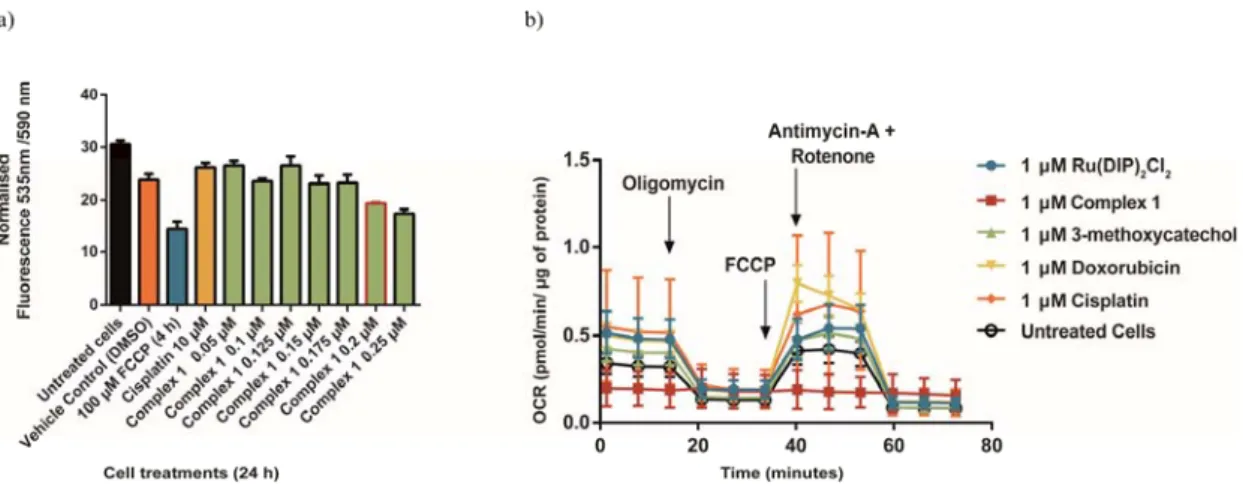
fluorescence signal observed in HeLa cells untreated (negative control) and after 24 h treatment with complex 1, DMSO (vehicle control) and FCCP (carbonyl cyanide 4-(trifluoromethoxy)phenylhydrazone, an uncoupling agent used as positive control).70 A slight decrease in the fluorescence is observed in the cells treated with complex 1 (from 0.05 µM to 0.25µM) in a concentration-dependent manner. However, even at the IC50,
29
noting that ongoing apoptosis can also generate a drop in MMP.70 Taken together, these
data indicate that complex 1 is slightly decreasing mitochondria membrane potential in treated cells. To have more insights into the effect of the complex 1 in the process of oxidative phospohorylation, further experiments were performed. For this purpose, Seahorse XF Analyzer was used. The performed Mito Stress Test pointed to very low basal respiration levels, inhibited ATP production and the loss of the ability to restore proton balance after FCCP treatment (Figure 11b and Figure S12). These data suggest that the mitochondria processes are defective in HeLa cells incubated with complex 1. On the contrary, the same effects were not observed during treatment with the
Ru(DIP)2Cl2 precursor or the 3-methoxycatechol ligand. Furthermore, no influence of
compound 1 on the cytosolic process of glycolysis was detected (Figure S13). Unfortunately, no direct impact on three main fuel pathways could be determined due to very low oxygen consumption rates (Figure S14).
Metabolic studies confirm that the effects of complex 1 on mitochondria respiration can contribute to cell death, leading to a multiple mode of actions involving at least nucleus and mitochondria as possible targets.
Figure 11. a) Fluorescence signal of JC-1 dye detected in HeLa cells treated for 24 h
with different concentrations of complex 1 (from 0.05 µM to 0.25µM). The bar marked in red indicates the IC50 concentration (0.2 µM). FCCP is used as positive control,
30 cisplatin and DMSO (1%) are used as negative controls. b) Mito Stress Test profile after 24 h treatment; oxygen consumption rate changes after treatment with specific electron transport chain inhibitors. Oligomycin (inhibitor of ATP synthase (complex V)), FCCP (uncoupling agent), Antimycin-A (complex III inhibitor) and Rotenone (complex I inhibitor).
Preliminary in vivo biodistribution studies
In this study, complex 1 demonstrated to be of great interest as potential chemotherapeutic agent. However, one of its main drawbacks is its scarce water solubility, which could limit its potential use in vivo. The analogue Ru-sq, previously reported by our group, showed potential as anticancer drug in immunocompetent mice bearing Ehrlich tumors.29 Nevertheless, its clinical interest is limited by its poor water
solubility, which prevented an intravenous administration. Anticancer drugs such as paclitaxel and docetaxel have faced the same limitation but reached the clinic.71,72
Indeed, to overcome this shortcoming, formulation strategies were used, which allowed for increased apparent aqueous solubility of the drugs and therefore their parenteral injection.71,72 Following these examples, we successfully developed a formulation of
compound 1 using polysorbate 80, a nonionic surfactant generally recognized as safe and already used for docetaxel.73 Using the film rehydration method, usually applied to
the preparation of polymeric surfactant micelles and liposomes,74,75 up to 0.84 ± 0.06
mg/mL of compound 1 could be dissolved in 50 mg/mL of polysorbate 80, with an encapsulation efficiency of 95 ± 3%. Liver and kidneys are the main routes by which drugs and metabolites leave the body, so the effect of complex 1 on them was evaluated.76 Complex 1 was tested in TIB-75 (mouse, epithelial liver) and HEK 293
31 (human, embryonic kidney) cell lines showing cytotoxicity in both cases (Table 6, single graph available in Figure S8).
Table 6.IC50 values for cisplatin, complex 1, Ru(DIP)2Cl2 and 3-methoxycatechol in
HEK293 and TIB-75 cell lines.
IC50 (μM) Cisplatin* 1 Ru(DIP)2Cl2
3-Methoxycatechol HEK293 6.60 ± 1.49 0.07 ± 0.005 5.42 ± 0.51 18.96 ± 0.88
TIB-75 2.83 ± 0.08 0.02 ± 0.0001 5.06 ± 0.32 19.16 ± 1.15
These results together with the ones shown in Table 4 point out the non-selectivity of complex 1 between cancerous and non-cancerous cell lines. This shortcoming is often faced in medicinal chemistry and it could be improved by the introduction of a targeting moiety. Therefore, we decided to pursue the biodistribution study with the developed formulation to verify the ability of the drug to distribute in the organism upon administration, despite its low aqueous solubility. A preliminary biodistribution study was performed on healthy BALB/c mice after intravenous injection of the formulation at a dose of 5 mg/kg of compound 1. After 30 minutes, 1 and 2 hours, mice were sacrificed and the ruthenium content was analyzed via ICP-MS in relevant tissues (brain, liver, kidneys, spleen, intestine, lungs and blood). Worthy of note, the formulation was well tolerated, and no sign of pain or acute toxicity was observed over the course of the experiment.
32
Figure 12. Biodistribution of complex 1 (5mg/kg) over 2 h in BALB/c mice. Data are
presented as the mean ± SD of at least three biological replicates.
According to data shown in Figure 12, compound 1 seems to accumulate preferentially in the liver and the kidneys, and more surprisingly, in the lungs and the spleen. This phenomenon has already been described in the case of doxorubicin formulated in polysorbate 80, and was attributed to this carrier.77 The low level of ruthenium detected
in the blood at all time point suggest a fast distribution in the tissues, possibly associated to a fast renal and biliary elimination, supported by the increase of the ruthenium content in the intestine over time.
These preliminary results show compound 1’s ability to distribute in the body despite its hydrophobicity using a formulation strategy. While promising, the formulation with polysorbate 80 has also been associated with side effects.78,79 To overcome this
33 drawback, a more biocompatible excipient could be used, as already successfully achieved in the case of docetaxel.72
34
Conclusions
In this work, we performed a structure activity relationship study (SAR) based on the promising activity expressed by the complex Ru-sq recently reported by our group. More specifically, we explored the coordination of differently substituted catechol-type dioxo ligands to the Ru(DIP)2 core. Electrochemical, EPR and electronic structure
studies allowed us to conclude that the two classes of dioxo ligands tested, carrying either electron-donating (EDG) or electron-withdrawing (EWG) groups, gave Ru(II) complexes with either the semiquinonate (sq, for EDG-modified dioxo ligands in complexes 1–4) or catecholate ligand (cat, for EWG-modifed dioxo ligands in complexes 5, 6). Complexes 1–4 are deep red solids and carry an overall positive charge due to the monoanionic sq ligand. Complexes 5 and 6 are blue/violet in color and overall neutral due to the dianionic charge associated with the catecholate. Both classes of complexes were found to be stable in DMSO and complex 1 displayed a half-life of 48 h in human plasma. Cytotoxicity studies using the monolayer model revealed that complexes 1–4 displayed much higher bioactivities than complexes 5 and 6. These findings clearly suggest that the high cytotoxicity observed is a direct consequence of the coordination of electron rich semiquinonate ligands to the Ru(II) polypyridyl core. Precisely, complex 1 was found to be the most promising candidate of this series with IC50 values in the low nanomolar range and was chosen for more detailed
investigations. Firstly, its cytotoxicity was confirmed using a more reliable 3D model (MCTS), where it displayed an IC50 value of almost half of that of cisplatin and
doxorubicin. Complex 1 was found to be taken up by HeLa cells very efficiently through a passive transportation mechanism. Cellular fractionation studies revealed major accumulation in the nucleus, lysosomes and in a smaller extent in the mitochondria and cytoplasm. DNA ruthenation, MMP determination and mitochondria
35 metabolism studies indicated that DNA and mitochondria are both cellular targets of complex 1. Multiple targets are essential to overcome resistance, which is one of the main drawbacks associated with chemotherapy treatments nowadays. Moreover, despite poor water solubility, complex 1 demonstrated to distribute well in vivo with the use of an appropriate formulation. These results together with the advantageous modes of action and the outstanding cytotoxicity displayed by complex 1 makes it an interesting compound for clinical application in the search of potential chemotherapeutic agents against cancer.
36
Experimental Section
Materials
All chemicals were either of reagent or analytical grade and used as purchased from commercial sources without additional purification. Ruthenium trichloride hydrate was provided by I2CNS, 4,7-Diphenyl-1,10-phenanthroline, Lithium chloride (anhydrous,
99%), 3-Methoxycatechol, 4-Methylcatechol, 4-tert-Butylcatechol and 4-Nitrocatechol by Alfa Aesar, 3-Methylcatechol and tetrabutylammonium hexafluorophosphate by Sigma-Aldrich, tetrabromocatechol from BOC Science. All solvents were purchased of analytical, or HPLC grade. When necessary, solvents were degassed by purging with dry, oxygen-free nitrogen for at least 30 min before use.
Instrumentation and methods
Amber glass or clear glassware wrapped in tin foil were used when protection from the light was necessary. Schlenk glassware and a vacuum line were employed when reactions sensitive to moisture/oxygen had to be performed under nitrogen atmosphere. Thin layer chromatography (TLC) was performed using silica gel 60 F-254 (Merck) plates with detection of spots being achieved by exposure to UV light. Column chromatography was done using Silica gel 60–200 µm (VWR). Eluent mixtures are expressed as volume to volume (v/v) ratios. 1H and 13C NMR spectra were measured
on Bruker Avance III HD 400 MHz or Bruker Avance Neo 500 MHz spectrometers using the signal of the deuterated solvent as an internal standard.80 The chemical shifts
δ are reported in ppm (parts per million) relative to tetramethylsilane (TMS) or signals
from the residual protons of deuterated solvents. Coupling constants J are given in Hertz (Hz). The abbreviation for the peaks multiplicity is br (broad). ESI experiments were carried out using a 6470 Triple Quad (Agilent Technologies). Elemental analysis was performed at Science Centre, London Metropolitan University using Thermo
37 Fisher (Carlo Erba) Flash 2000 Elemental Analyser, configured for %CHN. IR spectra were recorded with SpectrumTwo FTIR Spectrometer (Perkin-Elmer) equipped with a Specac Golden GateTM ATR (attenuated total reflection) accessory; applied as neat samples; 1/λ in cm–1. Analytical HPLC measurement was performed using the
following system: 2 x Agilent G1361 1260 Prep Pump system with Agilent G7115A 1260 DAD WR Detector equipped with an Agilent Pursuit XRs 5C18 (100Å, C18 5 μm 250 x 4.6 mm) Column and an Agilent G1364B 1260-FC fraction collector. The solvents (HPLC grade) were acetonitrile (0.1% TFA, solvent A) and millipore water (0.1% TFA, solvent B). The flow rate was 1 mL/min. Detection was performed at 215nm, 250nm, 350nm, 450nm, 550nm and 650nm with a slit of 4nm.
Synthesis and characterization
Ru(DMSO)2Cl2. Ru(DMSO)2Cl2 was synthesised following an adapted literature
procedure.44 Spectroscopic data (1H NMR) are in agreement with literature.44
Ru(DIP)2Cl2. The complex was synthesised following an adapted literature
procedure.45 A mixture of Ru(DMSO)
2Cl2 (3.0 g, 6.19 mmol),
4,7-diphenyl-1,10-phenanthroline (4.11 g, 12.38 mmol) and LiCl (2.0 g, 47.18 mmol) dissolved in DMF (100 mL) was refluxed for 24 h. After cooling to r.t., the solvent was reduced in vacuo and 350 mL of acetone were added. The mixture was then stored at -20 °C overnight before filtration with a Buchner funnel and washed with acetone and Et2O to afford
Ru(Ph2Phen)2Cl2 as a deep purple solid (3.76 g, 4.49 mmol, 72%). Spectroscopic data
(1H NMR) were in agreement with literature.45
38 Ru(DIP)2Cl2 (0.250 g, 0.3 mmol) and aq. NaOH (0.45 mL, 1 M) were dissolved in
2-propanol (20 mL). The solution was degassed purging nitrogen through the solution for 15 min and the respective catechol (0.07 g, 0.5 mmol) was added. The mixture was heated to reflux for 24 h under N2 atmosphere and protected from light. After cooling
to r.t., the mixture was stirred open to air for 2 h while still protected from light and the solvent was removed under vacuum. The residual solid was dissolved in 2-propanol (2.5 mL) and H2O (20 mL) and NH4PF6 (0.250 g, 1.5 mmol) were added. The mixture
was stored in the fridge (4 °C) overnight. The precipitate was filtered with a Buchner funnel, washed with H2O (3 × 50 mL) and Et2O (3 × 50 mL) and collected. The solid
was collected with DCM and dried under vacuum to deliver a crude product which was chromatographed on silica (DCM/MeCN 20:1 Rf : 0.3 for complexes 1–4, DCM/Et2O
98:2 Rf : 0.8 for complex 5, DCM/MeOH 96:4 Rf : 0.4 for complex 6). Evaporation of the solvent under vacuum provided complexes 1–6. Each complex with Et2O or
Heptane (10 mL) was sonicated for 10 min and then centrifuged. This procedure was repeated three times for each solvent. The solid was collected with DCM and dried under vacuum to yield a clean product. Finally the red solid was collected with DCM and dried under vacuum to afford a clean product.
[Ru(DIP)2(3-methoxylsq)](PF6) (1)
Deep red solid (0.073 g, 0.07 mmol, 23%). IR (Golden Gate, cm-1): 3060w, 1620w,
1590w, 1540w, 1460m, 1400m, 1250m, 1160m, 1100m, 1030w, 827s, 764s, 735m, 700s. 1H NMR (500 MHz, CD
2Cl2): /ppm = 8.91 – 8.50 (br, 1H, arom.), 8.43 – 8.08
(br, 3H, arom.), 8.07 – 7.79 (br, 7H, arom.), 7.75 – 7.46 (br, 15H, arom.), 7.46 – 7.28 (br, 2H, arom.), 7.28 – 6.93 (br, 10H, arom.). 13C NMR (125 MHz, CD2Cl2): /ppm =
149.62, 146.57, 143.72, 140.55, 137.05, 136.03, 133.07, 132.47, 131.27, 130.31, 130.07, 130.00, 129.59, 129.56, 129.33, 128.97, 128.80, 128.57, 125.67, 125.46,
39 123.55. MS (ESI+): m/z 904.8 [M - PF6]+. Elemental Analysis: calcd. for
C55H40F6N4O4PRu= C, 62.76; H, 3.64; N, 5.53. Found = C, 61.67; H, 3.63; N, 5.09.
HPLC: 0–3 minutes: isocratic 65% A (35% B); 3-17 minutes: linear gradient from 65% A (35% B) to 100% A (0% B); 17–23 minutes: isocratic 100% A (0% B), TR = 11.887
min.
[Ru(DIP)2(3-methylsq)](PF6) (2)
Deep red solid (0.07 g, 0.07 mmol, 24%). IR (Golden Gate, cm-1): 3060w, 1600w,
1540m, 1390m, 1250m, 1150m, 1100w, 1030w, 827s, 764s, 735s, 700s. 1H NMR (400
MHz, CD2Cl2) δ 8.79 – 8.11 (br, 6H, arom.), 8.08 – 7.82 (br, 6H, arom.), 7.60 (br, 15H,
arom.), 7.40 – 6.81 (br, 11H, arom.). 13C NMR (100 MHz, CD2Cl2): /ppm = 148.62,
147.00, 142.78, 142.70, 142.59, 136.94, 136.22, 132.88, 130.54, 130.25, 130.13, 129.79, 129.61, 129.56, 128.64, 126.87, 126.52, 124.93, 124.47, 121.72. MS (ESI+): m/z 888.7 [M - PF6]+. Elemental Analysis: calcd. for C55H40F6N4O3PRu= C, 62.86; H,
3.84; N, 5.33. Found = C, 62.95; H, 3.69; N, 5.20. HPLC: 0–3 minutes: isocratic 65% A (35% B); 3-17 minutes: linear gradient from 65% A (35% B) to 100% A (0% B); 17– 23 minutes: isocratic 100% A (0% B), TR = 13.568 min.
[Ru(DIP)2(4-methylsq)](PF6) (3)
Deep red solid (0.09 g, 0.09 mmol, 29%). IR (Golden Gate, cm-1): 3060w, 1620w,
1590, 1560, 1510w, 1420m, 1240m, 1120w, 1090w, 1030w, 912w, 827s, 762s, 735m, 698s. 1H NMR (500 MHz, CD
2Cl2) δ 8.63 – 8.07 (br, 6H, arom.), 8.03 – 7.81 (br, 7H,
arom.), 7.72 – 7.36 (br, 16H, arom.), 7.36 – 7.03 (m, 9H, arom.). 13C NMR (125 MHz,
CD2Cl2): /ppm = 149.08, 147.51, 143.55, 142.50, 140.12, 140.01, 136.57, 136.18,
40 126.41, 124.88, 123.69. MS (ESI+): m/z 888.7 [M - PF6]+. Elemental Analysis: calcd.
for C55H38F6N4O2PRu= C, 63.95; H, 3.71; N, 5.42. Found = C, 63.84; H, 3.62; N, 5.29.
HPLC: 0–3 minutes: isocratic 85% A (15% B); 3–17 minutes: linear gradient from 85% A (15% B) to 100% A (0% B); 17–23 minutes: isocratic 100% A (0% B), TR = 13.532
min.
[Ru(DIP)2(4-tert-buthylsq)](PF6) (4)
Deep red solid (0.05 g, 0.05 mmol, 16%).IR (Golden Gate, cm-1): 3060w, 2960w,
1620w, 1580w, 1510m, 1450m, 1420m, 1220m, 1090w, 1030w, 827s, 764s,735s, 700s.
1H NMR (400 MHz, CD
2Cl2): /ppm = 8.43 – 8.12 (br, 6H, arom.), 8.09 – 7.81 (br, 9H,
arom.), 7.70 – 7.46 (br, 16H, arom.), 7.46 – 7.24 (br, 4H, arom.), 7.24 – 7.04 (br, 8H, arom.). 13C NMR (125 MHz, CD2Cl2): /ppm = 147.51, 147.31, 143.70, 136.70,
136.64, 132.77, 132.54, 130.21, 129.63, 129.45, 128.84, 128.75, 127.49, 126.60, 124.85, 124.45. MS (ESI+): m/z 930.8 [M - PF6]+. Elemental Analysis: calcd. for
C58H44F6N4O2PRu= C, 64.80; H, 4.13; N, 5.21. Found = C, 64.72; H, 4.13; N, 5.14.
HPLC: 0–3 minutes: isocratic 85% A (15% B); 3–7 minutes: linear gradient from 85% A (15% B) to 100% A (0% B); 7–9 minutes: isocratic 100% A (0% B); 9-11minutes: linear gradient from 100% A to 85% A, TR = 9.801 min.
Ru(DIP)2(tetrabromocat) (5)
Blue/violet solid (0.192 g, 0.162 mmol, 54%). IR (Golden Gate, cm-1) : 3060w, 1600w,
1430s, 1260m, 1080m, 1030w, 914m, 847m, 760m, 731m, 700s. 1H NMR (400 MHz,
CD2Cl2): /ppm = 8.14 – 8.03 (br, 5H, arom.), 7.74 – 7.63 (br, 10H, arom.), 7.60 – 7.43
(br, 15H, arom.), 7.40 – 7.31 (br, 2H, arom.). 13C NMR (125 MHz, CD2Cl2): /ppm =
41 130.25, 130.19, 129.62, 129.46, 129.35, 128.46, 126.44, 129.35, 128.46, 126.44, 126.38, 125.74, 125.66. MS (ESI+): m/z 1090.4 [M]+. Elemental Analysis: calcd. for
C54H32Br4N4O2Ru = C, 54.52; H, 2.71; N, 4.71. Found = C, 54.56; H, 2.37; N, 4.89.
HPLC: 0–3 minutes: isocratic 85% A (15% B); 3-7 minutes: linear gradient from 85% A (15% B) to 100% A (0% B); 7–9 minutes: isocratic 100% A (0% B); 9-11minutes: linear gradient from 100% A to 85% A, TR = 8.623 min.
Ru(DIP)2(4-nitrocat) (6)
Blue/violet solid (0.07 g, 0.08 mmol, 27%). IR (Golden Gate, cm-1): 3060w, 1550w,
1490m, 1410w, 1240s, 1120m, 1070s, 1030w, 949w, 910w, 845s, 762s, 733s, 698s. 1H
NMR (400 MHz, CD2Cl2): /ppm = 9.65 – 9.21 (br, 3H, arom.), 8.24 – 7.85 (br, 8H,
arom.), 7.81 – 7.40 (br, 17H, arom.), 7.41 – 7.18 (br, 2H, arom.), 6.87 – 6.59 (br, 1H, arom.), 6.60 – 6.27 (br, 2H, arom.), 6.11 – 5.84 (br, 2H, arom.). 13C NMR (125 MHz,
CD2Cl2): /ppm = 153.27, 152.64, 152.53, 150.58, 146.76, 146.65, 144.72, 144.63,
137.40, 137.17, 130.79, 130.69, 130.19, 129.61, 129.50, 129.44, 128.86, 128.38, 126.17, 125.87, 125.49, 125.15, 124.99, 124.87. MS (ESI+): m/z 919.4 [M]+. Elemental
Analysis: calcd. for C54H39N5O6Ru = C, 67.92; H, 4.12; N, 7.33. Found = C, 68.04; H,
4.11; N, 7.28. HPLC: 0–3 minutes: isocratic 5% A (95% B); 3–17 minutes: linear gradient from 5% A (95% B) to 100% A (0% B); 17–23 minutes: isocratic 100% A (0% B), TR = 15.907 min.
Electrochemical Measurements
The electrochemical experiments were carried out with a conventional three-electrodes cell (solution volume of 15 mL) and a PC-controlled potentiostat/galvanostat (Princeton Applied Research Inc. model 263A). The working electrode was a vitreous
42 carbon electrode from Origalys (France) exposing a geometrical area of 0.071 cm2 and
mounted in Teflon®. The electrode was polished before each experiment with 3 and 0.3
m alumina paste followed by extensive rinsing with ultra-pure Milli-Q water. Platinum wire was used as the counter electrode and saturated calomel electrode, SCE, as the reference electrode. Electrolytic solutions, DMF containing tetrabutylammonium hexafluorophosphate 0.1 M (NBu4PF6, Aldrich, +99%) as supporting electrolyte, were
routinely deoxygenated by argon bubbling. All the potential values are given versus the calomel saturated electrode SCE and recalculated versus the Me10Fc0/+ redox pair (E1/2
= 0.04 V vs. SCE).
Computational Details
All structural optimizations were performed using the Gaussian16 suite of programs81,
at unrestricted Kohn-Sham82 (UKS) level. The non-relativistic double-zeta
LANL2DZ83 pseudopotential (effective-core-potential, ECP) were used for Ru and Br
atoms, together with the Pople split valence double-zeta basis set for C, N, O, S, and H, coupled with one set of polarization and diffuse functions84–86 on all atoms, except for
hydrogens. The B3LYP87 exchange-correlation functional was used throughout.
Solvent effects (isopropanol) were taken into account using the polarized continuum model in its conductor-like version (CPCM).88
Calculations of g-tensors were performed on optimized structures using the Orca 3.0.3 Package.89 Scalar relativistic effects were included using the zero-order regular
approximation (ZORA).90,91 A common gauge origin at the metal nucleus was
employed. Such calculations were performed using the segmented all-electron relativistically contracted (SARC) def2-SVP92 basis on all atoms except for the
43 were sped up by employing the chain-of-sphere (RIJCOSX)93 approximation along
with the decontracted auxiliary basis set of def2-SVP/J coulomb-fitting.94 Increased
integration grids (Grid4) and tight SCF convergence were used throughout the calculations. Solvent effects have been taken into account with conductor-like screening model (COSMO) with a dielectric constant ε of 20.795 - closest value to the
isopropanol environment simulated in the geometry optimization.
Electron Paramagnetic Resonance Spectroscopy
Electron paramagnetic resonance (EPR) experiments were performed on a MiniScope MS400 table-top X-band spectrometer from Magnettech. Simulation of the experimental EPR spectra was performed with the MATLAB EasySpin program.96 All
samples were dissolved in dry and N2-saturated DCM at a concentration of ca. 1 mM.
Oxidized forms were generated using ferrocenium hexafluoroantimonate (FcPF6, E1/2
= 0.450 V vs SCE in DMF/0.1 M NBu4PF6).49,97
UV/Vis/NIR Spectroelectrochemistry (UV/Vis/NIR-SEC)
UV/Vis/NIR spectra were recorded on a TIDAS fibreoptic diode array spectrometer (combined MS UV/NIR and PGS NIR instrumentation) from J&M in HELLMA quartz cuvettes with a 0.1 cm optical path length. The OTTLE (optically transparent thin layer electrolysis) cell used for spectroelectrochemical studies was lab-built according to the design by Hartl et. al.98 and comprises a Pt-mesh working electrode, a Pt-sheet counter
electrode and a Ag-sheet pseuoreference electrode sandwiched between CaF2 windows.
For regular absorption spectra dry DMF was used as the solvent, while SEC experiments were conducted in a DMF electrolyte containing 0.1M of NBu4PF6. A
BASi potentiostat was used to apply the necessary voltage to generate the reduced/oxidized species.