Analysis of NOx Emissions during
Crank-Start and Cold Fast-Idle in a GDI Engine
The MIT Faculty has made this article openly available. Please share
how this access benefits you. Your story matters.
Citation
Rodriguez, J. Felipe and Cheng, Wai K. “Analysis of NOx Emissions
During Crank-Start and Cold Fast-Idle in a GDI Engine.” SAE
International Journal of Engines 10, no. 2 (March 28, 2017): 646–655.
©2017 SAE International.
As Published
http://dx.doi.org/10.4271/2017-01-0796
Publisher
SAE International
Version
Author's final manuscript
Citable link
http://hdl.handle.net/1721.1/108133
Terms of Use
Creative Commons Attribution-Noncommercial-Share Alike
Page 1 of 10
2017-01-0796
Analysis of NOx emissions during crank-start and cold fast-idle in a GDI engine
Author, co-author (
Do NOT enter this information. It will be pulled from participant tab in
MyTechZone
)
Affiliation (Do NOT enter this information. It will be pulled from participant tab in MyTechZone)
Abstract
The NOx emissions during the crank-start and cold fast-idle phases of a GDI engine are analyzed in detail. The NOx emissions of the first 3 firing cycles are studied under a wide set of parameters including the mass of fuel injected, start of injection, and ignition timing. The results show a strong dependence of the NOx emissions with injection timing; they are significantly reduced as the mixture is stratified. The impact of different valve timings on crank-start NOx emissions was analyzed. Late intake and early exhaust timings show similar potential for NOx reduction; 26-30% lower than the baseline. The combined strategy, resulting in a large symmetric negative valve overlap, shows the greatest reduction; 59% lower than the baseline. The cold fast-idle NOx emissions were studied under different equivalence ratios, injection strategies, combustion phasing, and valve timings. Slightly lean air-fuel mixtures result in a significant reduction of NOx. The engine-out emissions are highly sensitivity to combustion phasing. Initial retard results in lower mass NOx emissions up to CA50 around 40 °CA aTDC-compression. After this point the increase in fuel consumption and the reduction on residual fraction reverse the trend leading to an increase in NOx mass emissions for later combustion phasing. Moderate exhaust timing advance is beneficial for NOx emissions and has no impact on the exhaust enthalpy flow.
Introduction
The market penetration of gasoline direct injection (GDI) engines has increased rapidly over the past decade, going from virtually 0% in 2007 to over 46% market share in 2015 for the US passenger cars [1]. The accelerated market adoption of GDI has been driven by the light-duty vehicle (LDV) fuel economy standards, given the benefits of the technology for reducing fuel consumption by enabling turbo-downsized engine concepts. Simultaneously to the fuel economy regulation, new, and more stringent pollutant emissions limits will soon come into force and will be gradually phased in over the next decade. Figure 1 shows the past, present and future US federal limits for pollutant emissions that the fleets of LDV's manufacturers have to comply with. From 1994, and looking forward to 2026, the combined limit for NOx and HC emissions, which in combination are responsible for smog formation, will see a reduction of over 96%. Similarly, the maximum PM emissions, which contribute to respiratory diseases, will reduce in 97% in the same time frame.
The mixture formation process of GDI engines at cold temperatures poses some emissions challenges that need to be addressed to guarantee the future of the technology in the context of stringent emissions standards. During cold-start, the combustion chamber walls
are at a lower temperature than the saturation temperature of most of the fuel species; the results are the formation of fuel films which fail to completely evaporate prior to combustion, and a heterogeneous fuel-air distribution.
Figure 1. US federal fleet average emissions limits for light-duty vehicles over the FTP-75 driving schedule
Figure 2 shows the tailpipe NOx, HC, and PM emissions during the FTP-75 for two representative engines [2, 3]. In the representative case of Figure 2, the cold-start phase contributes to 58% of the NOx emissions, 79% of the HC emissions and 77% of the PM emissions.
Figure 2. Relative cumulative tailpipe NOx, HC, and PM emissions over the FTP-75 cycle for gasoline engines. Data source: NOx and HC [2]; PM [3]
Tier 1 NLEV Tier 2 Tier 3
F le et a v er g ae d l im it / g /m i 0.003 0.03 0.9 0.1 '01 '04 '17 '94 '26 NMOG + NOx PM
US federal emissions limits FTP-75 driving schedule
Cold Start Transient Hot Start NOx C u m u la ti v e ta il p ip e em is si o n s / % 0 25 50 75 100 HC FTP-75 PM
Page 2 of 10
Zooming in to the cold-start phase, it is evident that the engine crank-start and cold fast-idle phases are responsible for a disproportionate share of the cold-start emissions. Figure 3 shows the performance and emissions characteristics of a typical cold crank-start of a GDI engine. The cumulative NOx, HC and PM emissions are referenced to the U.S. T3B50/ULEV50 limits, assuming the same HC/NOx ratio as the T2B5 standard.
Figure 3. Cylinder pressure, engine speed, intake manifold pressure and cumulative emissions as percentage of the T3B50/ULEV50 limit during cold crank-start. The NOx and HC limits of T3B50 assumes the same HC/NOx ratio as the T2B5 standard.
The findings presented in this paper focus exclusively on the NOx emissions of GDI engines during crank-start and cold fast-idle. The results are divided in three main sections corresponding to the cycle-by-cycle study, full crank-start analysis and cold fast-idle. The core of the investigation was carried out experimentally, with engine simulation providing support to understand the observed trends. This study is part of a wider effort undertaken at MIT to understand and mitigate the engine-out pollutant emissions during the cold-start phase of gasoline engines [4, 5, 6, 7, 8, 9, 10]. This paper follows the methodology developed by the authors in previous studies focusing on HC and PM emissions [4, 5].
Experimental Methodology
Engine set up
The engine used in this study was a commercial 4-cylinder, 2 liter engine, with side-mounted electromagnetic injectors. The injectors have a 52° cone angle, a 25° inclination from the horizontal and 6 holes. Further information on the engine geometry, including the baseline valve timing can be found in Table 1.
Table 1. Specifications of the GM – LNF engine
Displacement 1998 cc
Bore / Stroke 86 / 86 mm
Connecting Rod 145.5 mm
Compression ratio 9.2:1
Fuel pressure 50 bar
Intake Valve Open / Close 11°aTDC / 61°aBDC @ 0.2 mm lift Max. intake valve lift 10.3 mm @ 126°aTDC
Exhaust Valve Open / Close 52°bBDC / 10°bTDC @ 0.2 mm lift Max. exhaust valve lift 10.3 mm @ 125°aTDC
The fuel pressure during crank-start of a GDI engine depends significantly on engine speed; as the engine accelerates from the cranking speed to the speed flare the fuel pressure increases. The typical pressure for the initial engine cycles ranges between 30 and 70 bar [11, 12] and is heavily dependent on engine speed. To eliminate the influence of engine speed on the fuel pressure, the experimental setup for this study used a hydro-pneumatic accumulator pressurized to 50 bar by nitrogen. The fuel used was a Tier II EEE certification gasoline with a carbon mass fraction of 86.5%, 29% aromatics content and a Reid vapor pressure of 62.7 kPa. Three independent chillers for the fuel, intake air, engine oil and coolant were used to maintain the cold-start conditions, with all temperatures at 20°C.
The NOx mole fraction in the exhaust was measured using a fast response chemiluminescence detector (CLD). The CLD had a 10 to 90% time response of 4 ms. It uses a discharge generator for ozone
(O3) production. The reaction chamber, where NO and O3 react to form
NO2 in an electrically excited state, is located approximately 30 cm
from the tip of the sampling probe. The photons emitted by the NO2
returning to its ground state are transferred to a photomultiplier detector through an optical fiber. Since the analyzer cannot measure
NO2 directly, a NO2 to NOx ratio of 2% [13] was assumed.
Figure 4. Diagram of the experimental setup and the sensor locations
To quantify the NOx emissions during cold-start, especially during the transient phase, it is necessary to relate the NOx mole fraction measurement to the mass flow rates of the exhaust stroke. The slow response of gas flow meters make them unsuitable for the cycle-resolved analysis sought in this work. Therefore, the exhaust mass flow rate was model, as shown in Eq. 1, using the cylinder pressure data and piston position as the model inputs.
P e rc e n ta g e o f T 3 B 5 0 l im it / % 0.5 9 17 36 HC emissions C u m u la ti v e E m is si o n s CO emissions PM emissions NOx emissions Time / s 0 1 2 3 4 C y li n d e r P re ss u re / b a r 0 5 10 15 20 25 30 35 M A P / b a r 0.0 0.5 1.0 E n g in e S p e e d / r p m 300 600 900 1200 Neng MAP Pcyl
Page 3 of 10 𝑚̇𝑒𝑥ℎ= − ( 1 𝛾 𝑃𝑐𝑦𝑙 𝑑𝑃𝑐𝑦𝑙 𝑑𝑡 + 1 𝑉𝑐𝑦𝑙 𝑑𝑉𝑐𝑦𝑙 𝑑𝑡 ) 𝑚𝑐𝑦𝑙 (1) Equation 2 shows the approach used for synchronizing the NOx mole fraction, as measured by the fast response CLD, with the modeled exhaust mass flow rate. It corrects for the transit time of the exhaust gases to the sampling location and for the intrinsic response time of the analyzer. The response and transit times are in the same order of magnitude; thus, the latter cannot be omitted.
𝑚𝑁𝑂𝑥,𝑐𝑦𝑐𝑙𝑒 = ∫ 𝑥̂𝑁𝑂𝑥(𝑡 + 𝜏(𝑡)) 𝑀𝑊𝑁𝑂𝑥 𝑀𝑊𝑒𝑥ℎ 𝑑𝑚𝑒𝑥ℎ 𝑑𝑡 𝑑𝑡 𝑡𝐸𝑉𝐶 𝑡𝐸𝑉𝑂 (2)
Experiment description
Three different set of experiments were conducted to characterize the NOx emissions during cold-start in a GDI engine. First, the cycle-by-cycle emissions were studied individually for the initial 3 cycle-by-cycles, under a wide set of parameters. Second, the complete crank-start was investigated using different valve-timings. Lastly, the NOx emissions during the cold fast-idle phase were addressed.
Cycle-by-cycle experiments
The focus of this analysis was placed on cylinder 4. To eliminate the pressure, temperature and composition interactions from neighboring cylinders on cylinder 4, the engine was operated in single-cylinder mode. As a consequence, the engine was unable to achieve a speed transient that is representative of a 4-cylinder engine during crank-start. To avoid this, the engine was torque-assisted by a 10 hp electric motor during the simulated crank-start experiments. As shown in Figure 5, the motor triggering point and speed-ramp were tuned to achieve similar speed traces between multi-cylinder and single-cylinder crank-start. The experiments start with the engine motoring at 280 rpm until steady state conditions are achieved. After the steady-state motoring, 1, 2 or 3 combustion events take place. Thereafter, engine is motored while the exhaust until the purging is completed and the engine returns to steady-state conditions. The throttle opening was fixed at the fast-idle position and the fuel injected was a function of the speed-density calibration.
Figure 5. Representative engine speed and pressure traces for the 1st (a), 2nd (b), and 3rd (c) cycle experiments
Five experiments were run for each experimental condition. The runs were separated by two minutes cool down period with the chilled water circulating to ensure the return to the initial conditions. Since only one, two, or three combustion events took place, experience showed that a
two minute interval was sufficient. In-between runs, the engine was motored at 280 rpm to ensure the complete cylinder and oil layer purging. The results reported in this paper for each experimental condition correspond to the average of the five runs. The run to run coefficient of variation was approximately 15%. This value was however larger as NOx emissions were reduced due to the sensitivity, accuracy and resolution of the fast CLD at low NOx concentrations.
Complete crank-start experiments
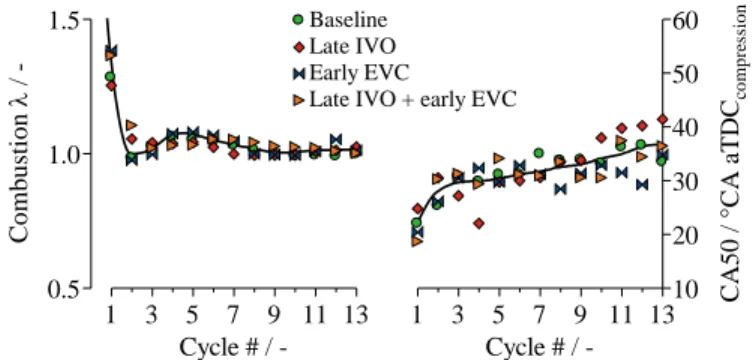
The impact on NOx emissions of four combinations of exhaust timing advance and intake timing retard, shown in Table 2, were investigated during cold crank-start. As shown in Figure 6, the effects of valve timing on NOx emissions were isolated by adjusting the injected fuel mass for each cycle in order to obtain a similar combustion lambda during crank-start for all valve timing cases. Furthermore, the spark timing for each cycle was adjusted, so that the point for 50% of heat release (CA50) was similar for all valve timing cases studied. For each valve timing setting, the throttle position was fixed throughout the cranking process at a position resulting in steady-state conditions of 2 bar NIMEP at 1200 rpm. Each condition was run 5 times; the results reported are the average values.
Figure 6. Combustion lambda and CA50 during the crank-start process for all four valve timings studied
Table 2. Valve timings investigated
Case name Intake timing
@0.2mm lift
Exhaust timing @0.2mm lift
Baseline IVO=11°CA aTDC
IVC=61°CA aBDC
EVC=10°CA bTDC EVO=52°CA bBDC
Late IVO IVO=42°CA aTDC
IVC=92°CA aBDC
EVC=10°CA bTDC EVO=52°CA bBDC
Early EVC IVO=11°CA aTDC
IVC=61°CA aBDC EVC=41°CA bTDC EVO=83°CA bBDC Symmetric NVO (C IVO=42°CA aTDC IVC=92°CA aBDC EVC=41°CA bTDC EVO=83°CA bBDC
Table 3. Cold fast-idle conditions
Engine speed 1200 rpm
NIMEP 2 bar
External EGR 0 %
Fuel pressure 50 bar
Number of cycles in average 150 cycles
E n g in e S p ee d / r p m 280 1200
Cycle number (cyl. 4) /
-1 2 3 4 Motor-assisted single-cylinder mode Multi-cylinder crank-start 1st cycle experiment 2nd cycle experiment 3rd cycle experiment C o m b u st io n l / -0.5 1.0 1.5 Cycle # / -1 3 5 7 9 11 13 Baseline Late IVO Early EVC
Late IVO + early EVC
C A 5 0 / ° C A a T D Cco m p re ss io n 10 20 30 40 50 60 Cycle # / -1 3 5 7 9 11 13
Page 4 of 10
Fast-idle experiments
The cold fast-idle is a short quasi-steady (see Table 3) period between the end of the crank-start and the first acceleration event in the certification cycle. In the case of the FTP-75 the idling period before the first transient has a duration of 20 seconds. The objectives during the cold fast-idle are twofold: to provide a high thermal enthalpy flow to reduce the catalyst light-off time while keeping the pollutant emissions as low as possible. Different air fuel ratios, injection strategies, valve timings and combustion timings were investigated.
Results and discussion
Cycle-by-cycle NOx emissions
This section deals with the NOx emissions of the initial 3 engine cycles during the cold crank-start process of a GDI engine. The cycle-resolved results are analyzed individually under a set of parameters including the stoichiometry of the mixture, the start of injection (SOI), and the ignition timing.
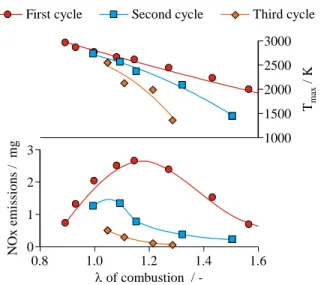
Figure 7. NOx emissions per cylinder and cylinder averaged maximum temperature of the initial three cycles during crank-start as a function of the equivalence ratio
Table 4. Fuel enrichment during the initial 3 cycles during cold crank-start
Cycle number Injected fuel mass range Mass from fuel map Resulting lambda range 1 50 – 100 mg 30 mg 0.9 – 1.6 2 34 – 55 mg 26 mg 1 – 1.5 3 27 – 40 mg 21 mg 1.05 – 1.3
The cold conditions of the combustion chamber during cold crank-start present challenges for the mixture formation in the initial combustion cycles. As a consequence, the required fuel injection to produce stable combustion and avoid misfire is greatly higher than in steady-state operation. Table 4 shows the investigated ranges of fuel enrichment
and the resulting lambda of combustion, as calculated from CO2 and
CO mole fractions. Over-enrichment factors between 1.5 and 2.5 are necessary. As shown in Figure 7, the NOx emissions of the initial 3
cycles peak at different combustion lambdas. The decrease in NOx emissions to the left of the maxima is due to the lower oxygen availability of the over-enriched mixture, despite the higher temperatures. To the right of the maxima, the decrease in NO production is a consequence of lower combustion temperature from the diluted charge. The temperature metric is the cylinder averaged maximum temperature.
The NOx emissions show a strong dependence with SOI covering a
range from 0.1 – 3 mg for the 1st cycle, 0.13 – 1.1 mg for the 2nd and
0.06 – 0.23 mg for the 3rd (Figure 8). The injection timing influences
the amount and timing of the heat release from combustion as well as the spatial distribution of the AFR. Given that NOx formation is driven by both temperature and oxygen availability, the cylinder averaged temperatures serves as a good first order indicator. As observed in Figure 8, up to SOI =225°CA aTDC-i the maximum cylinder-averaged temperature and the NOx emissions exhibit very similar trends. For later injection timings, as the mixture becomes stratified, the oxygen availability in the high-temperature zone is reduced. Therefore, the cylinder-averaged maximum temperature and the NO production are not tightly coupled for late injection events.
Figure 8. NOx emissions and cylinder averaged maximum temperature of the initial three cycles during crank-start as a function of SOI. For the 3rd cycle,
SOI in the range from 240 to 300 °CA aTDC-i resulted in misfire or partial burn and were not included in the results
Figure 9 shows the NOx emissions for the initial 3 cycles as a function of combustion phasing. The NOx emissions vary greatly with ignition timing between 0.1 and 3 mg, and they peak at CA50 values between -5 and -10 °CA aTDC-c. The reduction of NOx emissions with later combustion phasing has a straight forward explanation; delayed ignition reduces the peak temperatures and thus NO production. On the
First cycle Second cycle Third cycle
N O x e m is si o n s / m g 0 1 2 3 l of combustion / -0.8 1.0 1.2 1.4 1.6 Tm ax / K 1000 1500 2000 2500 3000
First cycle Second cycle Third cycle
Tcy l, m ax / K 1600 1900 2200 2500 N O x1st / m g 0 1 2 3 NOx Tmax N O x2n d / m g 0.0 0.3 0.6 0.9 1.2 Tcy l, m ax / K 2000 2300 2600 N O x3rd / m g 0.0 0.1 0.2 0.3
SOI / °CA aTDCintake
45 90 135 180 225 270 315 Tcy l, m ax / K 1500 2000 2500
Page 5 of 10
other hand, advancing CA50 to angles earlier than -10 °CA aTDC-c results in NOx emissions reduction, despite the increase in cylinder-averaged maximum temperature. The observed trend can be explained by considering the time available for mixture formation. As the spark timing is advanced, the time between end of injection and ignition is reduced, leading to increased mixture heterogeneity. As a result, the local and temporal enrichment of the mixture around the spark plug for advanced ignition timings reduces the oxygen availability and limits the NO formation rate. Additionally, the evaporation of fuel films towards the end of the flame propagation at advanced spark timings results in a richer end-gas mixture with a reduced oxygen availability.
Figure 9. NOx emissions and cylinder averaged maximum temperature of the initial three cycles during crank-start as a function of the combustion phasing
Valve timing impact on crank-start NOx emissions
Four different valve timings were investigated corresponding to the different combinations of exhaust timing advance and intake timing retard, as shown in Figure 10.
Figure 10. Baseline intake and exhaust timings and direction of phasing for the other investigated valve timings
In the late IVO setting, the intake valves remain closed during the initial part of the intake stroke resulting in a drop in the cylinder pressure. When the intake valves open, the pressure differential across the valves results in increased turbulence intensity during the initial portion of the intake stroke, benefiting the mixture formation process. Furthermore, as the IVO timing is delayed, the IVC timing is shifted to the mid-compression stroke reducing the effective compression ratio (ECR). Lower ECR results in lower temperatures during the combustion process of the initial engine cycles during crank-start [5]. Advancing the exhaust valve timing (early EVC) impacts directly the internal gas recirculation. With early EVC timing, the exhaust stroke is truncated by valve closure, thereby increasing the amount of exhaust gas trapped at the end of the stroke. The higher residual gas fraction increases the charge temperature at the end of the intake stroke (due to mixing with hot residual gases) and lowers the peak temperature during the combustion process (due to charge dilution). Cycle simulations show that advancing the EVC 40°CA from the baseline position results in an increase in residual gas fraction from 10% to 25% [5].
Figure 11. Cycle-by-cycle NOx emissions, NIMEP, engine speed and MAP traces during cold crank-start for baseline and late IVO.
Figure 11 shows the first 2 seconds, approximately the initial 13 engine cycles, of the cold crank-start process. The data presented comprises the period between the start of cranking and the speed flare for both the baseline and late IVO cases. Delaying the intake timing results in lower NIMEP for cycles #1 and #2 due to the reduced effective compression ratio (Figure 11, top). The consequence is a slower engine acceleration during the run-up process. As the engine accelerates towards the speed flare, the intake manifold pressure decreases more rapidly in the baseline case due to the smaller throttle angle required
to achieve 2 bar of NIMEP at steady state. From the 3rd engine cycle
on, the lower cylinder volumetric efficiency of the late IVO setting is compensated by the wider throttle opening and comparable NIMEP traces are obtained. The NO formation rate is driven by the in-cylinder temperature during the combustion process. As such, it correlates well with NIMEP. For both valve settings, the peak NOx emissions occur
N O x e m is si o n s / m g 0 1 2 3
CA50 / °CA aTDCcomp.
-15 5 25 45 Tm ax / K 2000 2500 3000 First cycle Second cycle Third cycle
Delay intake opening Advance exhaust closing 21° 11° Baseline:
cumulative; per cycle
Late IVO:
cumulative; per cycle
M A P / b ar 0.3 1.0 Time / s 0.0 0.5 1.0 1.5 2.0 Late IVO N IM E P / b ar 0 2 4 6 8
Cycle # for cyl. 4 /
-1 3 5 7 9 11 13
Baseline Late IVO
Fixed throttle for 2 bar
NIMEP at fast idle E
n g in e S p ee d / r p m 300 500 700 900 1100 1300 Cycle # for cyl. 4 /
-1 2 4 6 8 -10 -13 N O x ( cy l. 4 ) / m g 0 1 2 3
Cycle # for cyl. 4 /
-1 3 5 7 9 11 13
Page 6 of 10
during the 1st cycle and decrease monotonically thereafter to a
steady-state value of approximately 0.05 mg/cyl./cycle. The reduction in effective compression ratio, caused by the delayed intake valve setting, results in 30% lower NOx emissions for the late IVO setting in comparison to the baseline. This reduction in cumulative NOx emissions stems from the initial two cycles.
The next case analyzed is the early exhaust valve setting; the results for the first 2 seconds of crank-start for the early EVC and baseline strategies are shown in Figure 12. The higher residual gas fraction from early EVC does not impact substantially the NIMEP trace and the engine speed run-up when compared to the baseline case. The intake pressure, on the other hand, is higher for the early EVC setting due to the wider throttle position required to compensate for the charge
dilution by residual gases. During the cranking process, the 1st engine
cycle is characterized by the absence of residual gases. Consequently,
the NO formation during the 1st cycle for both cases, early EVC and
baseline, is comparable (Figure 12, bottom). From the 2nd cycle on, the
increased internal EGR caused by early EVC has an impact on the
emissions behavior. The charge dilution achieved after the 2nd cycle
lowers the peak temperatures during combustion and results in an approximate 50% reduction in NO production and emission. Cumulatively, an early EVC strategy results in a 26% reduction in NOx emissions in comparison to the baseline during the initial 13 crank-start cycles.
Figure 12. Cycle-by-cycle NOx emissions, NIMEP, engine speed and MAP traces during cold crank-start for baseline and early EVC.
The final valve timing strategy studied, referenced as symmetric NVO, is a combination of late IVO and early EVC. The intake valve timing was delayed by the same amount the exhaust valve timing was advanced. A significant reduction in NIMEP can be observed for the first 3 engine cycles of the symmetric NVO case. This observation is a consequence of the reduction in fresh mixture trapped at IVC and of the increase in losses from early EVO during the expansion stroke. For later cycles, the wider throttle to achieve 2 bar of NIMEP, compensates the aforementioned loses. The intake pressure after 2 seconds for the symmetric NVO strategy is 0.65 bar; significantly higher than the 0.3
bar for the baseline and 0.5 bar for the late IVO and early EVC strategies. The resulting speed trace combines the features of late IVO and early EVC; a slowed down engine run-up with a reduced speed flare. Compared to the baseline, the cumulative NOx emissions achieved with the symmetric NVO setting (Figure 13, bottom) show a significant reduction of 59%. The lower cumulative NOx emissions are the combined result of 2 effects. First, late IVO/IVC results in a reduced effective compression ratio and thus in lower peak temperature during the first 2 engine cycles. Second, the increased
residual gas fraction after the 2nd cycle dilutes the charge, lowering the
combustion temperature and reducing the NO formation rate.
Figure 13. Cycle-by-cycle NOx emissions, NIMEP, engine speed and MAP traces during cold crank-start for baseline and symmetric NVO.
Cold fast-idle NOx emissions
The results presented in this chapter focus on the NOx emissions during the cold fast-idle phase. The fast-idle conditions are defined in Table 3. The variables studied and object of this section are: air-fuel equivalence ratio, split-injection strategies, combustion phasing, and valve timing.
During standard operation of stoichiometric gasoline engines, the mixture stoichiometry is cautiously regulated around λ = 1 to ensure that the three way catalyst (TWC) maintains the required oxygen
storage for oxidizing HC and CO emissions to CO2 and reducing NOx
emissions to N2. During the cold fast-idle period, the TWC is
catalytically inactive and the stoichiometric constrain is lifted. Figure
14 shows the pollutant emissions and combustion behavior for five
different λ values. The experiments were conducted at constant spark timing and constant fuel mass with the air-fuel ratio being controlled by the throttle position.
As shown in top left panel of Figure 14, NOx emissions peak at λ = 0.975. The reduced flame speed of the leaner mixture at constant spark timing results in a delay in combustion phasing (Figure 14, bottom) and thus, in lower peak temperatures. As the mixture becomes leaner Baseline:
cumulative; per cycle
Early EVC:
cumulative; per cycle
M A P / b ar 0.3 1.0 Time / s 0.0 0.5 1.0 1.5 2.0 Early EVC N IM E P / b ar 0 1 2 3 4 5 6 7 8
Cycle # for cyl. 4 /
-1 3 5 7 9 11 13
Baseline Early EVC
Fixed throttle for 2 bar
NIMEP at fast idle E
n g in e S p ee d / r p m 300 500 700 900 1100 1300 Cycle # for cyl. 4 /
-1 2 4 6 8 -10 -13 N O x ( cy l. 4 ) / m g 0 1 2 3
Cycle # for cyl. 4 /
-1 3 5 7 9 11 13 NOx: -26% M A P / b ar 0.3 1.0 Time / s 0.0 0.5 1.0 1.5 2.0 Late IVO &
early EVC N IM E P / b ar 0 1 2 3 4 5 6 7 8
Cycle # for cyl. 4 /
-1 3 5 7 9 11 13
Baseline Late IVO & early EVC
Fixed throttle for 2 bar
NIMEP at fast idle E
n g in e S p ee d / r p m 300 500 700 900 1100 1300 Cycle # for cyl. 4 /
-1 2 4 6 8 -10 -13 N O x ( cy l. 4 ) / m g 0 1 2 3
Cycle # for cyl. 4 /
-1 3 5 7 9 11 13
NOx: -59% Baseline:
cumulative; per cycle
Late IVO & early EVC : cumulative; per cycle
Page 7 of 10
at constant fuel mass, the adiabatic flame temperature decreases slightly while the oxygen concentration increases. For richer mixtures the lack of oxygen concentration slows the NO formation rate. The combined effect of reduction in temperature due to the later combustion phasing and the oxygen availability result in NOx emissions peaking at a slightly fuel-rich AFR. On the other hand, the HC and PM emissions exhibit a monotonic reduction with increasing λ. The higher oxygen concentration of the leaner mixture and the hotter burned gas temperature from delayed combustion phasing increase the post-flame oxidation rates. The particle formation and growth during cold-start takes place mainly in the fuel-rich regions in the combustion chamber [10]. The increase in oxygen content and the higher burned temperature of leaner mixtures reduce the amount of fuel available for PM formation through post-combustion pyrolysis.
Figure 14. NOx, HC and PM emissions and combustion behavior as a function of equivalence ratio (Spark timing = 5°CA aTDC-c, SOI = 105°CA aTDC-i, fuel mass = 17.1 mg, baseline valve timing)
Figure 15. NOx, HC and PM emissions and combustion behavior of stoichiometric mixture as a function of split injection distribution (SOI1 =
105°CA aTDC-i, SOI2 = 165°CA aTDC-i, spark timing = 5°CA aTDC-c,
baseline valve timing)
The results show that leaner mixtures are favorable for reducing the cold fast-idle emissions. Nevertheless, the applicability of enleanment
as an emissions reduction strategy is limited by engine stability as
quantified by the COVNIMEP; the cycle-to-cycle variability increases
proportionately to λ. However, since the experiment was performed at constant spark timing, the effects of delayed combustion phasing and mixture enleanment are confounded.
The fuel spray penetration is a function of the fuel pressure and the injection duration. Depending on the injection timing, a large spray penetration could result piston, intake valve, or wall wetting. At constant fuel pressure, splitting the fuel delivery into multiple injections events can reduce the penetration length of the separate injection pulses. Figure 15 shows the pollutant emissions and combustion characteristics during fast idle for different split ratios of
a double injection strategy with SOI1 = 105°CA aTDC-i and SOI2 =
165°CA aTDC-i. The decrease in wall wetting results in a reduction in the fuel requirement to achieve the targeted NIMEP. Furthermore, the HC and PM emissions of the split injection strategy exhibit a significant reduction in comparison to single injection. The NOx emissions show a minimum at a split ratio y1/y2 = 25/75, presumably as a consequence of the mixture homogeneity and a reduction of the regions with high temperatures and high oxygen availability.
Figure 16. Simulated NOx emissions as a function of CA50 for a stoichiometric mixture during cold fast-idle conditions
Figure 17. Experimental P-V diagram and cylinder temperature for three different combustion phasing.
N O x m o le f ra ct io n / p p m 100 105 110 115 120 125 130 l / -0.95 1.00 1.05 C o VN IM E P / % 7 8 9 10 11 l / -0.95 1.00 1.05 C o m b u st io n p h as in g / °C A a T D Cco m p . 40 50 60 70 80 90 l / -0.95 1.00 1.05 CA10 CA50 CA90 H C m o le f ra ct io n / p p m 1000 2500 4000 5500 7000 P M c o n ce n tr at io n / µ g / l 0.5 1.0 1.5 2.0 2.5 y1 / % 0 25 50 75 100 H C m as s fl o w / g /h 2500 2600 2700 2800 2900 3000 N O x m as s fl o w / g /h 80 90 100 110 120 130 y1 / % 0 25 50 75 100 y2 / % 0 25 50 75 100 y2 / % 0 25 50 75 100 C o VN IM E P / % 6 7 8 9 10 11 12 13 F u el m as s / m g 15.5 16.0 16.5 17.0 17.5 18.0 P M m as s fl o w / m g /h 0.30 0.40 0.50 0.60 0.70 0.80 HC PM Simulation N o rm al iz ed r es u lt s to C A 5 0 = 5 ° C A a T D Cco m p . 0.5 1 1.5 0.2 2
CA50 / °CA aTDCcomp.
0 10 20 30 40 50
Increase due to higher mass flow Reduced
efficiency Air mass flow
NOx mass flow
Increasing peak temperature and reduced internal EGR NOx mole fraction
Pcy l / b ar 0 5 10 15 Vcyl / cm3 60 560 C y li n d er a v er ag ed te m p er at u re / K 300 800 1300 1800 2300
Piston position / °CA
0 180 360 540 720
CA50 =
5°CA aTDCcomp. 42°CA aTDCcomp. 80°CA aTDCcomp.
Page 8 of 10
Delayed spark timing is a most common strategy used to reduce the light-off time of the TWC during cold-start. However, as combustion delay affects thermal efficiency and the combustion and post-flame temperatures, it also has a direct impact on the engine-out emissions. Using cycle simulations incorporating the Zeldovich-Keck mechanism for NO formation, the impact of combustion phasing on NOx emissions during fast-idle was studied in a simplified system. Figure 16 shows the results of the simulation exercise. As the combustion phasing is delayed the NOx mole fraction initially goes down; however, after a certain CA50, the trend is reversed. This is due to an increase in the combustion temperature, as shown in the experimental traces in Figure 17, and a decrease in the residual gas fraction due to the lower density of the hotter exhaust gases.
The NOx mass emissions exhibit a similar trace, but the CA50 for the minimum emissions is located to the left of the minimum of the mole fraction. As combustion phasing is delayed, the thermodynamic efficiency of the engine decreases. Consequently, the required air and fuel mass flow rates to keep the targeted NIMEP constant, increase. In order to separate the effects of increased exhaust mass flow from the effects of volumetric pollutant formation, two different metrics are used. The first one tracks the changes in pollutant emissions on a per mass basis, by referencing the NOx mass emissions to the amount of fuel injected. This metric, the emissions index, is independent of the air and fuel mass flow rates. To account for the change in emissions as a consequence of a change in air mass flow, the net indicated specific emissions is used.
Figure 18. NOx emissions indices and combustion stability metrics as a function of combustion phasing for 3 different values of exhaust advance
The engine-out emissions performance of two different levels of exhaust advance, 16°CA and 31°CA are presented in Figure 18. NOx emissions show a significant improvement with EVC advance. As shown in Figure 19, the residual gas fraction increases non-linearly with EVC advance and is independent of the intake timing.
The higher heat capacities of CO2 and water in comparison to air, make
the internal EGR an effective diluent for reducing the peak temperatures in the combustion chamber and slowing the NO formation rate. The reduction in NOx emissions is more prominent for early combustion phasing. For CA50 later than 30°CA aTDC-c the
reduction with early EVC is approximately constant. For an EVC advance of 16°CA a 35% NOx reduction is observed, while an advance of 31°CA results in 60% improvement in comparison to the baseline.
Figure 19. Residual gas fraction at cold fast-idle as a function of valve timing
The increase in residual gas fraction from early EVC reduces the flame propagation speed and consequently deteriorates the CoV and LNV of NIMEP. The moderate exhaust advance increases the slope of the CoV trace in 20%, while the most advanced EV results in a similar increase in slope with an additional offset of 3.5% CoV.
Figure 20. NOx emissions indices and combustion stability metrics as a function of combustion phasing for 3 different values of symmetric NVO
Similarly, Figure 20 shows the NOx emissions behavior of two symmetric NVO cases investigated; EV advance and IV delay of 12°CA and 24°CA respectively. The engine-out NOx trend and relative NOx reduction resemble the results presented in the previous section for EVC advance alone. However, in comparison to the early EVC alone strategy, the same reduction in NOx emissions is achieved with a lower residual gas fraction (see Figure 19). This observation can be explained by factoring in the reduction in peak cylinder temperatures brought alone by the delayed intake timing of the symmetric NVO valve setting.
EVC Advance: 0°CA 16°CA 31°CA
E INO x / m g N O x / gfu el 0 1 2 3 4 5 is N O x / g /k W h 0 1 2 3
CA50 / °CA aTDCcomp.
0 20 40 60 80 C o VN IM E P / % 0 3 6 9 12 15 L N VN IM E P / % 50 60 70 80 90 100
CA50 / °CA aTDCcomp.
0 20 40 60 80 19 19 17 17 15 15 13 13 8 9 10 18 16 14 12 11 19 19 17 17 15 15 13 13 8 9 10 18 16 14 12 11 E V a d v an ce / ° C A 32 24 16 8 0 IV delay / °CA 0 8 16 24 32
Late intake valve opening / closing
E ar ly e x h au st v al v e o p en in g / cl o si n g xr in % (Simulation)
EVC Advance / IVO delay: 0°CA 12°CA 24°CA
E INO x / m g N O x / gfu el 0 1 2 3 4 5 is N O x / g /k W h 0 1 2 3
CA50 / °CA aTDCcomp.
0 20 40 60 80 C o VN IM E P / % 0 3 6 9 12 15 L N VN IM E P / % 50 60 70 80 90 100
CA50 / °CA aTDCcomp.
Page 9 of 10
Figure 21. Effective compression ratio and modeled cylinder peak temperature as a function of intake valve timing delay during cold fast-idle
As shown in Figure 21, delayed intake timing reduces the effective compression ratio of the engine due to late IVC. As a result, the charge temperature at the end of compression is reduced and, by the same token, a reduction in the peak temperature of combustion is observed. This reduction in temperature compensates for the lower residual gas fraction trapped in comparison to the early EVC strategy, resulting in similar NOx reduction. The CoV of NIMEP suffers a 20% deterioration with moderate symmetric NVO and more than doubles with the more aggressive NVO strategy. Similarly, the LNV of NIMEP deteriorates in approximately 10% with moderate symmetric NVO and in approximately 30% with the more aggressive NVO strategy.
Conclusions
The NOx emissions of a GDI engine during cold crank-start and cold fast-idle were analyzed in detail. The analysis included cycle-by-cycle experiments, complete cold crank-starts with unconventional valve timings and several operating strategies during cold fast-idle. The following conclusions were drawn:
1. In the cycle-by-cycle analysis, NOx emissions are highly
dependent on combustion temperature and air fuel distribution. In the case of mixture heterogeneities due to mixture stratification or flow structure, rich zone can result in a reduction of oxygen availability and consequently lead to lower NOx emissions. As a result NOx emissions do not always correlate well with the maximum cylinder-averaged temperature.
2. Late IVO improves the mixture formation process in cold
crank-start. The delayed intake timing results in 30% reduction of the cumulative NOx cold crank-start emissions. During the initial cycles, late IVC results in lower NIMEP and in-cylinder temperatures reducing the rate of NO formation.
3. The effect of early EVC timing on the crank-start NOx
emissions is due to the increase in residual gas fraction. As
such, it does not have any effect on the 1st cycle NO
formation. An early EVC strategy shows improvements in
NOx emissions after the 2nd engine cycle, resulting in 26%
reduction in cumulative NOx emissions.
4. The symmetric NVO strategy, consisting of late intake and
early exhaust phasing, shows a 59% reduction in the cumulative crank-start NOx emissions due to the combination of increased residuals and lower NIMEP of the initial cycles.
5. Since the cold fast-idle period is not constrained by the
stoichiometric requirements, the use of lean air-fuel mixture is a viable option to achieve a significant reduction of NOx engine-out emissions. However, the applicability of mixture enleanment is limited by combustion stability.
6. A 50/50 split strategy, where the first injection event occurs
during maximum intake valve lift and the second close to bottom dead center exhibited the best balance between emissions and engine stability.
7. The engine-out NOx emissions have a high sensitivity to
combustion phasing. Initial retard results in a significant reduction of NOx up to a CA50 of around 40°CA aTDC-c. Further combustion delay increases the fuel use and peak temperature due to the lower indicated thermal engine efficiency. Furthermore it reduces the residual gas mass fraction due to the hotter exhaust gases. These two effects reverse the trend and lead to an increase in NOx emissions as the combustion phasing is further retarded.
8. Exhaust valve timing advance is beneficial for engine-out
emissions as a result of the higher residual gas fraction. The combined use of intake timing delay and exhaust valve advance, symmetric NVO, exhibits the same emissions trends as early EVC alone. The decreased effective compression ratio from late IVO reduces the peak cylinder temperature and pressure and similar improvements in NOx emissions can be achieved with lower residual gas fractions
References
1. Davis, Stacy, Susan Williams, Ridge Boundy, and Sheila
Moore. “Vehicle Technologies Market Report 2015.” Oak Ridge National Laboratory, 2016.
2. Ball, Douglas, Corey Negohosian, Deven Ross, David Moser,
and Richard McClaughry. “Comparison of Cold Start Calibrations, Vehicle Hardware and Catalyst Architecture of 4-Cylinder Turbocharged Vehicles.” SAE International Journal of Engines 6, no. 4 (October 14, 2013): 1922–33.
doi:10.4271/2013-01-2593.
3. Myung, Cha-Lee, Juwon Kim, Wonwook Jang, Dongyoung Jin,
Simsoo Park, and Jeongmin Lee. “Nanoparticle Filtration Characteristics of Advanced Metal Foam Media for a Spark Ignition Direct Injection Engine in Steady Engine Operating Conditions and Vehicle Test Modes.” Energies 8, no. 3 (March 9, 2015): 1865–81. doi:10.3390/en8031865.
4. Rodriguez, J. Felipe, and Wai K. Cheng. “Cycle-by-Cycle
Analysis of Cold Crank-Start in a GDI Engine.” SAE International Journal of Engines 9, no. 2 (April 5, 2016). doi:10.4271/2016-01-0824.
5. Rodriguez, J. Felipe, and Wai K. Cheng. “Reduction of Cold-Start
Emissions through Valve Timing in a GDI Engine.” SAE International Journal of Engines 9, no. 2 (April 5, 2016). doi:10.4271/2016-01-0827.
6. Rodriguez, J. Felipe, and Wai K. Cheng. “Effect of Operation
Strategy on First Cycle CO, HC, and PM/PN Emissions in a GDI Engine.” SAE International Journal of Engines 8, no. 3 (April 14, 2015). doi:10.4271/2015-01-0887.
7. Rodriguez, J. Felipe, and Wai K. Cheng. “Fuel Carbon Pathway
in the First Cranking Cycle of a Gasoline Direct Injection Engine.” International Journal of Engine Research, October 5, 2015. doi:10.1177/1468087415609852.
8. Cedrone, Kevin, and Wai K. Cheng. “Using Valve Timing and
Exhaust Back Pressure to Improve Catalyst Warm-Up Time,” SAE Technical Paper 2013-01-2656, 2013. doi:10.4271/2013-01-2656.
9. Cedrone, Kevin, and Wai K. Cheng. “SI Engine Control in the
Cold-Fast-Idle Period for Low HC Emissions and Fast Catalyst Light Off.” SAE International Journal of Engines 7, no. 2 (April 1, 2014): 968–76. doi:10.4271/2014-01-1366. Simulation results IV delay / °CA 0 10 20 30 Effective compression ratio / -4 5 6 7 Maximum cylinder temperature / K 2075 2100 2125 2150
Page 10 of 10
10. Ketterer, Justin E., and Wai K. Cheng. “On the Nature of Particulate Emissions from DISI Engines at Cold-Fast-Idle.” SAE
International Journal of Engines 7, no. 2 (April 1, 2014): 986–
94. doi:10.4271/2014-01-1368.
11. Burke, David, David Foti, James Haller, and William J. Fedor. “Fuel Rail Pressure Rise during Cold Start of a Gasoline Direct Injection Engine,” SAE Technical Paper 2012-01-0393, 2012, doi:10.4271/2012-01-0393.
12. Tang, Huayin, Richard Burke, Sam Akehurst, Chris Brace, et al. “Behaviours of a GDI Gasoline Engine during Start,” SAE Technical Paper 2014-01-1374, 2014. doi:10.4271/2014-01-1374.
13. Heywood, John B. Internal Combustion Engine Fundamentals. New York: McGraw-Hill, 1988.
Contact Information
Wai Cheng, [email protected]
Acknowledgments
The authors would like to acknowledge the support for this research by Borg-Warner, Fiat Chrysler Automobiles, Ford Motor Company, and General Motors Company through a Consortium on Engine and Fuels Research.
Abbreviations
°CA Crank Angle degree
AFR Air Fuel Ratio
aTDC-c After Top Dead Center Compression aTDC-i After Top Dead Center Intake
BDC Bottom Dead Center
CA50 Point for 50% of heat release
CMD Count Median Diameter
CoV Coefficient of Variation
ECR Effective compression ratio
EVC Exhaust Valve Closing
EVO Exhaust Valve Opening
FFID Fast Flame Ionization Detector
FTP Federal Test Procedure
GDI Gasoline Direct Injection
GIMEP Gross Indicated Mean Effective Pressure
GPF Gasoline Particle Filter
IVC Intake Valve Closing
IVO Intake Valve Opening
MAP Manifold Absolute Pressure
MFB Mass Fraction Burned
NDIR Non-Dispersive Infrared sensor NEDC New European Driving Cycle NIMEP Net Indicated Mean Effective Pressure
NVO Negative Valve Overlap
SOI Start of Injection
VVT Variable Valve Timing
TWC Three Way Catalyst