aSenior author.
*Correspondence: Janne Cadamuro, Department of Laboratory Medicine, Paracelsus Medical University, Müllner Hauptstraße 48, 5020 Salzburg, Austria, Tel.: +0662/4482-57263,
Fax: +0662/4482-885, E-Mail: j.cadamuro@salk.at
Georg Martin Fiedler: Center of Laboratory Medicine, Inselspital, University Hospital Bern, Bern, Switzerland
Cornelia Mrazek, Thomas Klaus Felder, Hannes Oberkofler, Elisabeth Haschke-Becher and Helmut Wiedemann: Department of Laboratory Medicine, Paracelsus Medical University, Salzburg, Austria Ulrike Kipman: UT SPSS Statistics, Hallein, Austria
Janne Cadamuro*, Georg Martin Fiedler, Cornelia Mrazek, Thomas Klaus Felder,
Hannes Oberkofler, Ulrike Kipman, Elisabeth Haschke-Becher and Helmut Wiedemann
aIn-vitro hemolysis and its financial impact using
different blood collection systems
In-vitro Hämolyse verschiedener Blutabnahmesysteme sowie deren finanzielle Auswirkung
DOI 10.1515/labmed-2015-0078Received August 20, 2015; accepted September 29, 2015; previously published online November 6, 2015
Abstract
Background: Hemolytic specimens are among the most challenging preanalytical issues in laboratory diagnos-tics. The type of blood collection tube in use is claimed to influence in vitro hemolysis. We aimed to examine this hypothesis and estimate the respective financial impact, evaluating routine blood samples from the past 4 years. Methods: A total of 47,820 hemolysis index (HI) values from five different time intervals (IV1–IV5) were compared against each other, representing the following tubes: IV1-Sarstedt Monovette; IV2-8 mL/16 × 100 mm Greiner BioOne (GBO) Vacuette; IV3/IV4-5 mL/16 × 100 mm GBO Vacuette; IV5-4.5 mL/13 × 75 mm GBO Vacuette. For estimation of the economic impact, material, personnel and analytical costs were calculated.
Results: HI mean values in time interval IV2 were sig-nificantly higher than in all other intervals, while mean values amongst all other intervals were comparable. The number of moderately and severely hemolyzed samples increased with incrementing vacuum. Overall comparable costs between intervals IV1 and IV5 were €11,370, €14,045, €12,710, €11,213 and €8138 per 10,000 samples, respectively. Conclusions: Aspiration tubes and low vacuum tubes show comparable hemolysis rates. Increasing vacuum
levels are associated with higher hemolysis rates. By decreasing in vitro hemolysis, financial savings up to €5907 per 10,000 samples could be gained.
Keywords: blood collection; hemolysis; preanalytic. Zusammenfassung
Einleitung: Hämolytische Proben stellen eine der größten präanalytischen Herausforderungen eines jeden medizi-nischen Labors dar. Als einer der möglichen ursächlichen Faktoren wird das in Verwendung befindliche Blutabnah-mesystem angesehen. Unser Ziel war es, diese Hypothese sowie die entsprechenden Folgekosten anhand von Routi-neproben der letzten 4 Jahre zu überprüfen.
Methoden: 47,820 Hämolyseindices (HI) aus fünf Zeitin-tervallen (IV1–IV5), in welchen die folgenden Lithium-Heparin Blutabnahmeröhrchen in Verwendung waren, wurden miteinander verglichen: IV1-Sarstedt Monovette; IV2-8 mL/16 × 100 mm Greiner BioOne (GBO) Vacuette; IV3/ IV4-5 mL/16 × 100 mm GBO Vacuette; IV5-4,5 mL/13 × 75 mm GBO Vacuette. Zur Abschätzung der Folgekosten wurden Material-, Personal- und Analysekosten berechnet.
Ergebnisse: Die HI Mittelwerte aus Intervall IV2 waren signifikant höher als jene aller anderen Zeit-intervalle. Die Mittelwerte aus den Intervallen IV1, IV3, IV4 und IV5 unterschieden sich nicht statis-tisch voneinander. Die Anzahl mittelgradig und stark hämolysierter Proben stieg mit zunehmendem Vakuum. Die Folgekosten hämolysierter Proben in den Intervallen IV1–IV5 betrugen €11,370, €14,045, €12,710, €11,213 und €8138, jeweils auf 10,000 Proben berechnet. Schlussfolgerungen: Während Aspirations- und Niedrig-Vakuum-Röhrchen vergleichbare Hämolyseraten zeigen, steigen diese mit zunehmendem Vakuum an. Durch eine Senkung der Hämolyseraten konnte eine Ersparnis von bis zu €5907 pro 10,000 Proben erzielt werden.
Introduction
Laboratory analyses of the highest quality are crucial for accurate diagnosis and treatment as well as for prognostic evaluation of patients. It was estimated that 70%–80% of all healthcare decisions, that influence clinical decision making, involve one or more laboratory investigations [1]. Hence, errors within the total laboratory process may lead to harmful consequences for the patient due to inap-propriate further investigations and treatment as well as financial consequences due to recollection of speci-men and re-analyses. When reviewing the types and fre-quencies of laboratory errors, the vast majority (61.9%) is found to occur in the preanalytical phase [2]. Within these types of errors hemolytic blood specimen are the foremost cause of sample rejection, which, according to a survey of 453 laboratories, occurs five times more fre-quently than the second most cited reason, insufficient specimen quantity to perform the test [3]. Circumstances leading to in-vitro hemolysis are various and can be found in different process steps of specimen handling, includ-ing phlebotomy, transport, intra-laboratory processinclud-ing or storage [4]. One of these variables is the type of blood col-lection system in use [5–8]. Vacuum systems are known to increase the rate of hemolytic specimen compared to aspi-ration systems due to higher shear stress, subsequently leading to damage of red blood cells [7, 9]. This might be avoided by the use of low vacuum tubes, although the lit-erature to this topic is conflicting [10–12].
In our hospital compound setting, consisting of three different sites, blood collection systems in use varied between vacuum and aspiration systems and were there-fore standardized in 2011. In the following years different sizes and volumes of vacuum-based lithium-heparin (LH) tubes were introduced with the exception of the pediatric department, which continued to use an aspiration system. Based on this setting, we aimed to compare hemolysis rates in aspiration vs. vacuum blood collection systems as well as in low vs. high vacuum tubes, retrospectively. Additionally, we estimated the financial impact of hemo-lytic blood specimen in this real life clinical setting as
follow-up to our previous hypothetical study on the costs of hemolysis [13].
Materials and methods
The Landeskrankenhaus (LKH) Salzburg as part of the university hospital of Salzburg, in which our study was performed, holds 1143 beds with approximately 77,000 inpatient visits and 561,000 outpatient visits per year. Except for the neurology, neurosurgery, psychiatry and geriatrics departments, which are located in a second site [Christian Doppler Klinik (CDK) Salzburg], all common medical specialties of a hospital center are provided. These two clinics, LKH and CDK, together with a third site, an outpost about 70 km away from the central sites, form the Salzburger Landeskliniken (SALK). Since the blood collection systems in use differed between these clin-ics, a harmonization process was started in 2010. After a public ten-dering procedure, the Vacuette™ system from Greiner BioOne (GBO, Kremsmünster, Austria) was established in all of the SALK sites. The LKH was using the Monovette™ system from Sarstedt (Nümbre-cht, Germany) which was switched on the 17th of March 2011 in all the departments with the exception of the departments of pediat-rics, pediatric surgery and neonatology, which continued using the Sarstedt aspiration system. In preparation for these changes all phy-sicians and nurses were trained in blood collection using the new system, as well as in preanalytics.
Immediately after the system switch we observed a signifi-cant rise of hemolysis rates in the 8 mL lithium-heparin (LH) gel blood collection tubes (16 × 100 mm, 8 mL, mm REF: 455083, GBO, Kremsmünster, Austria) and therefore decided to switch to a 5 mL low vacuum tube (16 × 100 mm, 5 mL, REF: 455012, GBO). The replace-ment of tubes was performed on the 12th of April 2011. In November 2013 we switched to a 4.5 mL LH tube without gel due to technical issues. During this time, however, the tubes outer dimensions also changed (13 × 75 mm, 4.5 mL, REF: 454049, GBO).
After approval by the Institutional Ethics Committee, we ana-lyzed hemolysis index (HI) values at different time intervals (IV) and compared them accordingly. An overview of the time intervals and the respective system in use is shown in Table 1. During interval one (IV1) the Sarstedt system was in use, whereas in interval two (IV2) high vacuum/high volume (8 mL) LH-tubes with a 16 × 100 mm outer dimension were introduced. In interval three (IV3) and four (IV4) blood collection was performed using the 5 mL/16 × 100 mm low vacuum tubes. Data from IV4 were collected to test for changes in hemolysis rates due to declining awareness of the preanalytics train-ing which was performed in sprtrain-ing 2011. Hemolysis data from the fifth interval (IV5) represent the usage of high vacuum/low volume Table 1: Description of the different blood collection systems in use over the five time intervals (IV1–IV5).
Time period Vendor Outer dimensions, mm Vacuum Volume, mL n
IV1 01.01.2011–01.03.2011 Sarstedt 15 × 75 None 4.7 9836
IV2 18.03.2011–12.04.2011 GBO 16 × 100 High High (8) 4418
IV3 13.04.2011–13.06.2011 GBO 16 × 100 Low Low (5) 10,793
IV4 01.01.2012–01.03.2012 GBO 16 × 100 Low Low (5) 11,508
tubes (4.5 mL/13 × 75 mm) without gel. According to Boyle’s law, the calculated vacuum within the tubes used in IV2, IV3/4 and IV5 was 11.5 psi, 7.2 psi and 11.0 psi, respectively [14]. To see if there were ini-tial difficulties in using the new collection system, we additionally evaluated mean day to day HI values and the number of hemolyzed specimens within IV2.
As already mentioned the departments treating pediatric patients continued using the Sarstedt system and were therefore excluded from the calculations. We also excluded our emergency department due to the fact that on this ward blood usually is drawn through IV catheters, which may result in severely higher hemolysis rates [15].
Hemolysis index (HI) was measured using the COBAS analyzers (Roche, Basel, Switzerland), with a HI of one being equal to a concen-tration of 1 mg/dL of free hemoglobin [16, 17]. To define hemolysis we referred to the official documents and packaging inserts of the manu-facturer, which state, that the first laboratory parameter affected by hemolysis is altered at an HI level of ≥ 10. Two additional cutoffs were set at 50 and 100, to define moderately and severely hemolyzed samples, respectively.
Calculation of costs
The economic impact of hemolysis during the different intervals was calculated based upon our previous work, grading hemolysis into 16 HI groups [13]. We evaluated the percentage of samples in the dif-ferent intervals with HI values within the range of the respective HI group. In these samples, we analyzed the number of ordered param-eters which are affected by the respective grade of hemolysis, accord-ing to official documents and packagaccord-ing inserts of the manufacturer. Subsequently, we multiplied personnel, material and laboratory costs with the actual number of hemolyzed samples and affected parameters. Analytical costs were calculated using a common scale of charges for medical laboratory analyses in Germany, which, amongst other available scales, most closely reflects the analytical costs [18]. For better comparison between the groups we factorized overall costs on 10,000 samples in each interval.
Statistical analysis
To estimate the sample sizes for each group, a power analysis was performed, based on an effect size of 0.1, an alpha error of 0.05 and a power of 0.95 using G-Power v3.1 [19]. This analysis yielded 2600 samples for each group. However, since data for the different periods were easily obtainable we set this value as the minimum sample size. One-way-ANOVAs were performed for comparison of mean val-ues and the amount of hemolyzed samples between all time inter-vals. Differences were considered significant at p-values < 0.05.
Results
We collected 47,820 HI values within five different time periods (Table 1). When comparing HI mean values in the respective intervals against each other, values in IV2 were
25 20 A B 20 30 40 15 10 10 5 0 0 HI (Mean; 95% Cl) IV1 IV1 IV2 IV2 IV3 IV3 IV4 IV4 IV5
IV5 IV1 IV2 IV3 IV4 IV5 IV1 IV2 IV3 IV4 IV5
Amount of samples , % **** **** **** **** **** **** **** **** **** **** **** **** **** **** **** **** **** **** **** **** **** **** * ** **** *** *** HI ≥10 HI ≥50 HI ≥100
Figure 1: Differences between mean hemolysis index (HI) values (A) and amount of hemolyzed samples (B) between time intervals IV1–IV5.
*p ≤ 0.05; **p ≤ 0.01; ***p ≤ 0.001; ****p ≤ 0.0001.
significantly higher than in all other intervals (p < 0.0001 for all). Amongst groups IV1, IV3, IV4 and IV5, no signifi-cant differences were found (p > 0.05). The percentage of samples with HI values greater than 10, 50 or 100 differed substantially between most of the time intervals (Figure 1). As expected, hemolysis rates within the pediatric depart-ment remained unchanged (data not shown).
Mean day to day HI values as well as the amount of hemolyzed samples showed a slight downward trend within IV2. On the last day before the system switch the mean HI value was 12.2 and the percentage of samples with an HI value ≥ 10, ≥ 50 and ≥ 100 was 36.8%, 4.0% and 1.5%, respectively (Figure 2).
We calculated €0.145 material costs for two tubes, a tube holder and a 21G needle. Blood collection by the nursing staff takes 371 s on average, including 55 s for preparation and 316 s for collection and post-processing (evaluation from an internal project – data not shown). Based on the respective wages, personnel costs for one blood collection were €2.93 [20]. Analytical costs for the
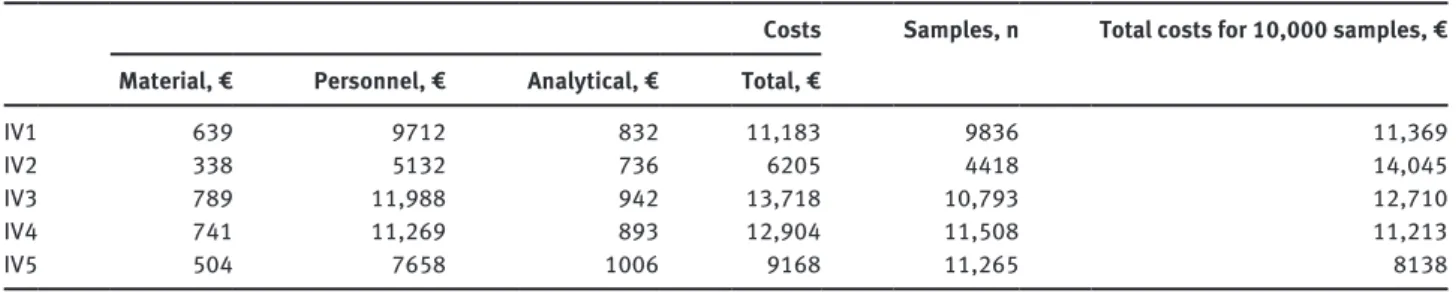
time periods IV1, IV2, IV3, IV4 and IV5 were €832.35, €736.10, €941.50, €892.90 and €1006.10, respectively. Summing up material, personnel and analytical costs for each interval, the economic impact was €11,183 (samples n = 9836), €6205 (samples n = 4418), €13,718 (samples n = 10,793), €12,904 (samples n = 11,508) and €9168 (samples n = 11,265), respectively. When factorizing each interval up to 10,000 samples, overall comparable costs
between these intervals were €11,370, €14,045, €12,710, €11,213 and €8138, respectively (Table 2).
Discussion
Hemolytic blood specimens are one of the most challeng-ing preanalytic issues in laboratory medicine. Not only because it is the most frequent preanalytical error, but also because it is difficult to directly influence hemoly-sis levels by the laboratory staff [3]. To reduce hemolyhemoly-sis rates, the laboratory has to train phlebotomists in pre-analytics and blood collection and motivate them to keep hemolysis levels low. Such motivators can be profession-alism, i.e. trying to provide the best service possible to the patient, economic behavior, i.e. trying to reduce costs due to repeated blood collection/analyses or personal inter-est, i.e. by trying to become an “Hemolysis Champion”, as McGarth et al. describe it [21]. Additionally, there is one possibility for the laboratory to directly influence hemoly-sis by controlling the blood collection system in use. In theory, higher shear stress in vacuum systems leads to more damaged red blood cells compared to gradually drawing the plunger of an aspiration system. However, studies comparing vacuum collection systems against aspiration systems on larger scales are rare and conflict-ing. Lippi et al. compared the Becton Dickinson (BD) Vacutainer™ system against the Sarstedt system, in both vacuum and aspiration mode, in 20 healthy volunteers and showed that blood collection by vacuum, regardless of the vendor, increases hemolysis rates [9]. In two subse-quent retrospective studies, Lippi et al. as well as Goege-buer et al. confirmed a reduction in hemolysis rates by the use of an aspiration system compared to a vacuum system [6–8]. Other investigators, focusing on blood collection through an IV-catheter, reported similar results [11, 22, 23]. However, a study by Seguin et al., prospectively analyzing samples from 1206 patients presenting at the emergency 100 50 60 B A 40 20 0 0 HI (Mean; 95% Cl) FriSat SunMonTue
WedThuFriSatSunMon TueWedThuFriSatSunMonTueWedThu FriSat SunMonTue
FriSat SunMonTue
WedThuFriSatSunMon TueWedThuFriSatSunMonTueWedThu FriSat SunMonTue
Amount of samples
, %
HI ≥10 HI ≥50 HI ≥100
Figure 2: Day-to-day mean values (A) and number of samples (%) with hemolysis index (HI) levels ≥ 10, ≥ 50 and ≥ 100, respectively (B) within time interval 2.
Table 2: The financial impact of hemolysis in the five time periods.
Costs
Samples, n Total costs for 10,000 samples, €
Material, € Personnel, € Analytical, € Total, €
IV1 639 9712 832 11,183 9836 11,369
IV2 338 5132 736 6205 4418 14,045
IV3 789 11,988 942 13,718 10,793 12,710
IV4 741 11,269 893 12,904 11,508 11,213
IV5 504 7658 1006 9168 11,265 8138
department, did not find significant differences in hemol-ysis rates comparing the BD Vacutainer system against syringe blood collection [24]. Also Dugan et al., survey-ing factors affectsurvey-ing hemolysis in 100 randomly chosen patients, reported no difference in blood collection per-formed by syringe compared to vacuum [25].
When comparing different vacuum systems, the vendor as well as the tube volume in combination with the outer dimensions of the tube influenced hemolysis levels. Almagor et al. reported lower hemolysis levels when using BD vacuum tubes compared to those from GBO, a finding later confirmed by Goegebuer et al. [5, 6]. However, these results could be biased, since Goegebuer et al. compared GBO 8 mL Vacuette tubes against BD 4 mL and 6 mL Vacu-tainer tubes. In the study of Almagor et al. the tube holder differed between the two groups. In the Vacuette group the GBO Holdex with an eccentric luer was used, which might additionally influence hemolysis rates [26].
A lower volume in blood collection tubes is accom-panied by lower vacuum levels and subsequently lower shear stress with less erythrocyte damage. However, this only applies to tubes with comparable outer dimensions. Giavarina et al., Heiligers-Duckers et al., Heyer et al. and Cox et al. demonstrated the relationship between vacuum level and hemolysis rate in clinical practice [10, 11, 22, 27]. Contradictory to these studies, Lippi et al. found a signifi-cant elevated hemolysis rates in lower volume tubes [12]. However, this study compared two types of vacuum tubes with different outer dimensions.
In our hospital, the aspiration blood collection system from Sarstedt was replaced by the Vacuette™ system from GBO in 2011. After switching from the Sarstedt system (IV1) to the high vacuum/high volume tubes (8 mL/16 × 100 mm) from GBO (IV2) mean HI values as well as the number of hemolyzed samples increased (Figure 1). This effect was most probably caused by higher shear stress due to the vacuum. However, initial difficulties in using the new system must be taken into account. Therefore, we evalu-ated the mean day-to-day HI values and the number of hemolyzed specimens within the first time period after the system switch and found a slight decline in hemoly-sis rates over the 26 days in which these high vacuum/ high volume tubes were in use (Figure 2). Hemolysis levels and the number of moderate to severely hemolyzed samples using the low vacuum tubes (IV3) dropped to values similar to those from the Sarstedt system (IV1). We also evaluated if the effect of the training in preanalytics and handling of the new system, which was performed prior to the first system switch, decreased over time. This would result in increasing hemolysis rates. After about 1 year in which the new tubes were in use (IV4), we could
observe a slight non-significant decline in hemolysis mean values and an increase in the amount of moderately hemolyzed samples compared to IV3 while the amount of slightly hemolyzed samples declined and those severely hemolyzed stayed almost the same (Figure 1). In conclu-sion, a decreasing awareness of preanalytical issues might influence hemolysis.
After switching from the low vacuum tubes to high vacuum/low volume (4.5 mL/13 × 75 mm) tubes (IV5), hemolysis mean values increased only slightly and non-significantly, however, the amount of moderately and severely hemolyzed samples increased significantly. Since the volume in these tubes (4.5 mL) stayed nearly the same compared to the previously used tube (5 mL) while the tube itself was downsized from 16 × 100 mm to 13 × 75 mm, the vacuum subsequently increases. This fact in combina-tion with the observacombina-tions of hemolysis during our previ-ous system switches fits perfectly into the theory that the amount of vacuum is a major factor in producing hemoly-sis as already hypotized by others [6–9, 11, 22, 23].
Therefore, changing the blood collection system from aspiration to vacuum does not increase hemolysis rates if phlebotomists, nurses or physicians are trained accordingly and if low vacuum tubes are used. However, if switching to a standard 13 × 75 mm tube (high vacuum/low volume) a significant increase in moderately and severely hemolyzed samples must be taken into account.
For calculations of the financial impact of hemolysis the number of hemolyzed samples is far more important than the HI mean value, since personnel costs are respon-sible for the majority of costs (86%) followed by analytical (8.3%) and material costs (5.7%). Overall costs in the time periods IV1–IV5, adjusted to 10,000 samples were €11,370, €14,045, €12,710, €11,212 and €8138, respectively (Table 2). Since hemolytic samples are less frequent but more severely hemolyzed in IV5, the costs caused by hemolytic samples are the lowest in this interval. Subsequently the potential savings would be €5907 per 10,000 samples at most (IV2 vs. IV5), depending on the collection system in use. These real life numbers differ, compared to those in our previous hypothetical work [13]. As we already stated in this previous work, this is due to the fact that not every laboratory parameter, which is influenced by hemolysis is measured in every single sample the lab receives.
To define hemolysis we referred to the official docu-ments and packaging inserts of the manufacturer, which state, that lactate dehydrogenase measurement is affected by hemolysis already at HI values ≥ 10. The HI cut-off of 10 fits nicely to that proposed by Lippi et al., who calculated a reference range for HI in 135 unselected outpatients according to CLSI document 28-A3 with an upper limit for
LH plasma of 0.13 g/L measured on the Cobas c50 [28]. These levels however are quite low and would cause a hemolysis frequency of about 30% (Figure 1). When defin-ing a hemolysis cut-off at an HI value of 50, as proposed by many authors [6, 10, 26, 29], our findings would look somewhat different. The high vacuum/high volume tubes (IV2) would still be causing most hemolytic samples, however, there would be significantly more hemolyzed samples when using the high vacuum/low volume tubes (IV5) compared to the Sarstedt system (IV1) or the low vacuum tubes (IV3, IV4) (Figure 1). Also the subsequent costs would change, being €1027, €3505, €825, €1026, and €2003 per 10,000 samples in IV1, IV2, IV3, IV4 and IV5, respectively. These findings show that a harmonization of hemolysis measurements and HI cut-offs is urgently needed [16].
A potential limitation of our study is represented by the fact that IV2 only covers 26 days, since we changed the collection tube from 8 mL to 5 mL quickly, whereas the other time periods spread over 2 months each. Addi-tionally, it should be mentioned, that we focused on frequently ordered analytes in clinical chemistry when calculating subsequent costs. Analytes from other labo-ratory specialties, which are also influenced by hemoly-sis, such as coagulation parameters, were not taken into account, since we had no HI cut-off levels for these parameters [30]. Also, as described in our previous work, the analytic costs used in our setting reflect the charge-able prize, rather than the laboratory costs [31]. Finally, we only calculated primary costs of hemolysis. Secondary costs have to be considered, but are very hard to put in numbers. Such costs could be caused by prolonged time to diagnosis and subsequent delay of treatment onset with a respectively extended hospital stay or by further inappropriate investigations.
In conclusion, vacuum blood collection tubes were not associated with higher hemolysis rates compared to the aspiration system when tubes with low vacuum levels were used. The hemolysis rate was positively associated with the vacuum levels of the tubes, hence, the most severe hemolysis levels were observed using the high vacuum/high volume tube (8 mL/16 × 100 mm). However, we could not define to which extent these results were influenced by initial difficulties in handling the new col-lection system. Reducing the hemolysis rate by using adequate collection systems could contribute to financial savings up to €5907 per 10,000 samples.
We urge each laboratory to use preanalytic quality indi-cators to keep track of this essential concern and to compare its hemolysis levels with those from other laboratories since
“You can’t improve what you don’t measure” [32].
Author contributions: All the authors have accepted responsibility for the entire content of this submitted manuscript and approved submission.
Research funding: None declared.
Employment or leadership: None declared. Honorarium: None declared.
Competing interests: The funding organization(s) played no role in the study design; in the collection, analysis, and interpretation of data; in the writing of the report; or in the decision to submit the report for publication.
References
1. Plebani M, Lippi G. Is laboratory medicine a dying profession? Blessed are those who have not seen and yet have believed. Clin Biochem 2010;43:939–41.
2. Carraro P, Plebani M. Errors in a stat laboratory: types and frequencies 10 years later. Clin Chem 2007;53:1338–42. 3. Jones BA, Calam RR, Howanitz PJ. Chemistry specimen
accept-ability: a college of American pathologists q-probes study of 453 laboratories. Arch Pathol Lab Med 1997;121:19–26. 4. Lippi G, Blanckaert N, Bonini P, Green S, Kitchen S, Palicka V,
et al. Haemolysis: an overview of the leading cause of unsuit-able specimens in clinical laboratories. Clin Chem Lab Med 2008;46:764–72.
5. Almagor M, Lavid-Levy O. Effects of blood-collection systems and tubes on hematologic, chemical, and coagulation tests and on plasma hemoglobin. Clin Chem 2001;47:794–5.
6. Goegebuer T, Debrabandere J. Influence of the serum collection system on hemolysis. Focus Diagnostica 2008;16:22–5. 7. Lippi G, Bonelli P, Bonfanti L, Cervellin G. The use of s- monovette
is effective to reduce the burden of hemolysis in a large urban emergency department. Biochem Med (Zagreb) 2015;25:69–72. 8. Lippi G, Avanzini P, Cervellin G. Prevention of hemolysis in blood
samples collected from intravenous catheters. Clin Biochem 2013;46:561–4.
9. Lippi G, Avanzini P, Musa R, Sandei F, Aloe R, Cervellin G. Evaluation of sample hemolysis in blood collected by s- monovette using vacuum or aspiration mode. Biochem Med (Zagreb) 2013;23:64–9.
10. Giavarina D. Low volume tubes can be effective to reduce the rate of hemolyzed specimens from the emergency department. Clin Biochem 2014;47:688–9.
11. Heiligers-Duckers C, Peters NA, van Dijck JJ, Hoeijmakers JM, Janssen MJ. Low vacuum and discard tubes reduce hemolysis in samples drawn from intravenous catheters. Clin Biochem 2013;46:1142–4.
12. Lippi G, Bonelli P, Graiani V, Caleffi C, Cervellin G. Low volume tubes are not effective to reduce the rate of hemolyzed specimens from the emergency department. Clin Biochem 2014;47:227–9. 13. Cadamuro J, Wiedemann H, Mrazek C, Felder TK, Oberkofler H,
Fiedler GM, et al. The economic burden of hemolysis. Clin Chem Lab Med 2015.
14. Bolyle R. A defence of the doctrine touching the spring and weight of the air, propos’d by Mr. R. Boyle in his new physico-mechanical experiment. London: Thomas Robinson, 1662.
15. Lippi G, Cervellin G, Mattiuzzi C. Critical review and meta-analysis of spurious hemolysis in blood samples collected from intrave-nous catheters. Biochem Med (Zagreb) 2013;23:193–200. 16. Dolci A, Panteghini M. Harmonization of automated hemolysis
index assessment and use: is it possible? Clin Chim Acta 2014;432:38–43.
17. Unger J, Filippi G, Patsch W. Measurements of free hemoglobin and hemolysis index: edta- or lithium-heparinate plasma? Clin Chem 2007;53:1717–8.
18. Kassenärztliche Bundesvereinigung. Einheitlicher Bewertungs-maßstab (EBM). http://www.kbv.de/html/online-ebm.php (Accessed 08.04. 2015).
19. Faul F, Erdfelder E, Lang A-G, Buchner A. A flexible statistical power analysis program for the social, behavioral, and biomedi-cal sciences. Behav Res Methods 2007;39:175–91.
20. Direkte und indirekte arbeitskosten sowie leistungslohn und lohnnebenkosten (ohne lehrlinge und sonstige auszubildende) 2012 nach önace 2008. Vol. 1. Vienna: Statistik Austria, 2012. 21. McGrath JK, Rankin P, Schendel M. Let the data speak:
decreasing hemolysis rates through education, practice, and disclosure. J Emerg Nurs 2012;38:239–44.
22. Heyer NJ, Derzon JH, Winges L, Shaw C, Mass D, Snyder SR, et al. Effectiveness of practices to reduce blood sample hemolysis in eds: a laboratory medicine best practices systematic review and meta-analysis. Clin Biochem 2012;45:1012–32.
23. Grant MS. The effect of blood drawing techniques and equipment on the hemolysis of ed laboratory blood samples. J Emerg Nurs 2003;29:116–21.
24. Seguin D, McEachrin C, Murphy T. Venipuncture equipment, technique and hemolysis of laboratory blood samples obtained in the emergency department. J Emerg Nurs 2014;30:418. 25. Dugan L, Leech L, Speroni KG, Corriher J. Factors affecting
hemolysis rates in blood samples drawn from newly placed iv sites in the emergency department. J Emerg Nurs 2005;31:338–45.
26. Lippi G, Avanzini P, Aloe R, Cervellin G. Reduction of gross hemolysis in catheter-drawn blood using greiner holdex tube holder. Biochem Med (Zagreb) 2013;23:303–7.
27. Cox SR, Dages JH, Jarjoura D, Hazelett S. Blood samples drawn from iv catheters have less hemolysis when 5-ml (vs 10-ml) collection tubes are used. J Emerg Nurs 2004;30:529–33. 28. Lippi G, Giavarina D, Gelati M, Salvagno GL. Reference range of
hemolysis index in serum and lithium-heparin plasma measured with two analytical platforms in a population of unselected outpatients. Clin Chim Acta 2014;429:143–6.
29. Lippi G, Bonelli P, Cervellin G. Prevalence and cost of hemolyzed samples in a large urban emergency department. Int J Lab Hematol 2014;36:e24–6.
30. Lippi G, Montagnana M, Salvagno GL, Guidi GC. Interference of blood cell lysis on routine coagulation testing. Arch Pathol Lab Med 2006;130:181–4.
31. Jacobs P, Costello J, Beckles M. Cost of haemolysis. Ann Clin Biochem 2012;49:412.
32. Plebani M, Sciacovelli L, Aita A, Chiozza ML. Harmonization of pre-analytical quality indicators. Biochem Med (Zagreb) 2014;24:105–13.