EFFECT OF POPULATION DENSITY AND DOSE OF NITROGEN AND POTASSIUM FERTILIZERS ON PERFORMANCE OF GREEN BEAN (PHASEOLUS VULGARIS)
A. Hussein1,*, M. Benmoussa1, M. Abbad2
1
Department of Biotechnology, Faculty of Nature and life sciences, University of Blida-1, Algeria
2
Department of Horticulture, Faculty of Agriculture and Natural Resources, University of Kassala, Sudan
Received: 14 March 2017 / Accepted: 25 November 2017 / Published online: 01 January 2018
ABSTRACT
This experiment was executed in a split randomized complete block design with three replications. Two plant densities (D), (D1; D2) equal to one plant and twoplants per pot and
seven fertilizers doses (F), (N0 K0; N1 K0; N1 K1; N2 K0; N2 K2; N0 K1; N0 K2) were
investigated. N0, N1 and N2 equal to 0, 0.46, and 0.92 g urea while, K0, K1 and K2 equal to 0,
0.42 and 0.84 g potassium sulfate, respectively. The results showed that the treatments had no effect on the number of branches per plant and vice versa the interaction. Lower plant density (D1) and higher dose of both elements (N2 K2) significantly increased shoots dry weight,
number of pods and pod yield per plant while, in second season the higher value of those yield parameters was obtained at lower dose of nitrogen (N1 K0), the interaction of those
treatments increased significantly plant dry weight. The interaction between lower plant density (D1) and nitrogen irrespective of their quantity and potassium, (N1 K0; N1 K1; N2 K0
and N2 K2) increased the number of pods and pods yield per plant, while the greatest yield per
hectare was obtained at density planting (D2) receiving higher doses of both fertilizer and
lower dose of nitrogen (N2 K2: N1 K0) at the first and second season respectively.
Keywords: Cultivar Djadida; Nutrient Competition; Vegetative Productivity.
Author Correspondence, e-mail:abdallamohussein@gmail.com doi: http://dx.doi.org/10.4314/jfas.v10i1.4
ISSN 1112-9867
Available online at http://www.jfas.info
Journal of Fundamental and Applied Sciences is licensed under a Creative Commons Attribution-NonCommercial 4.0 International License. Libraries Resource Directory. We are listed under Research Associations category.
1. INTRODUCTION
Green beans are dicotyledonous plants forming part of the species (Phaseolus vulgaris L.). According to Monfreda et al., (2008) estimate for the year 2006, the world beans production was 1235 kg ha-1 while, that of Africa was 799 kg ha-1. These low yields are pronounced in grain legumes and are often associated with declining soil fertility due to biological and environmental factors (Mfilinge et al., 2014). Nitrogen is one of the most limiting nutrients to plant growth (Hirel et al., 2007). Potassium improved fruit quality (Beg and Sohrab, 2012) while, nitrogen consumption increased dry weight resulting in increased plant yield (Hatami et al., 2009). Vorob (2000) recorded positive effect of potassium application at all proportions on growth and yield of peas. Lower density had the heaviest shoot dry weights (Elhag and Hussein, 2014) and the highest number of pods per plant (Mtaita and Mutetwa, 2014). Low crop productivity and quality are a general phenomenon facing most producers. The objective of this study was to investigate the effect of plant density and dose of nitrogen and potassium on Green bean Cv. Djadida.
2. MATERIALS AND METHODS 2. 1. Site of Experiment
This study was carried out during winter seasons of the years 2015 and 2016 in glasshouse of laboratory of vegetables production, faculty of Nature and Life Sciences, University of Blida-1, Algeria. The geographical coordinates are 36º 28 ̛ 7 ̛ ̛ North, 2º 49̛ 44̛ ̛ East, 260 m above sea level.
2.2. Experimental Design
The experiment was executed in split trial in randomized complete block design with three replications. Four plastic pots 33 × 30 cm in dimensions contain 8.5 Kg soil were used as an experimental units.
2. 3. Treatments
The treatment consisted of two plant densities (D), (D1) one plant per pot (107145 plants per
hectare) and twoplants per pot D2 (214290 plants per hectare) used as main plot, and seven
fertilizers doses (F), (N0 K0; N1 K0; N1 K1; N2 K0; N2 K2; N0 K1; and N0 K2) used as sub plot.
N0, N1 and N2 equal to 0, 0.46, and 0.92 g urea (46% nitrogen) per pot respectively, while K0,
K1 and K2 equal to 0, 0.42 and 0.84 g potassium sulfate (50% potassium) per pot respectively.
2. 4. Soil characteristics
Meg g-1 potassium sulfate, 0.8 g Kg-1 azotes and 1.80% organic matter. 2.5. Sowing
The seeds were soaked in water for one day and pre-sown in a moist piece for four days, and then transplanted. The fertilizers treatment applied as one dose, four weeks from sowing. 2.6. Data Collection
The data of both seasons was recorded (40 days from sowing) to evaluate the effect of treatments on the number of branches per plant, shoot dry weight, number of pods per plant, pod fresh weight, pod yield per plant and pod yield per hectare.
2.7. Statistical Analyses
The data was statistically analyzed using computer software programme (MSTAT-C). Randomized Complete Block Design (R. C. B. D) was applied for data analysis and Duncan multiple range test D. M. R. T, was used for mean separation.
3. RESULTS
3.1. Number of branches per plant
No significant effect was noticed in both seasons on the number of branches per plant due to the plant density or due to nitrogen and potassium fertilizer (Table 1). Number of branches per plant was significantly affected by plant density and nitrogen and potassium interaction. A single plant per pot (D1) treated withlower dosesof nitrogen without potassium (N1 K0) in the
first season screened a superior number of branches per plant which was positively different from all other treatments and significantly for higher plant density (D2) receiving a high dose
of potassium without nitrogen (N0 K2) contrary, this treatment decreased the number of
branches per plant in the second season. Single plant per pot (D1) receiving nitrogen at higher
dose (N2 K0) and two plants per pot (D2) received no fertilizer or receiving potassium at
higher dose (N0 K0; N0 K2) was statistically similar and had the highest number of branches
Table 1. Effect of plant density and dose of nitrogen and potassium on number of branches per plant
Differences between means as indicated by the same letters for the different treatments are not statistically significant at probability≤0.05.
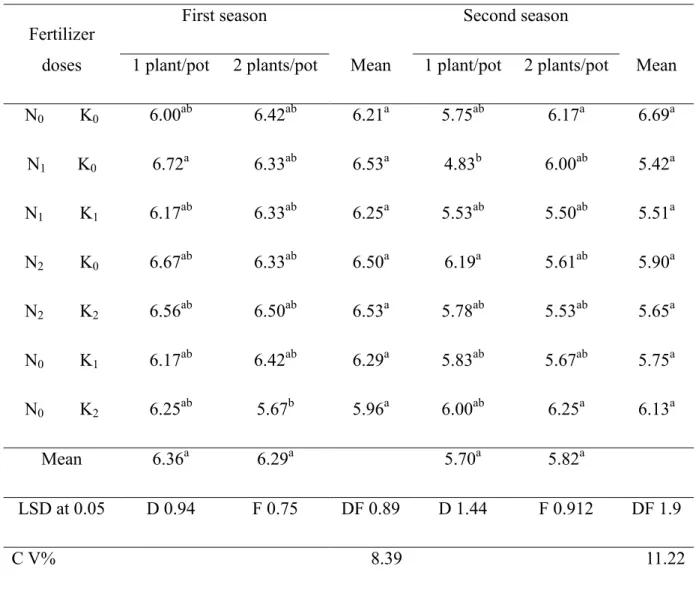
3.2. Shoot dry weight (g)
As in Table 2 Plant density, fertilizer doses and their interaction had a significant effect on plant dry weight. Increasing plant density up to two plants per pot (D2) decreased significantly
plant dry weight, compared with lower plant density (D1). The higher dose of nitrogen and
potassium (N2 K2) in both seasons and lower dose of nitrogen without potassium in the
second season (N1 K0) gave the greatest dry weights of the plant. Lower and higher dose of
potassium without nitrogen (N0 K1 and N0 K2) and plant receiving no fertilizer (N0 K0)
decreased plant dry weight. In both seasons, lower plant density (D1) treated with higher
doses of nitrogen and potassium (N2 K2) and lower dose of nitrogen (N1 K0) were
significantly higher in dry weight. Higher plant density (D2) receiving potassium without
Fertilizer doses First season Mean Second season Mean 1 plant/pot 2 plants/pot 1 plant/pot 2 plants/pot
N0 K0 N1 K0 N1 K1 N2 K0 N2 K2 N0 K1 N0 K2 6.00ab 6.72a 6.17ab 6.67ab 6.56ab 6.17ab 6.25ab 6.42ab 6.33ab 6.33ab 6.33ab 6.50ab 6.42ab 5.67b 6.21a 6.53a 6.25a 6.50a 6.53a 6.29a 5.96a 5.75ab 4.83b 5.53ab 6.19a 5.78ab 5.83ab 6.00ab 6.17a 6.00ab 5.50ab 5.61ab 5.53ab 5.67ab 6.25a 6.69a 5.42a 5.51a 5.90a 5.65a 5.75a 6.13a Mean 6.36a 6.29a 5.70a 5.82a LSD at 0.05 D 0.94 F 0.75 DF 0.89 D 1.44 F 0.912 DF 1.9 C V% 8.39 11.22
nitrogen of higher or lower dose (N0 K1; N0 K2) was mild in weight.
Table 2. Effect of plant density and dose of nitrogen and potassium on shoot dry weight (g)
Differences between means as indicated by the same letters for the different treatments are not statistically significant at probability≤0.05.
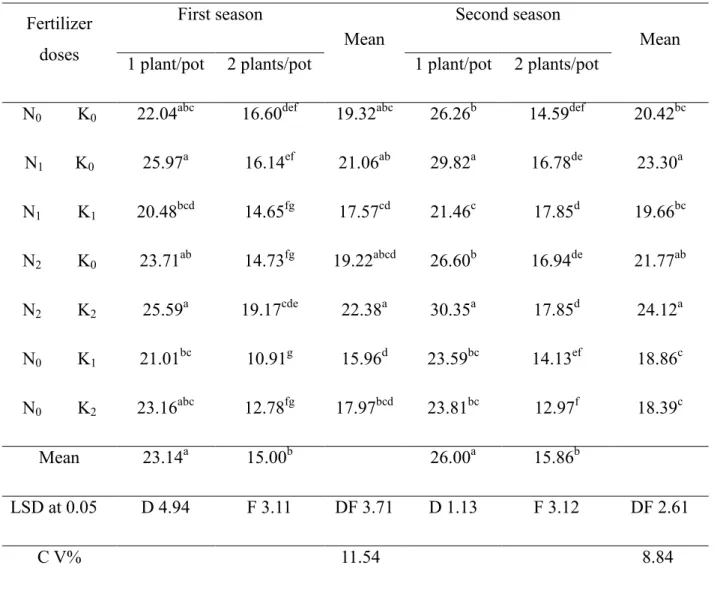
3.3. Number of pods per plant
There were significant differences on number of pods per plant due to plant density, fertilizer and their interaction (Table 3). Lower plant density (D1) gave the maximum number of pods
per plant compared with the higher plant density (D2). During the first season, the greatest
number of pods per plant was obtained by plant treated with the highest dose of both elements (N2 K2) while, the lower dose of nitrogen with potassium or without potassium (N1 K1; N1 K0)
gave the highest number of pods per plant in the second season, the pair doses were statistically similar. A similar results in both seasons were presented when lower plant density (D1) treated with high doses of fertilizer (N2 K2) in the first season and (N1 K1; N1 K0) in the
Fertilizer doses First season Mean Second season Mean 1 plant/pot 2 plants/pot 1 plant/pot 2 plants/pot
N0 K0 22.04abc 16.60def 19.32abc 26.26b 14.59def 20.42bc
N1 K0 25.97a 16.14ef 21.06ab 29.82a 16.78de 23.30a N1 K1 20.48bcd 14.65fg 17.57cd 21.46c 17.85d 19.66bc N2 K0 23.71ab 14.73fg 19.22abcd 26.60b 16.94de 21.77ab N2 K2 25.59a 19.17cde 22.38a 30.35a 17.85d 24.12a N0 K1 21.01bc 10.91g 15.96d 23.59bc 14.13ef 18.86c N0 K2 23.16abc 12.78fg 17.97bcd 23.81bc 12.97f 18.39c Mean 23.14a 15.00b 26.00a 15.86b LSD at 0.05 D 4.94 F 3.11 DF 3.71 D 1.13 F 3.12 DF 2.61 C V% 11.54 8.84
second season. Less number of pods per plant was a base phenomenon of higher plant density (D2) overall fertilizer treatments compared with lower plant density (D1) which received the
same dose of fertilizer or other dose.
Table 3. Effect of plant density and dose nitrogen and potassium on number of pods per plant
Differences between means as indicated by the same letters for the different treatments are not statistically significant at probability≤0.05.
3.4. Pod fresh weight (g)
Table 4 shows that pod fresh weight was not affected by different plant density nor with different doses of nitrogen and potassium fertilizers. The interaction between plant density and fertilizer doses varied significantly with a variation of plant density and fertilizer doses in the first season. In the first season, the individual plant per pot (D1) with application of high
rate of potassium without nitrogen (N0 K2) was superior to the other plants in term of pod
Fertilizer doses First season Mean Second season Mean 1 plant/pot 2 plants/pot 1 plant/pot 2 plants/pot
N0 K0 31.84b 21.92cd 26.88b 28.61bc 19.14e 23.88c N1 K0 34.72ab 23.78cd 29.25ab 32.38a 23.00d 27.69a N1 K1 35.80ab 24.11cd 29.96ab 32.38a 22.88d 27.62a N2 K0 35.89ab 21.43cd 28.66b 32.25a 20.92de 26.58ab N2 K2 38.96a 26.00c 32.48a 30.75ab 21.75de 26.25ab N0 K1 32.04b 21.50cd 26.77b 30.25abc 19.38e 24.81bc N0 K2 32.92b 21.25d 27.08b 27.74c 19.50e 23.62c Mean 34.59a 22.86b 162.7a 20.94b LSD at0.05 D 3.57 F 3.50 DF 4.18 D 1.52 F 2.12 DF 2.53 C V% 8.63 5.81
fresh weight, especially with a dense planting (D2) that received higher doses of nitrogen and
potassium (N2 K2).
Table 4. Effect of plant density and dose of nitrogen and potassium on pod fresh weight (g)
Differences between means as indicated by the same letters for the different treatments are not statistically significant at probability≤0.05.
3.5. Pod yield per plant (g)
The data pooled in Table 5 indicated that the plant yield responded significantly to the plant density (D), different doses of nitrogen (N) and potassium (K) fertilizer and their interaction. Lower plant density (D1) enhances pods yield per plant than the higher plant density (D2). In
the first season higher doses of both fertilizer (N2 K2) increased pod yield per plant
significantly, while in the second season the half dose of nitrogen without potassium (N1 K0)
gave a superior yield of pods per plant followed by a plant which received a similar dose of Fertilizer doses First season Mean Second season Mean 1 plant/pot 2 plants/pot 1 plant/pot 2 plants/pot
N0 K0 5.23ab 5.04ab 5.13a 5.18a 5.30a 5.21a
N1 K0 5.32ab 5.29ab 5.31a 5.58a 5.37a 5.48a N1 K1 5.41ab 5.12ab 5.26a 5.45a 5.21a 5.33a N2 K0 4.97ab 5.23ab 5.10a 5.10a 5.10a 5.10a N2 K2 5.48ab 4.95b 5.21a 5.18a 5.46a 5.32a N0 K1 5.29ab 5.57ab 5.43a 5.47a 5.02a 5.25a N0 K2 5.74a 5.21ab 5.47a 5.25a 5.04a 5.15a Mean 5.35a 5.20a 5.30a 5.21a LSD at 0.05 D 0.17 F 0.55 DF 0.66 D 0.23 F 0.44 DF 0.53 C V% 7.39 5.98
nitrogen with a half dose of potassium (N1 K1) in both seasons. Pod yield declined when
received no fertilizer (N0 K0) and when receiving potassium without nitrogen at higher dose
(N0 K2). Interaction between plant density and fertilizer showed that the lower plant density
(D1) improved plant yield under all different fertilizer doses compared with the higher plant
density, whereas the lower plant density (D1) with a complete dose of nitrogen and potassium
(N2 K2) in the first season and half dose of nitrogen without potassium (N1 K0) and half dose
of both (N1 K1) in the second season increased plant yield. High plant population (D2) treated
with higher potassium dose (N0 K2) had a negative effect on pod yield followed by a similar
density that received no fertilizer dose (N0 K0).
Table 5. Effect of plant density and dose nitrogen and potassium on pod yield per plant (g) Fertilizer doses First season Mean Second season Mean 1 plant/pot 2 plants/pot 1 plant/pot 2 plants/pot
N0 K0 166.6b 110.2b 138.4b 146.7c 101.5de 124.1c N1 K0 187.1ab 125.9cd 156.5ab 180.9a 123.6cd 152.3a N1 K1 194.1ab 122.5cd 158.3ab 176.7a 117.7de 147.2ab N2 K0 178.4b 112.1cd 145.2b 164.6ab 97.62e 131.1bc N2 K2 213.4a 139.8c 176.6a 158.4ab 118.7de 138.8abc N0 K1 169.3b 112.7cd 141.0b 165.4ab 102.9de 134.1abc N0 K2 179.3b 118.3cd 148.8b 145.6bc 98.43e 122.0c Mean 184.0a 120.2b 162.7a 108.6b LSD at 0.05 D 12.04 F 21.59 DF 25.75 D 6.68 F 22.05 DF 18.48 C V% 10.05 9.46 Differences between means as indicated by the same letters for the different treatments are not
3.6. Pod yield per hectare (ton ha-1)
Pods yield per hectare was calculated from the yield per plant multiplying by a number of plants per hectare; therefore the results followed the same pattern of significance and presented a different picture as green pod yield per plant (Table 6). Higher plant density (D2)
increased yield per unit area compared with lower density (D1). A full dose of nitrogen and
potassium fertilizer in the first season (N2 K2) and half dose of nitrogen in the second season
(N1 K0) had superior means in term of plant yield per hectare, followed by a plant treated with
lower doses of nitrogen and potassium (N1 K1) in both seasons, and plant receiving nitrogen
without potassium (N1 K0), in the first season. Plant grown without fertilizer (N0 K0) or with
potassium only (N0 K1; N0 K2) gave the lowest yield per hectare except the lower dose of
potassium in the second season. Interaction between plant density and fertilizer had the same result due to doubling density. Higher density with all doses of fertilizers over yielded lower density. Dense plant (D2) received a full dose of nitrogen and potassium (N2 K2) in the first
season and the plant received a half dose of nitrogen only (N1 K0) in the second season, gave
the greatest means. The lower density (D1) receiving no fertilizer (N0 K0) in both seasons
Table 6. Effect of plant density and dose nitrogen and potassium on pod yield per hectare (ton ha-1)
Differences between means as indicated by the same letters for the different treatments are not statistically significant at probability≤0.05.
4. DISCUSSION
The results of this experiment showed that the plant density and fertilizer doses had no effect on the number of branches per plant. This is in agreement with the results of Elhag and Hussein, (2014) who reported that there was no significant effect on the number of branches due to the number of plants per hole. Nutrient availability led to increase in plant dry weight. In both seasons lower plant density and higher dose of nitrogen and potassium in addition to lower nitrogen dose with potassium or without potassium and their interaction increased plant
Fertilizer doses First season Mean Second season Mean 1 plant/pot 2 plants/pot 1 plant/pot 2 plants/pot
N0 K0 18.00e 23.62bc 20.81b 15.62f 21.75bc 18.73c
N1 K0 20.04cde 26.64ab 23.34ab 19.38cdef 26.50a 22.94a
N1 K1 20.80cde 26.04ab 23.42ab 18.93cdef 25.22ab 22.08ab
N2 K0 20.78cde 24.01bc 22.40b 17.64def 20.92cde 19.28bc
N2 K2 22.86bcd 29.96a 26.41a 17.03ef 25.42ab 21.23abc N0 K1 18.13e 24.15bc 21.14b 17.72def 22.05bc 19.89abc N0 K2 19.20de 25.34b 22.27b 15.60f 21.08cd 18.34c Mean 19.97b 25.68a 17.43b 23.28a LSD at 0.05 D 2.35 F 3.15 DF 3.76 D 2.05 F 2.97 DF 3.54 C V% 9.78 10.32
dry weight, resulting in an increasing in the number of pods and pods yield per plant. Similar result was obtained by Koli and Akashe (1995). They reported that increased dry weight in French beans with increasing in row spacing. Hatami et al., (2009) who found that the nitrogen consumption increased plant dry weight resulting in increased plant yield. There was an inverse relationship between the density of plants and the number of pods per plant and a positive correlation between density and productivity of pods per unit area. Higher plant density produced fewer number of pods per plant, but the highest yield per unit area, due to increase the total number of plants per unit area, while the pod fresh weight was not affected (Figure 1).These results are in accordance with that of Elhag and Hussein, (2014) who found positive effects due to increase plant density. Alghamdi, (2002) reported that the number of plants per unit area seems to be more critical than the number of pods per planting influencing yield per unit area. Additionally, the application of nitrogen fertilizer at a higher or lower dose increased plant yield. This result is in close conformity with the findings of Moniruzzaman et al., (2009) recorded that the maximum number of green pods per plant with the lower plant density at the highest nitrogen level while, Srinivas and Naik, (1990); and Mtaita and Mutetwa, (2014) recorded the maximum pod yield of French bean at two higher doses of nitrogen. The application of potassium fertilizer without nitrogen had no effect on vegetative growth and yield parameters. This finding agrees with Ghallab et al., (2014) found that the highest total green pod yields was obtained by application of both nitrogen and potassium. However, a potassium fertilizer (alone) and untreated plants gave the lowest green pods. Seedy vegetables such as Pea and Bean absorbed less amount of potassium from the soil about 35 Kg fed-1 while, leafy vegetables absorbed more quantity of potassium about 160 Kg fed-1 (Hassan, 1997). N0 K0N1 K0N1 K1N2 K0N2 K2N0 K1N0 K2N0 K0N1 K0N1 K1N2 K0N2 K2N0 K1N0 K2 --15 20 25 30 35 D1 D2
Figure. Effect of interaction between plant density and dose of nitrogen and potassium on pod yield plant and yield per hectare
No. of pods/plant Pods yield per hectare ton/ha
5. CONCLUSION
From the above discussion, it could be concluded that the bean plant should be cultivated in the soil of Blida state and the areas of the similar soils at the plant density of twoplants per pot (214290 plants per hectare) with application of fertilizer dose spatially nitrogen in lower 0.46 or higher dose 0.92 g/pot (98.57 or 197.14 Kg urea/ha) while, the individual application of potassium fertilizer had a limited effect on pod fresh weight in the first season.
6. ACKNOWLEDGEMENTS
I would like to thank the technical staff in the Laboratory of vegetable biotechnologies production for their support, intellectual and handwork and Dr: Mohamed Osman, Omar Elzubair Pof:
Snousi Sid-Ahmed. Ministry of Higher Education and Scientific Research (Republic of Sudan)
and Ministry of Higher Education and Scientific Research (Republic of Algeria) for the scholarship.
6. REFERENCES
[1] Alghamdi S.S. Effect of salinity on germination and seedling growth of selected genotypes of faba bean (Vicia faba L.). Alex. Sci. Exch., 2002, 23(4), 409-420.
[2] Beg M.Z and Sohrab A. Effect of potassium on Moong Bean. Indian. J. L. Sci., 2012, 1(2), 109-114.
[3] Elhag A.Z and Hussein A.M. Effects of Sowing Date and Plant Population on Snap Bean (Phaseolus vulgaris L.) Growth and Pod Yield in Khartoum State. Universal. J. Agri. Res., 2014, 2(3), 115-118.
[4] Ghallab M.M, Marguerite A.R, Wahba B.S and Zaki A.Y. Impact of different types of fertilizers to reduce the population density of the sap sucking pests to bean plants. Egypt. Acad. J. Biolog. Sci., 2014, 7(2), 1-8.
[5] Hassan A.A. Principles of vegetable physiology. 1 st ed In: Nutrients elements and their effects on vegetable plants. Aldoge, Cairo, Egypt. Academic library1997, pp. 334.
[6] Hatami H, Aynehband A, Azizi M.S and khodabandeh M. Effect of nitrogen fertilizer on growth and yield of soybean in North Khorasan. Electr. J. crop. Prod., 2009, 2(2), 25- 42. [7] Hirel B.J, Gouis B, Ney A and Gallais F. The challenge of improving nitrogen use efficiency in crop plants: towards a more central role for genetic variability and quantitative genetics within integrated approaches. J. Exp. Bot., 2007, 58(9), 2369-2387.
influenced by row spacing, plant densities and nitrogen levels. Curr. Res., 1995, 20, 209-211. [9] Mfilinge A, Kevin M and Patrick A.N. Effects of rhizobium inoculation and
supplementation with P and K, on growth, leaf chlorophyll content and nitrogen fixation of Bush bean varieties. Amer. J. Res. Communication., 2014 2(10) 49-87.
[10] Monfreda C, Navin R and Jonathan A.F. Farming the planet: 2. Geographic distribution of crop areas, yields, physiological types, and net primary production in the year 2000. Glob. biogeochem. cycle., 2008, 22(1), 1022-1041
.
[11] Moniruzzaman M, Halim G.M andFiroz Z.A. Performances of French bean as influenced by plant density and nitrogen application. Bangladesh. J. Agril. Res., 2009, 34(1) 105-111. [12] Mtaita T and Mutetwa M. Effect of plant density and planting arrangement in Green bean
seed production. J. Glob. Innov. Agric. Soc Sci., 2014, 2(4), 152-157.
[13] Srinivas K and Naik, L. B. Growth yield and nitrogen uptake in vegetable French bean (Phaseolus vulgaris L.) as influenced by nitrogen and phosphorous fertilization. Haryana. J. Hortc. Sci., 1990, 19(1-2), 160-167.
[14] Vorob V.A. Effective inoculation of leguminous plants in relation to provision of phosphorus and potassium and dependence on rhizosphere temperature. Agrokhimiya., 2000, 2(222), 42-44.
How to cite this article:
Hussein A, Benmoussa M, Abbad M. Effect of population density and dose of nitrogen and potassium fertilizers on performance of green bean (phaseolus vulgaris). J. Fundam. Appl. Sci., 2018, 10(1), 46-58.