ORIGINAL ARTICLE
Multi-phase post-mortem CT angiography: development
of a standardized protocol
Silke Grabherr&Francesco Doenz&Beat Steger&Richard Dirnhofer&
Alejandro Dominguez&Barbara Sollberger&Erich Gygax&Elena Rizzo&
Christine Chevallier&Reto Meuli&Patrice Mangin
Received: 21 May 2010 / Accepted: 22 October 2010 / Published online: 7 November 2010 # Springer-Verlag 2010
Abstract The objective of this work was to develop an easily applicable technique and a standardized protocol for high-quality post-mortem angiography. This protocol should (1) increase the radiological interpretation by decreasing artifacts due to the perfusion and by reaching a complete filling of the vascular system and (2) ease and
standardize the execution of the examination. To this aim, 45 human corpses were investigated by post-mortem computed tomography (CT) angiography using different perfusion protocols, a modified heart–lung machine and a new contrast agent mixture, specifically developed for post-mortem investigations. The quality of the CT angiographies was evaluated radiologically by observing the filling of the vascular system and assessing the interpretability of the resulting images and by comparing radiological diagnoses to conventional autopsy conclusions. Post-mortem angiog-raphy yielded satisfactory results provided that the volumes of the injected contrast agent mixture were high enough to completely fill the vascular system. In order to avoid artifacts due to the post-mortem perfusion, a minimum of three angiographic phases and one native scan had to be performed. These findings were taken into account to develop a protocol for quality post-mortem CT angiography that minimizes the risk of radiological misinterpretation. The proposed protocol is easy applicable in a standardized way and yields high-quality radiologically interpretable visualiza-tion of the vascular system in post-mortem investigavisualiza-tions. Keywords Post-mortem angiography . Virtopsy . Virtual autopsy . Contrast agent . Angiofil
Introduction
Forensic and post-mortem radiology has become a field of intensive research in the recent years [1], with newly created research groups all over the world developing different techniques to increase the quality of post-mortem radiological imaging. The most commonly used imaging technique in the field is the multi-detector computed tomography (MDCT). MDCT is rapid and is easily
S. Grabherr (*)
:
F. Doenz:
R. Dirnhofer:
A. Dominguez:
C. Chevallier:
P. ManginUniversity Center of Legal Medicine Lausanne-Geneva, University of Lausanne,
Rue du Bugnon 21,
CH-1011 Lausanne, Switzerland e-mail: [email protected]
F. Doenz
:
E. Rizzo:
C. Chevallier:
R. MeuliDepartment of Diagnostic and Interventional Radiology, University Hospital of Lausanne,
Rue du Bugnon 46,
CH-1011 Lausanne, Switzerland B. Steger
FUMEDICA AG, Luzernerstrasse 91,
CH-5630 Muri AG, Switzerland R. Dirnhofer
FORIM-X AG, Marienstrasse 11,
CH-3005 Bern, Switzerland A. Dominguez
School of Health Sciences,
Radiologic Medical Imaging Technology, HES-SO, Rue du Bugnon 19,
CH-1011 Lausanne, Switzerland B. Sollberger
:
E. GygaxDepartment of Cardiovascular Surgery, University Hospital of Bern,
CH-3012 Bern, Switzerland DOI 10.1007/s00414-010-0526-5
performed, and in comparison with magnetic resonance imaging, its acquisition and maintenance costs are relatively low. At the same time, even though the utility of post-mortem MDCT has been demonstrated [2], a computed tomography (CT) scan without the injection of contrast agent provides little information about organic lesions and the vascular system.
The development of post-mortem CT angiography constituted a significant progress in this type of investiga-tion [3–6]. In this technique, vascular diagnosis can be made after injection of different contrast agents much like in clinical CT angiography. The history of post-mortem angiography dates back to the very early years following the discovery of X-rays. The first half of the twentieth century saw a plethora of angiographic studies that introduced a variety of contrast agents and injection techniques [7]. Unfortunately, most of this early work fell into oblivion. Forensic or pathological investigations only rarely employ post-mortem angiography, and when they do, it is performed essentially on single organs [7].
In the era of modern forensic radiology, post-mortem angiography is undergoing a revival. In contrast to earlier studies, today’s focus is on developing minimally invasive techniques that allow whole-body angiography [4,5]. Thus, the recently published“two-step post-mortem angiography” technique [4] employs a modified heart–lung machine in
order to establish a post-mortem circulation, allowing the injection of a contrast agent similar to clinical CT angiography. The initial perfusion is performed with an oily medium (paraffinum perliquidum) that flushes out post-mortem clots and remaining blood, followed by the injection of the oily contrast agent Lipiodol Ultrafluide®. The chosen lipophilic perfusate and the contrast agent offer the advantage of remaining intravascular for long periods of time after injection [3,8,9]. In addition, depending on the viscosity of the oily liquid, the capillary system can be excluded from the circulation owing to microembolization [3, 10]. The technique offers a great advantage in post-mortem angiography by preventing loss of perfusate in the tissues. Because circulation can still be established if the capillary system of the body is damaged due to post-mortem changes, the post-post-mortem interval prior to this type of angiography is extended compared to angiographies that employ hydrophilic contrast agents.
The minimally invasive post-mortem CT angiography technique presented in this article is essentially based on this “two-step post-mortem angiography” method. The most important improvement we introduced is the develop-ment of a new contrast agent Angiofil® (Fumedica AG, Muri, Switzerland).
The first priority of the present study was to develop a protocol that allows the performance of post-mortem angiography of high quality. This means that the new
protocol should not only fill the vascular system by hazard in order to obtain nice images but it should allow to perform exact radiological interpretation by decreasing artifacts due to the perfusion and by reaching a complete filling of the vascular system. The second priority of the study was to ease and standardize the execution of the examination. This seems necessary to us in order to integrate this kind of examination into the routine of forensic medicine and to have a documented trace about what exactly was done with the body that is the subject of a medico-legal investigation.
Materials and methods Subjects
A total of 45 human corpses were used in the study. In the first ten cases, the bodies were donated by anatom-ical institutes, and a summary of the medanatom-ical history of the diseased was made available. The other 35 cadavers were delivered to the institute of forensic medicine for forensic autopsy. Causes of death included trauma (such as stab wounds or traffic accidents), intoxication (such as drug or carbon monoxide intoxication) and disease (such as heart attack or gastro-intestinal hemorrhages due to gastric cancer). The post-mortem interval in the medico-legal cases ranged from a few hours (at least 5 h) to 4 days (2 days in room temperature and 2 days in the refrigerating hold). Bodies donated by anatomical insti-tutes were frozen 1 or 2 days after their death. They were transported to our institute after a freezing period of 1 to 4 months. The post-mortem angiography was performed after an unfreezing period of 1 week at room temperature (during daytime) and in the refrigerating hold (during nighttime). In each case, a forensic autopsy was performed after the radiological investigations. The study was approved by the local justice department and the ethics committee.
Contrast agent
The oily liquid Angiofil® is a contrast agent consisting of iodized linseed oil. It can be used to perform micro-angiography after dilution in a solvent (e.g., hexadecane or tetradecane) [11]. To perform whole-body CT angiography, Angiofil® was mixed with paraffin oil. In the first two cases of our study, Angiofil® was introduced as a bolus injection, similar to previous studies [4]. In all other cases, it was mixed with paraffin oil prior to injection (Table 1). In ten cases (cases 2–11), a 3% Angiofil® mixture was used. In the other cases, the concentration was increased to 6% (60 ml of Angiofil® per liter of paraffin oil).
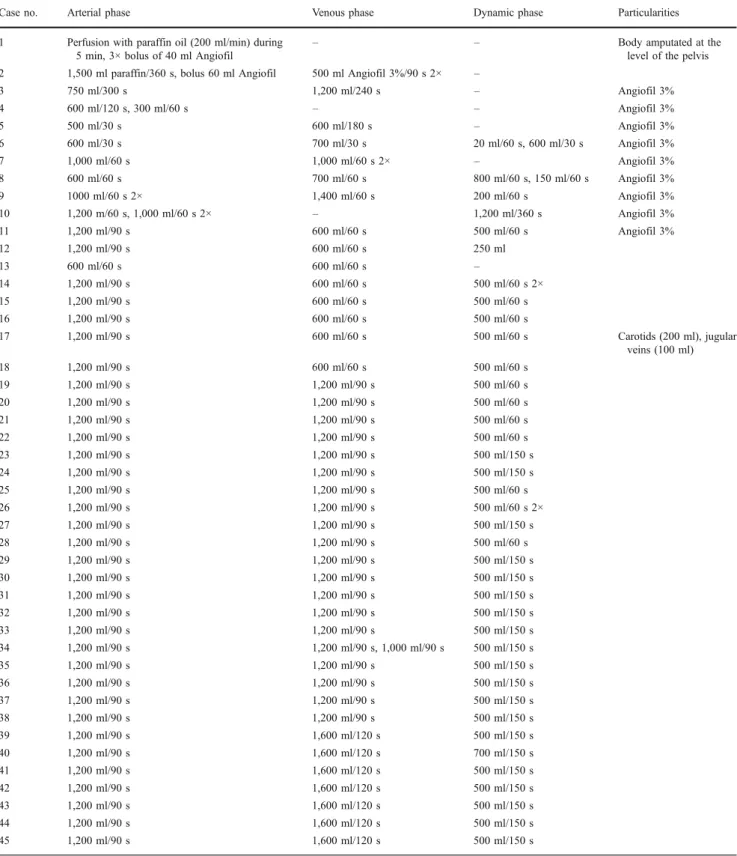
Table 1 Perfusion procedures in the 45 investigated cases
Case no. Arterial phase Venous phase Dynamic phase Particularities 1 Perfusion with paraffin oil (200 ml/min) during
5 min, 3× bolus of 40 ml Angiofil
– – Body amputated at the level of the pelvis 2 1,500 ml paraffin/360 s, bolus 60 ml Angiofil 500 ml Angiofil 3%/90 s 2× –
3 750 ml/300 s 1,200 ml/240 s – Angiofil 3% 4 600 ml/120 s, 300 ml/60 s – – Angiofil 3% 5 500 ml/30 s 600 ml/180 s – Angiofil 3% 6 600 ml/30 s 700 ml/30 s 20 ml/60 s, 600 ml/30 s Angiofil 3% 7 1,000 ml/60 s 1,000 ml/60 s 2× – Angiofil 3% 8 600 ml/60 s 700 ml/60 s 800 ml/60 s, 150 ml/60 s Angiofil 3% 9 1000 ml/60 s 2× 1,400 ml/60 s 200 ml/60 s Angiofil 3% 10 1,200 m/60 s, 1,000 ml/60 s 2× – 1,200 ml/360 s Angiofil 3% 11 1,200 ml/90 s 600 ml/60 s 500 ml/60 s Angiofil 3% 12 1,200 ml/90 s 600 ml/60 s 250 ml 13 600 ml/60 s 600 ml/60 s – 14 1,200 ml/90 s 600 ml/60 s 500 ml/60 s 2× 15 1,200 ml/90 s 600 ml/60 s 500 ml/60 s 16 1,200 ml/90 s 600 ml/60 s 500 ml/60 s 17 1,200 ml/90 s 600 ml/60 s 500 ml/60 s Carotids (200 ml), jugular veins (100 ml) 18 1,200 ml/90 s 600 ml/60 s 500 ml/60 s 19 1,200 ml/90 s 1,200 ml/90 s 500 ml/60 s 20 1,200 ml/90 s 1,200 ml/90 s 500 ml/60 s 21 1,200 ml/90 s 1,200 ml/90 s 500 ml/60 s 22 1,200 ml/90 s 1,200 ml/90 s 500 ml/60 s 23 1,200 ml/90 s 1,200 ml/90 s 500 ml/150 s 24 1,200 ml/90 s 1,200 ml/90 s 500 ml/150 s 25 1,200 ml/90 s 1,200 ml/90 s 500 ml/60 s 26 1,200 ml/90 s 1,200 ml/90 s 500 ml/60 s 2× 27 1,200 ml/90 s 1,200 ml/90 s 500 ml/150 s 28 1,200 ml/90 s 1,200 ml/90 s 500 ml/60 s 29 1,200 ml/90 s 1,200 ml/90 s 500 ml/150 s 30 1,200 ml/90 s 1,200 ml/90 s 500 ml/150 s 31 1,200 ml/90 s 1,200 ml/90 s 500 ml/150 s 32 1,200 ml/90 s 1,200 ml/90 s 500 ml/150 s 33 1,200 ml/90 s 1,200 ml/90 s 500 ml/150 s 34 1,200 ml/90 s 1,200 ml/90 s, 1,000 ml/90 s 500 ml/150 s 35 1,200 ml/90 s 1,200 ml/90 s 500 ml/150 s 36 1,200 ml/90 s 1,200 ml/90 s 500 ml/150 s 37 1,200 ml/90 s 1,200 ml/90 s 500 ml/150 s 38 1,200 ml/90 s 1,200 ml/90 s 500 ml/150 s 39 1,200 ml/90 s 1,600 ml/120 s 500 ml/150 s 40 1,200 ml/90 s 1,600 ml/120 s 700 ml/150 s 41 1,200 ml/90 s 1,600 ml/120 s 500 ml/150 s 42 1,200 ml/90 s 1,600 ml/120 s 500 ml/150 s 43 1,200 ml/90 s 1,600 ml/120 s 500 ml/150 s 44 1,200 ml/90 s 1,600 ml/120 s 500 ml/150 s 45 1,200 ml/90 s 1,600 ml/120 s 500 ml/150 s
While the procedure varied extensively in the first ten cases, it became progressively more unified as the number of cases increased. Eventually, the technique became standardized, and only small modifications were applied in cases 11–45. While in the first five cases, only arterial and venous phases of angiography were performed, a dynamic phase was added from the sixth case onwards. In all cases starting with case 18, a standardized protocol was used. The last modification occurred in case 39 where the venous volume was increased one last time
Preparation
Prior to angiography, the judge in charge of each forensic case was informed about the new technique and authorized its use on the cadaver. As routine in our institute, a native CT scan (CT LightSpeed 8, GE Healthcare, Milwaukee, WI, USA) was performed on each body, documenting from cerebral vertex to pubic symphysis. The following scan parameters were used: field of view (FOV), 50 cm; slice thickness, 2.5 mm; interval of reconstruction, 2 mm, 120 kVp, and 280 mA; and scan time, 150 s. Additionally, in each case, a detailed forensic external examination was conducted prior to any alteration of the body necessary for post-mortem angiography.
Once these procedures executed, sample collections for additional analysis that could be influenced by the contrast agent were performed. Therefore, we underwent post-mortem image-guided biopsy [12] in order to detect fat embolism (two samples from each lung) by subsequent histological analysis [13, 14]. To carry out toxicological analyses without any contamination and possible artifacts due to the contrast agent mixture, liquid samples were collected using image-guided liquid puncture if necessary (e.g., for collecting the bile).
Perfusion was performed using a modified heart–lung machine as described for the “two-step post-mortem angiography” [4]. In the two cases where the contrast agent was administered as a bolus injection, the tubes were filled with paraffin oil; in all other cases, the tubes were filled with the Angiofil® mixture (Table1).
Femoral vessels on one side of the corpse were chosen as access points to the vascular system as described in Grabherr et al. [4]. Only in one instance (case 17), another access to the vascular system was chosen. This was necessary because of a complete rupture of the aorta preventing the perfusion of the cranial vessels. In this case, the first autopsy cut was performed already on the CT table (cut in the skin and the subcutaneous fat tissue from the distal extremity of the right clavicle, following the superior border of the clavicle, passing above the superior border of the sternum, following the superior border of the left clavicle until its distal extremity). Skin and subcutaneous fat tissue were lifted from the muscles as a flap up to the distal parts of the carotid arteries and jugular veins in order to expose the vessels. Cannulas, which have first been placed into the femoral vessels, were than inserted into the right carotid artery and the unilateral jugular vein. In order to direct the perfusion into the cranial direction, the two vessels were ligated caudally to the cannulas.
Angiography and perfusion
Different protocols were tested. Perfusion parameters and technical details of all cases are listed in Table 1. To
summarize the techniques used, the cases can be split in different groups with similar parameters.
Group I (n=2) These two cases (1–2) had in common that the contrast agent was injected as bolus during an ongoing perfusion. In case 1, 1,000 ml of paraffin oil was used for perfusion, and no venous phase was performed. In case 2, a relatively high volume of perfusion liquid was injected in the arterial phase (1,500 ml), and a small volume was used for the venous phase (500 ml).
Group II (n=9) In contrast to the first group, an essential change was made by injecting the contrast agent directly as a mixture with paraffin oil and not as a bolus. A dilution of 3% was chosen for all cases of this group (3–11). Concerning the perfusion technique, most variations have been made in these cases. While in cases 3–5, only arterial and venous phases of angiography were performed, a dynamic (circulating) phase was added from the sixth case onwards. A specialty of this phase was that CT data were recorded during active perfusion of the contrast agent mixture through the vascular system. The injected volume varied from 1,500 to 500 ml per phase. In some cases, phases have been repeated in order to control the filling of the vascular system after having applied additional volumes. In two cases (4 and 10), no venous phase was performed with the aim to investigate the possibility to fill the venous system via the arteries.
Group III (n=7) Most important changing in this group (cases 12–18) was the new dilution of contrast agent. Instead of 3% of Angiofil®, a mixture of 6% was used. The perfusion protocol became more standardized. Concerning the arterial phase, we injected in all cases, except one, 1,200 ml of contrast agent mixture during 90 s. Only in case 13, we injected the 600 ml during 60 s. The venous phase became also more standardized. We injected 600 ml during 60 s in each case. All cases in this group had also a dynamic phase of angiography, except case 13 which presented an aortic rupture in the arterial phase. Parameters of the dynamic phase varied in this group. In case 14, we repeated the dynamic phase to find out if further changes would appear if a fourth phase was added to the protocol. In case 17, we tested a new access to the vascular system by cannulating the vessels of the neck as described above. Group IV (n=20) This group (cases 19–38) was performed using an even more standardized protocol consisting in three angiographic phases. The arterial phase as well as the venous phase was performed after injection of 1,200 ml of contrast agent mixture (6%) during 90 s. For the dynamic phase, further 500 ml has been injected during 60 or 150 s. Only exceptions were made in cases 26 and 34, where we
repeated one of the phases (circulating phase in case 26 and venous phase in case 34) to control the effect of this repetition on the resulting images.
Group V (n =7) In this last group (cases 39–45), an essential difference has been made by changing the volume injected during the venous phase. It was increased from 1,200 ml during 90 s to 1,600 ml during 120 s. The arterial phase as well as the circulating phase was used according to group IV (1,200 ml in 90 s for the arterial phase and 500 ml during 150 s for the dynamic phase). In this group, the parameters used followed the new standardized protocol except in case 40, where we increased the injection volume of the dynamic phase in order to investigate eventual advantages of this changing.
In performing the CT angiographies, it was necessary to coordinate the contrast agent perfusion with CT data acquisition. Therefore, after having injected the specific volume of contrast agent mixture, the perfusion was stopped, the arterial tube (in the arterial phase) or venous tube (in the venous phase) was clamped near the cannula, and the CT recording was initiated covering head, thorax, and abdomen. Scan parameters of the arterial phase were as follows: FOV, 50 cm; slice reconstructed thickness, 1.25 mm; interval of reconstruction, 0.6 mm, 120 kVp, and 280 mA; and scan time, 140 s. For the venous phase, same parameters were used except the slice reconstructed thickness, which was increased to 2.5 mm.
In order to perform the dynamic (circulating) phase, the technique had to be adapted by opening all clamps on the tubes in order to allow the contrast agent mixture to enter the body while the liquid was flowing back from the venous side into the reservoir. Once a defined volume of contrast agent had been injected into the vascular system, the flow rate was reduced to about 100 ml per minute and CT data acquisition was started. Scan parameters were the same as those in the venous phase. In some cases, high-resolution scans of the cardiac region were performed instead of whole-body scans. In these cases, the following scan parameters were used: FOV, 25 cm; slice reconstructed thickness, 0.625 mm; interval of reconstruction, 0.3 mm, 120 kVp, and 250 mA; and scan time: 30 s. Perfusion was stopped as soon as the CT data were recorded.
Evaluation
Radiological evaluation The radiological data were inter-preted jointly by the radiologists and the forensic patholo-gists leading to both radiological diagnoses and assessments of the quality of perfusions. In each case, a radiological report was established covering both aspects of investiga-tion. Specifically, the reports indicated all instances where a
vessel was not opacified or was only incompletely opacified. Each report was signed by at least three experts: a forensic pathologist with experience in forensic imaging and respon-sible for the project, a board-certified radiologist with special experience in clinical angiography, and a board-certified neuroradiologist.
Conventional autopsy A complete conventional autopsy compliant with the local standards (examination of the cranial, thoracic, and abdominal cavity) was performed for all cases. The results of the conventional autopsies were compared to the radiological examinations.
Results
In order to develop a protocol that should lead to an ideal filling and demonstration of the vascular system, different parameters have been tested and their influence on the resulting images was investigated.
1. Application of the contrast agent
The technique of bolus injection of the contrast agent was used in group I, as it was proposed in the literature [4]. In both examinations, CT scans had to be repeated because the operating radiographer did not start the scan at correct time. Either the upper or the lower part of the vascular system was not filled with Angiofil® but only with paraffin oil. This problem could be avoided in group II, where the contrast agent was mixed with paraffin oil even before the injection into the body. The 3% Angiofil® mixture used in this group revealed sufficient opacity to perform radiological diagnosis in main vessels, but the demonstration of small vessels was weak. For groups II–V, mixtures of 6% were used that yielding optimal radiological opacity of the whole vascular system (Fig.1).
2. Perfusion volume
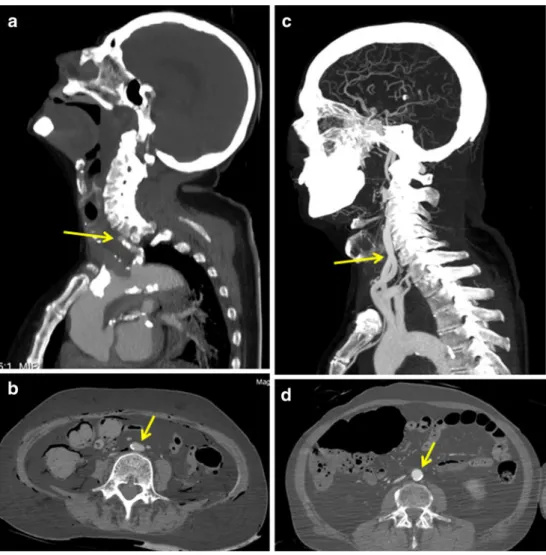
This parameter turned out to be one of the most important criteria to increase the quality of the examination. A correct radiological interpretation was only possible if the vascular system was completely filled with contrast agent. Otherwise misinterpretation occurred (e.g., diagnostic of vascular occlusion of vessels which were not opacified in the periphery). We found out that the filling of the vascular system was directly related to the injected volume. Thus, when relatively small volumes (600–750 ml) of the contrast agent mixture were injected in the arterial phase (group II), the arterial system was only filled incompletely and some vessels were not at all opacified. Incomplete filling was observed mostly in the intracranial arteries (Fig. 2a), the coronary arteries, and the pulmonary veins. In addition,
some of the visualized vessels appeared flattened (Fig.2b), especially in regions where they have collapsed under the pressure of surrounding organs, as could be seen in the native CT scan. This phenomenon was observed mostly in the abdominal and thoracic aortas. By applying higher volumes of the contrast agent in the arterial phase, these artifacts were considerably reduced. Thus, in all cases where 1,200 ml Angiofil® mixture was injected (group III–V), complete filling was observed in the intracranial arteries (Fig.2c), the coronary arteries, and the pulmonary veins. The only exceptions were cases where traumatic lesions of the arterial system (such as aortic rupture) led to important extravasations of the contrast agent. The phenomenon of collapsed vessels was not observed (Fig.2d).
Similar observations were made for the venous phase of angiography. Small volumes (e.g., 600 ml) of the contrast agent mixture (groups II and III) led to incomplete filling of the cerebral sinus and of the pulmonary arteries. By increasing the volume of the Angiofil® mixture in group IV, a considerable improvement in the visualization of the veins was obtained, especially in the incompletely filled regions. In comparison with the arterial phase, a higher volume of the contrast agent, 1,600 ml, was required for
quality imaging, as it was injected in group V. In some cases, even this quantity proved insufficient to visualize the whole intracranial sinus, the observed limit being at the level of the transversal sinus or in the lower parts of the sagittal sinus. In other cases, even the bridging veins were visualized using a venous volume of 1,600 ml.
The filling of pulmonary arteries was also investigated. A 600-ml injection led to no detectable filling or only partial filling (Fig.3a). When 1,200 ml was injected, filling of the pulmonary arteries extended to more peripheral vessels. A 1,600-ml injection into the venous side revealed even the peripheral pulmonary arteries (Fig. 3b). In some cases, in particular when the post-mortem interval exceeded 2 days, the filling of the pulmonary arteries proved impossible, independent of the injected volume. In these cases, post-mortem clots obliterated the pulmonary arteries, a situation reminiscent of pulmonary embolism. A similar phenomenon was observed in the right hepatic vein of two cadavers. The presence of post-mortem clots could be verified by conventional autopsy.
Because our routine CT protocol did not include scans of the arteries of the arms, they were not visualized completely and not investigated in detail. In cases where the whole
Fig. 1 Influence of the dilution of the contrast agent mixture on the quality of the CT images. a, b Images reconstructed from the data set where a mixture of 3% of Angiofil® was injected. While vessels of larger caliber such as the ascending aorta (star) and even the right coronary artery (yellow arrow) are well visible, arteries with a fine caliber, such as the circumflex artery (white arrow), are not opacified
enough to interpret eventual stenosis. c, d Images reconstructed from the data set where a mixture of 6% of Angiofil® was injected. All vessels (star ascending aorta, yellow arrow right coronary artery) even the small circumflex artery (white arrow) are clearly visible due to the high opacity of the mixture
arms were included in the FOV, the main arteries were visualized at least up to the wrists. The legs were also omitted from our protocol. In some cases, we performed a scan of the knee, which was opposite to the cannulation site on the corpse. Knee scans revealed clearly all the arteries of
the knee. When the perfusion was initiated at the carotid artery, the intracranial arteries were found to be completely opacified. The venous system of the arms and legs was not specifically investigated. However, in cases where parts of the members had been scanned or were visible in the FOV,
Fig. 3 Influence of the perfusion volume on the filling of the venous system (example, pulmonary arteries). a Using a venous perfusion volume of 600 ml, the pulmonary arteries show a stop of the opacification in the periphery (white arrows). Additionally, the main
arteries are not completely filled, presenting a layer of contrast agent and remaining blood (yellow arrows). b Using a venous perfusion volume of 1,600 ml, the main pulmonary arteries as well as their peripheral branches are completely filled
Fig. 2 Influence of the perfu-sion volume on the filling of the arterial system. a, b Images reconstructed from the data set where a perfusion volume of 600 ml was injected into the arterial system. A stop of opacification is visible in the proximal part of the carotid artery (arrow in a). No intracra-nial arteries are visualized. The abdominal aorta is flat (arrow in b) due to the pressure of the surrounding tissue. c, d Images reconstructed from the data set where a perfusion volume of 1,200 ml was injected into the arterial system. The carotid arteries are well opacified form proximal to distal (arrow in c). The intracranial arteries are clearly visible. The abdominal aorta is round (arrow in d), allowing a correct radiological interpretation and measurements such as the vessels diameter
incomplete filling of the veins was observed, even when the arteries were opacified. Perfusion of the jugular vein led to the opacification of the right intracranial venous sinuses up to the level of the saggital sinus.
3. Perfusion time
Different perfusion times were used in our study. In fact, changes in this parameter did not influence the quality of the resulting images. No difference was seen if the perfusion volume of, e.g., 600 ml was injected in 180 s (case 5) or in 60 s (cases of group II).
4. Performance of different phases
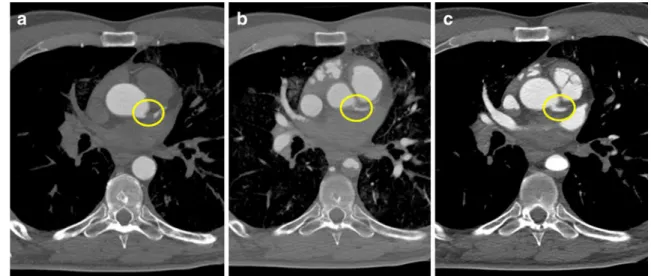
Besides the perfusion volume, the performance of different phases is one of the two most important parameters. In nearly all cases, an arterial and a venous phase was performed, which revealed to be necessary to reach a complete filling of the whole vascular system. Although our experiences, made on two cases of group II (cases 4 and 10), showed that it was possible to fill the venous system via the arteries, this technique revealed to be less efficient than the direct filling of the venous part. In fact, by filling the veins via the femoral vein, a better distribution of the contrast agent inside the venous system was noticed and fewer artifacts due to extravasation of contrast agent in the gastro-intestinal cavities were observed. Therefore, all cases of group III–V underwent the venous phase of angiography. An important increase of the image quality was observed by performing the dynamic/circulating phase. In fact, the most effective filling of the vascular system was observed after this phase. In some cases, parts of the arterial or venous system were incompletely filled, indicating possible local stenosis. Such incomplete filling was primarily observed in the common trunk of the left coronary artery (Fig. 4). In about a quarter of all cases, radiological interpretation of the coronary arteries could only be carried out in the dynamic phase.
Resulting protocol
Taking in consideration all observations made by changing different parameters, we propose to perform the post-mortem CT angiography using the protocol shown in Table2. This protocol was successfully applied to visualize the whole vascular system of the head, thorax, and abdomen in all cases of group V. The only exceptions comprised parts of the cerebral sinus and vessels which were occluded due to huge post-mortem clots.
Comparison between CT angiography and autopsy As the aim of our study was to develop a technical protocol to perform post-mortem angiography and not to investigate
the potential of this technique in general, we just want to point out some of our observations:
By comparing post-mortem angiography with conven-tional autopsy, we established that nearly all vascular pathologies could be detected using post-mortem angi-ography. In fact, the radiological examination provided additional information, not available from conventional autopsy, such as the dissection of the intracranial region of the carotids, lesions of the radial arteries, the lumbar arteries, the jugular veins and their branches, etc. Indeed, angiography revealed even more vascular pathologies than conventional autopsy and made it possible to identify the type of hemorrhages (arterial or venous) and their sources.
A radiological limitation concerned the detection of non-occlusive small arteriosclerotic lesions such as fat deposits on the vascular wall or other small non-calcified arterio-sclerotic lesions. In two cases, the autopsy revealed small hemorrhages in arteriosclerotic lesions that did not reduce the vascular lumen in the coronary arteries. Also, the problem of false positive detection of pulmonary embolism due to huge post-mortem clots has to be mentioned.
In all but one case and in contrast to earlier inves-tigations on oily contrast agents [3,6], no extravasation of the Angiofil® mixture into the corporal cavities or the gastro-intestinal tract was observed. The exception was case 10, where the arterial system was perfused with a total of 3,200 ml. In all other cases, only a few small drops of oily matter were found on the surface of the stomach contents. In one instance, the autopsy was performed 1 week after the post-mortem angiography, and even in this case, no oily liquid could be found in the thoracic or abdominal cavity. Although the post-mortem interval of our cases varied a lot, we did not observe considerable differences except in the gastro-intestinal part. We observed that bodies that were frozen and had to be unfrozen presented an important enhancement of the gastro-intestinal mucosa and even extravasation of contrast agent mixture into the gastro-intestinal cavities. The phenomenon of enhancement could be explained during autopsy be observing an edema of the mucosa. In bodies that were examined shortly after death (1 to 4 days), these observations were less important. In those cases, we observed an enhancement of the mucosa but no or only a very slight extravasation into the gastro-intestinal cavities.
In cases with vascular lesions, the recordings in the dynamic phase could be used as an indication of the importance of bleeding. Thus, virtually no differences in extravasation were found between small chronic hemor-rhages. In contrast, more important bleedings led to clear differences in the volume of the extravasated liquid when the arterial or venous phases were compared with the dynamic phase (Fig.5).
Discussion
In this work, we developed a convenient technique to perform high-quality post-mortem angiography that should allow performing exact radiological interpretation and to ease and standardize the execution of the examination. This claim is supported by the fact that the use of our resulting protocol decreases artifacts due to the perfusion and leads to a complete filling of the vascular system. Additionally, the standardized
examination can be performed within a reasonable time period (currently 2 to 3 h, including preparations such as liquid sample collection and post-mortem biopsies). Our protocol makes it possible to visualize the vascular system of the head, thorax, and abdomen and to carry out radiological diagnoses much like in a clinical examination.
To obtain this protocol, different perfusion techniques have been tested on 45 human bodies, and the influence of each parameter on the resulting images has been investi-gated. A modified heart–lung machine and the application of the oily contrast agent Angiofil® were used on all bodies. The human corpses were split into five groups, on which similar perfusion parameters were used. While the parameters varied a lot in the first three groups, those of groups IV and V were getting more standardized.
The first parameter that we have investigated was the application of the contrast agent. In the beginning, it was injected as bolus, which revealed no satisfying results. Although the CT scans were performed by radiographers with several years of experience in clinical CT angiography, it was not possible for them to catch the right moment after the bolus injection to start the CT scan. Taking in consideration that we wanted to develop an easy applicable technique, we changed the injection method into a direct injection of a mixture of contrast agent and perfusion liquid (paraffin oil). A mixture of 6% was finally esteemed as adequate to obtain an excellent opacification of the whole vascular system.
The next parameters examined were the perfusion volume and the injection time. While the injection time
Table 2 Resulting protocol
Calculation Application Flow rate
(ml/min) Duration (min/s) Total volume (ml) Arterial phase 800 1′30″ 1200 Venous phase 800 2′00″ 1600
Dynamic (circulating) phase 200 2′30″ 500
Set filling (3/8″-tube) 400
Total consumption 3,700
Preparation Volume (ml)
Paraffin oil 3,500
Angiofil (6%) 210
Total mixture 3,710
Volume, flow rate, and injection time are given for each of the three angiographic phases. The volumes of Angiofil® and paraffin oil are calculated in order to ease the preparation of the contrast agent mixture
Fig. 4 Visualization of the common trunk of the left coronary artery in the different angiographic phases. a Arterial phase: The common trunk of the left coronary artery (circle) is not opacified, which prevents any interpretation of the vessel and may lead to radiological misinterpretation. b Venous phase: Due to the increasing pressure in the vascular system after filling of the venous system, Angiofil®
penetrated further into the periphery, and the common trunk of the left coronary artery (circle) was visualized as a result. However, only a fine trace of contrast agent is visible in the vascular lumen, a situation which does not allow radiological interpretation. c Dynamic phase: The common trunk of the left coronary artery (circle) is completely filled with the contrast agent and stenosis can be radiologically excluded
revealed to be of no importance, the perfusion volume turned out to be the key to reach a high quality of the examination. In fact, according to our results, a complete filling of the vascular system is of highest importance if a correct radiological diagnosis has to be made. We found out that this filling depends directly on the injection volume. If the volume of injected contrast agent mixture is too low, a vessel may be incompletely filled because it is genuinely occluded or simply because the volume of the contrast agent mixture is insufficient to fill the whole vascular system. Based on the comparisons of our angiographic data, vessel per vessel, optimal filling required relatively important volumes of the contrast agent mixture. A volume of 1,200 ml for the arterial phase was used in most cases of groups III–V and yielded satisfactory results in all of these cases. In the venous phase, results could be considerably improved by raising the volume to 1,200 ml (group IV) and finally to 1,600 ml (group V), even though in some cases,
complete filling of the venous sinus of the head was never achieved. If in some instances, the sagittal sinus was not completely filled, the visualization of the pulmonary arteries in the venous phase was satisfactory in all cases where 1,600 ml of Angiofil® had been injected, with the exception of vessels completely filled with post-mortem blood clots. The difference of the volumes needed to visualize the arterial and the venous system may have several physiological bases. Firstly, the venous system contains a bigger volume of blood than the arterial system. Secondly, the average diameter of a single venous vessel is larger in comparison with that of the arterial system. Finally, the vessels of the arterial system are relatively rigid, while those of the venous system are much more dilatable. For all these reasons, the complete filling of the venous vessels may be more difficult.
As third parameter, we investigated the influence of the performance of different angiographic phases. We rapidly
Fig. 5 Case of a 62-year-old man known as an alcohol addict. His body was found in an excavation next to a road. External examination showed traces of an important bleeding from the ear and a contused wound in the right occipital region. Radiological examination yielded the following findings. a Native CT scan: Maximum intensity projection (MIP) reconstruction showing a fracture of the right sphenoid bone (arrows). b Arterial phase: An extravasation of Angiofil® (arrow) was observed in the right occipital region whose
origin could be attributed radiologically to the right occipital artery. c Venous phase: Angiofil® extravasation (arrows) was observed following the auricle with its origin from the right jugular sinus. d Dynamic phase: After further Angiofil® perfusion in the dynamic phase, the importance of the hemorrhages is visualized due to the formation of a huge accumulation of contrast agent (arrow) which is nourished from the venous bleeding as well as from the arterial one
found out that it was necessary to perform an arterial as well as a venous phase in order to completely fill the whole vascular system. Although it was possible to visualize the venous system via the arteries in injecting the whole perfusion volume into the femoral artery, the direct filling of the venous system revealed better results and could avoid artifacts that appeared by using only an arterial access. An important changing was made during the examination of group II. For the first time, we started to perform a third angiographic phase called the dynamic or circulating phase. The specialty of this phase is that the data acquisition is performed during an ongoing circulation of the contrast agent mixture and, therefore, while the vascular system is under the pressure of the perfusion. In fact, the idea to perform angiographic images during an ongoing perfusion was already described in the literature [4]. The aim was to simulate an intra-vital circulation during the data acquisition.
In contrast to other techniques and protocols [6], the three angiographic phases described in our protocol allowed the visualization of all vessels without changing the position of the body. This fact is important because two data acquisitions after the contrast agent injection may not be sufficient to avoid misinterpretations. This is clearly shown by our results: one out of every four of our cases would have been misinterpreted if only an arterial and venous phase had been performed as proposed in the literature [6]. If two phases are sufficient for effective visualization of the vascular system, we believe that real radiological interpretation absolutely requires a third phase, especially when coronary arteries are involved. We also believe that a radiological image that appears to indicate a stenosis or a vascular occlusion can only be interpreted as such if the finding is visible in two phases. Indeed, small post-mortem blood clots or blood deposits may yield similar visual results as local stenosis. Therefore, in case of doubt, a fourth phase (second dynamic phase) is recommended in order to confirm the diagnosis. This recommendation is also supported by the finding that in some of cases, an entire vessel seemed to be occluded because it was not opacified. This phenomenon appeared mostly in coronary arteries, especially in the circumflex coronary artery. In all but one case, the artery was opacified in the dynamic phase. The exception, where the artery remained invisible in both the arterial and the dynamic phases, was due to the occlusion of the artery by large arteriosclerotic lesions, as subsequently revealed by autopsy.
In contrast to earlier studies using oily liquids for post-mortem angiography [4, 5], we didn’t observe
extravasa-tions of the perfusion liquid and the contrast agent mixture into body cavities during autopsy. Even in cases with a long time gap between angiography and autopsy, no such artifacts were observed. This can be explained by to the
use of higher viscous paraffin oil (paraffinum liquidum instead of paraffinum perliquidum) in our study. Except in cases with a long post-mortem interval (1 to 4 months) and with periods of freezing and unfreezing, there was no considerable extravasation of the contrast agent mixture into the gastro-intestinal lumen, even though we did observe discrete edemas in the gastro-intestinal mucosa. These edemas were visible as tissue enhancement and can thus be considered as “physiological” in post-mortem CT angiography. Slight physiological enhancements could also be observed in the brain gray matter, a finding similar to the one described by Ross et al. [6].
Importantly, every post-mortem angiography with Angiofil® must be preceded by a pulmonary biopsy. As described in the literature [3], oily liquids enter the venous system by passing through small arteriovenous shunts while the capillary microcirculation is arrested. This leads to fat embolism in capillaries or small precapillary vessels. In forensic investigations, the search for fat embolism is often important for two reasons: it may help determine the cause of death and it is also an important vital sign in case of trauma. Because fat embolism is usually investigated in the pulmonary tissue [13, 14], samples of pulmonary tissue must be collected before injecting the oily contrast agent that itself can cause“artificial” fat embolism.
The proposed protocol for performing post-mortem angiography is the first step towards the integration of this technique into the daily practice of post-mortem investiga-tion. While our primary goal was to develop this protocol, our work also shows the potential benefits of angiography in forensic or pathological investigation. In conventional autopsy, the vascular system cannot be readily seen. In contrast, post-mortem angiography makes it possible to visualize vessels in a manner and in such detail that are without precedent in post-mortem investigations. Thanks to this technique, aneurysms and sources of even small bleedings are visualized.
Our future investigations are aimed at defining precisely the advantages and the limitations of this technique in order to avoid all radiological misinterpretations of the angio-graphic examination. In addition, several important ques-tions must be answered before post-mortem angiography becomes accepted practice in court-ordered and other forensic investigations. One such question is the influence of the Angiofil® mixture on toxicological analysis. If there is no such influence, the time-consuming sample collection before the injection of the contrast agent could be eliminated, and the time to perform post-mortem angiogra-phy would be decreased considerably. Another important direction for future work is the improvement of the materials needed for this technique, in particular the modified perfusion machine, with the objective of further simplifying the procedure. Finally, we plan to investigate
other sites that femoral vessels as possible access points to the vascular system. This may be important in cases where the main vessels are ruptured and when it is important to visualize the vessels of the arm and leg. Our first attempt at using alternative perfusion sites proved successful. The additional preparation of the vessels of the neck made it possible to visualize the intracranial vessels in one of our cases (case 17) in the absence of femoral access because of an aortic rupture.
The protocol presented in this study makes it possible to perform high-quality post-mortem angiography in a stan-dardized way. It also considerably reduces the risk of misinterpretation in the radiological diagnosis made with post-mortem perfusion. The most important features of our protocol are the use of high perfusion volumes with the new contrast agent mixture Angiofil®, the recording of at least three angiographic phases, and a native CT scan. In all cases, the overall quality of the post-mortem investigation was enhanced, thanks to additional vascular diagnosis that could not have been performed by autopsy.
Acknowledgement This study was supported by the Promotion Agency for Innovation of the Swiss Confederation (KTI Nr.10221.1 PFIW-IW).
References
1. Thali M, Dirnhofer R, Vock P (2009) The virtopsy approach: 3D optical and radiological scanning and reconstruction in forensic medicine. CRC, New York
2. Scholing M, Saltzherr TP, Fung Kon Jin PHP et al (2009) The value of postmortem computed tomography as an alternative for autopsy in trauma victims: a systematic review. Eur Radiol 19:2333–2341
3. Grabherr S, Djonov V, Friess A et al (2006) Postmortem angiography after vascular perfusion with diesel oil and a lipophilic contrast agent. AJR 187:W515–W523
4. Grabherr S, Gygax E, Sollberger B et al (2008) Two-step post-mortem angiography with a modified heart–lung machine: preliminary results. AJR 190:345–351
5. Jackowski C, Thali M, Sonnenschein M et al (2005) Virtopsy: postmortem minimally invasive angiography using cross section techniques-implementation and preliminary results. J Forensic Sci 50:1175–1186
6. Ross S, Spendlove D, Bolliger S et al (2008) Postmortem whole-body CT angiography: evaluation of two contrast media solutions. AJR 190:1380–1389
7. Grabherr S, Djonov V, Yen K et al (2007) Postmortem angiography: review of former and current methods. AJR 188:832–838
8. Zapata MG, Alcaraz M, Luna A (1989) Study of postmortem blood circulation. Z Rechtsmed 103:27–32
9. Pfeifer KJ, Klein U, Chaussy CH et al (1974) Postmortale Nierenvergröβerungsangiographie mit fettlöslichem Kontrastmittel. Fortschr Röntegenstr 121:472–476
10. Nakakuma K, Tashiro S, Hiraoka T et al (1983) Studies on anticancer treatment with an oily anticancer drug injected into the ligated feeding hepatic artery for liver cancer. Cancer 52:2193– 2200
11. Grabherr S, Hess A, Karolczak M et al (2008) Angiofil-mediated visualization of the vascular system by microcomputed tomogra-phy: a feasibility study. Microsc Res Tech 71:551–556
12. Aghayev E, Thali MJ, Sonnenschein M et al (2007) Post-mortem tissue sampling using computed tomography guidance. Forensic Sci Int 166:199–203
13. Saigal R, Mittal M, Kansal A et al (2008) Fat embolism syndrome. J Assoc Physicians India 56:245–249