Table of contents
1 Abbreviations, tables and figures ... 7
1.1 List of abbreviations ... 7
1.2 List of tables... 8
1.3 List of figures ... 8
2 Introduction ... 10
2.1 Sea urchin (Paracentrotus lividus) ... 10
2.2 Embryology of the sea urchin ... 11
2.3 Cultivable bacteria isolated from sea urchins ... 12
3 Materials and methods ... 15
3.1 Marine Broth (MB) and Marine Agar (MA) ... 15
3.2 Strain’s plating ... 15
3.3 Strain’s cultivation in liquid medium ... 15
3.4 Extraction of biologically active molecules ... 15
3.4.1 Cell lysis ... 15
3.4.2 Extraction of lipophilic molecules ... 16
3.5 Strain Glycerol Stock (SGS) ... 16
3.6 Sea urchin fertilization... 16
3.7 P. lividus assays ... 17
3.8 Antimicrobial assays ... 17
3.9 Colony PCR – 16S rDNA analysis ... 18
3.9.1 PCR ... 18
3.9.2 PCR products purification ... 19
4 Results ... 20
4.1 Paracentrotus lividus embryo assays ... 20
4.2 Antimicrobial assays ... 23
4.3 16S rDNA colony PCR for strains identification ... 24
5 Discussion, conclusion and perspectives ... 27
6 Bibliography ... 29
7 Annexes ... 32
7.1 Summary of sea urchin’s experiments and results ... 32
7.1.1 Experiment of 05.06.2018 (week 23) ... 32
7.1.2 Experiment of 13.06.2018 (week 24) ... 32
7.1.3 Experiment of 19.06.2018 (week 25) ... 33
7.1.4 Results of the embryo assays ... 35
1 Abbreviations, tables and figures
1.1 List of abbreviations
Symbol Meaning
°C degree Celsius (temperature unit)
atm atmosphere (pression unit)
Ctrl Control
dH2O Distilled water
dil dilution
DNA/ rDNA/ gDNA DeoxyriboNucleic Acid/ ribosomal DNA/ genomic DNA h/ min/ sec hour/ minute/ second (time units)
hpf Hours post-fertilization
LB Lysogeny Broth or Luria-Bertani (culture medium)
MA Marine agar Mag. Magnification MB Marine broth MeOH Methanol MW Molecular weight ON Over night
PBS Phosphate Buffered Saline
PCR Polymerase Chain Reaction
R5A Bacterial culture media used for S. coelicolor RNA/ rRNA RiboNucleic Acid/ ribosomal RNA
rpm Round per minute
RT Room temperature
SB Sea Broth (culture medium)
SGS Strain glycerol stock
1.2 List of tables
Table 1: Reagents for PCR and their concentrations ... 18
Table 2: Primers used for the 16S rDNA PCR amplification ... 18
Table 3: 16S rDNA PCR conditions ... 18
Table 4: Optical density (OD) at 600 nm of the liquid cultures of E. coli and K. rizhophila... 23
Table 5: PCR product’s concentration after purification and sequencing result. ESP2 come from Isola delle Femmine (2017) and ESP3 come from sant’Erasmo (2017). V. jasicida and I. homiensis come from sant’Erasmo (2016) ... 26
Table 6: Obtained results of plate n°5 – V. jasicida... 35
Table 7: Obtained results of plate n°6 – I. homiensis ... 35
Table 8: Obtained results of plate n°7 – I. homiensis ... 36
Table 9: Obtained results of plate n°8 – I. homiensis ... 36
Table 10: Obtained results of plate n°9 – I. homiensis ... 36
Table 11: Obtained results of plate n°10 – I. homiensis ... 37
1.3 List of figures
Figure 1: The sea urchin P. lividus (aboral side) ... 10Figure 2: Opened female sea urchin with 5 red gonads and visible eggs ... 10
Figure 3: Opened male sea urchin with 5 orange gonads and visible sperm ... 10
Figure 4: The internal structure of P. lividus. The coelomic fluid in not shown on the image [9] ... 11
Figure 5: Simplified scheme depicting key developmental stages and early molecular activities regulating morphogenesis along the Dorsal/Ventral axis of the sea urchin embryo [15] ... 12
Figure 6: Sea urchin staging series [33] ... 14
Figure 7: Filtration system ... 16
Figure 8: Obtained embryo results for the bacterial strain Kocuria sp. ... 20
Figure 9: Obtained results of the bacterial strain Idiomarina sp. ... 21
Figure 10: Scheme of gastrula (24 hpf) and pluteus (48 hfp) embryos, in which are indicated the Animal/Vegetal, Dorsal/Aboral-Ventral/Oral and Left/Rigth axes [34]. ... 22
Figure 11: Obtained results of experiment 5 ... 22
Figure 12: The obtained result of the first antimicrobial assay. In soft agar, the strain K. rizhophila was plated. The strain V. jasicida in fact is Kocuria sp. ... 23
Figure 13: Obtained results of the second antimicrobial assay. ... 24
Figure 14: Agarose gel 1% - 16S rDNA colony PCR. ... 24
Figure 15: Agarose gel 1% - 16S rDNA colony PCR. ... 25
Figure 16: Agarose gel 1% - 16S rDNA colony PCR. ... 25
Figure 17: Agarose gel 1% - Purified 16S rDNA colony PCR product. ... 25
Figure 18: Agarose gel 1% - Purified 16S rDNA colony PCR product. ... 26
Figure 20: Phylogeny tree for the identification of the strain ESP2 2F3 ... 38
Figure 21: Phylogeny tree for the identification of the strain ESP3 1F3 white colony ... 38
Figure 22: Phylogeny tree for the identification of the strain ESP3 1F3 yellow colony ... 39
Figure 23: Phylogeny tree for the identification of the strain ESP3 2F2 ... 39
Figure 24: Phylogeny tree for the identification of the strain ESP3 4F1 white colony ... 39
Figure 25: Phylogeny tree for the identification of the strain ESP3 4F1 yellow colony ... 40
Figure 26: Phylogeny tree for the confirmation of a previous identification of the strain Idiomarina homiensis ... 40
Figure 27: Phylogeny tree for the confirmation of a previous identification of the strain Vibrio jasicida using the forward primer ... 41
Figure 28: Phylogeny tree for the confirmation of a previous identification of the strain Vibrio jasicida using the reverse primer ... 41
2 Introduction
The microbial communities have crucial roles in global climate regulation, human health and industrial biotechnology [1]. There are 100 million times as many bacteria in the oceans (13 × 1028) as there are stars in the known universe [2]. Some of these bacteria may produce biologically active molecules that could find an application in the biotechnological industry. For all these reasons it is really important to try to understand the role of all these microorganisms and analyze them. This work will focus on Paracentrotus lividus’s microbiota.
Many samples of sea urchins were isolated from two different regions in Sicily (Italy). The first were isolated near Isola delle Femmine, 38°12’00’’N 13°15’00’’E. The second were isolated near Palermo, in the district of sant’Erasmo 38°06'46.8"N 13°22'44.8"E. Isola delle Femmine is a natural reserve while sant’Erasmo is a polluted region due to human activity. The long term aim is the comparison of the microbiota coming from these two different locations to verify if there is an influence of the human activity. Metagenomics suggested that the microbiota coming from the polluted area may be able to degrade hydrocarbons like toluene or phenols, while the ones coming from the natural reserve cannot. These results were obtained with a predictive method (data not published yet).
2.1 Sea urchin (Paracentrotus lividus)
Paracentrotus lividus (Figure 1), commonly known as the sea urchin is appreciated for its taste.
Usually, the gonads (Figure 2 and Figure 3) are the edible parts. P. lividus is an Echinodermata that is also used in research laboratories for different studies, like the effect of the ocean acidification on the thickness and composition of the sea urchin’s test, the effect of the toxicity of personal care products or the effect of organic contaminants [3]–[6]. Studying the modifications in defense mechanism of the sea urchin might represent biological pollution indicators [7]. P. lividus is a good model organism for studying toxicology, physiology and biology. It has been used for more than a century for embryological studies because the embryos are easy to manipulate and analyze for morphological aberrations [8].
Figure 1: The sea urchin P. lividus (aboral side) Figure 2: Opened female sea urchin with 5 red gonads and visible eggs
Figure 3: Opened male sea urchin with 5 orange gonads
and visible sperm
The common sea urchin is usually brown, green or violet, as shown in Figure 1, but never black [9]. This feature distinguishes Paracentrotus lividus from Arbacia lixula. Its reproduction season is usually between February and July [9]. This information is crucial for the embryology research as well as any study that is to be done on embryos.
The operational sex ratio (OSR) - the number of sexually mature males divided by the total of sexually mature adults of both sexes at any time - of P. lividus might be affected by the starfish Marthasteria
The coelomic fluid contains cells implicated in the immune system of the animal. Coelomocytes were classified into red spherule and colorless spherule cells, small cells, vibratile cells, and phagocytic cells; petaloid and filopodial cells [11]. A 5 kDa peptide fraction of the cytosol from coelomocytes seems to have an antimicrobial effect on staphylococcal biofilms [12]. This fraction could be used as a new antimicrobial agent because staphylococcal biofilm-associated infections are resistant to conventional antibiotics.
It is also known that females possess more powerful immune response than males [13]. In fact, it was found that females possess a significant higher number of immunocytes consisting of phagocytes and uncolored spherulocytes. It was also found that acidic extract of female gonads had greater antimicrobial activity than male’s. The gender differences in the immune response are therefore not restricted to vertebrates [13]. When toxicological tests are to be made on P. lividus, the sex must be taken into consideration.
Figure 4: The internal structure of P. lividus. The coelomic fluid in not shown on the image [9]
2.2 Embryology of the sea urchin
Like most animals, sea urchins need an ovule (diameter of the egg around 100 µm) and a spermatozoid for fecundation. Males and females spawn in seawater and gametes meet by chance. Once an ovule, which is orange, is fertilized by a spermatozoid, which is white, an egg is formed. Around fertilized eggs, the vitelline layer becomes raised off the surface of the egg and hardens, forming a protective membrane to prevent other spermatozoids from entering in the zygote (Figure 6). All cleavages up to the blastula stage occur within this envelope. During first cleavage, the nuclear envelope breaks down, and the duplicated chromosomes separate into two complete sets, followed by cytokinesis. One hour after fecundation, the two identical cells (blastomeres) are formed. Cleavages will proceed synchronously, approximately every 30 minutes, passing through the morula stage (16-64 cells) when the cells are loosely attached to each other, up to the blastula stage (more than 128 cells). At a certain stage, a cavity appears in the cluster of cells, the embryo is at the early blastula stage. This stage is made up of a hollow ball of 1000 or so cells, arranged in a single-layered epithelium, as shown in Figure 5. The cells are tightly packed together, maintaining a space in the center called the blastocoel cavity. At the time of hatching, the embryo has cilia that allows it to get out of the fecundation membrane and swim, which is called a hatched blastula. One day after fecundation, the organism begins to be formed and the digestive tube appears. The mouth/anus axis
is visible and the calcareous endoskeleton of the larvae appears. At the beginning of gastrulation, a number of cells in the flattened vegetal pole move as individual cells into the blastocoel cavity. In this cavity the cells migrate around, fuse with each other in a ring, and begin secreting elements of the calcium carbonate skeleton of the embryo. Because these cells are the first to move as individual cells in the embryo, they are called the primary mesenchyme cells (PMCs). The remaining cells in the vegetal pole fill in the gaps, restoring a complete epithelial sheet. While the PMCs are migrating around, archenteron formation, or formation of the embryonic digestive tract, begins. The first stage involves the pushing in of the vegetal pole to form a short, wide, blind-ended tube. This tube then narrows and elongates by a process that includes extensive cell rearrangement. Following this elongation, a subset of cells (secondary mesenchyme cells) at the tip of the archenteron will extend processes that contact a specific site on the inside of the ectodermal wall and tow the archenteron toward that spot. The cells continue to proliferate, move and differentiate during the development of the individual. The wall of the ectoderm will bend inward and fuse with the tip of the archenteron to form the mouth. The digestive tract will differentiate into an esophagus, a stomach, and an intestine. When the cells have developed into a Pluteus larvae, the organism can eat microscopic algae. The mouth anus axis is therefore materialized by a functional digestive tube. The larva continues its development with plankton during several weeks (approximatively 3 to 4 weeks). By the end of the larval development, a group of cells differentiates rapidly into a little sea urchin of approximatively 1 mm of diameter [14]. The survivors who are brought by the current to the shore at the time of their metamorphosis will be able to finish their development until the adult stage.
Figure 5: Simplified scheme depicting key developmental stages and early molecular activities regulating morphogenesis along the Dorsal/Ventral axis of the sea urchin embryo [15]
2.3 Cultivable bacteria isolated from sea urchins
The aim of this work is to analyze the microbiota of Paracentrotus lividus. The first test consists in the analysis of the effect of bacterial extracts on the embryology of the sea urchin Paracentrotus lividus. The second analysis is to test if these bacteria produce antimicrobial substances that may prevent the growth of other bacterial strains. The last part was the identification of the unidentified cultivable strains. Nowadays, DNA sequencing and sequence alignment have been widely applied and accepted as methods of bacterial detection and identification. Phylogenetic analysis of bacteria can be based on their 16S DNA sequences [16]. This method was used during this work to identify the cultivable bacteria isolated from P. lividus, the 16S rDNA sequencing method is used.
Eight cultivable strains isolated from the coelomic fluid of the animal (sant’Erasmo, 2016) were identified: Alteromonas sp., Halomonas sp., Idiomarina homiensis, Loktanella sp., Pseudoalteromonas
pisicida, Pseudoalteromonas rubra, Vibrio jasicida and Vibrio owensii.
Both strains of Pseudoalteromonas are known to produce low molecular weight biologically active molecules and a measure of oil displacement showed an activity of surfactants [17]. Furthermore,
molecules from the family of prodigiosin and its congeners were isolated and showed cytotoxicity against human cancer cells and immunosuppressive activities [18]–[20]. Halomonas meridian and
Idiomarina loihiensis also produce cytotoxic molecules against one or more cancer cell lines with cell
line specific activities [21]. P. rubra is known for producing molecules causing mortality in early stage larvae of captive-bred Japanese eels [22]. P. pisicida and P. rubra also produce antibiotics efficient on
Bacillus cereus, Bacillus subtilis and Halcyon smyrnensis [23]. Alteromonas sp. may produce
biologically active molecules. This strain is already known for producing enzyme inhibitors [24]. It was also found that Halomonas sp. produce bioactive molecules with cytotoxic and apoptotic effects on 3 human cell lines (HeLa, MCF-7 and DU145) [25]. The strain V. owensii seems to produce bioactive molecules like antimicrobials [26]. V. owensii is also be implicated in the acute hepatopancreatic necrosis disease (AHPND) in shrimps [27], [28].
Some bacterial strains were isolated and identified from female sea urchin’s gonads. These bacteria were around the eggs. One of these strains is Bacillus sp. that is already to known to produce bioactive molecules. Lipopeptides isolated from this strain showed an antimicrobial activity against
Rhizoctonia solani and Sclerotinia sclerotiorum [29]. These two fungi cause diseases in plants. A cyclic
dipeptide was also isolated from Bacillus sp. and showed an antimicrobial activity against
Staphylococcus epidermis and Proteus mirabilis [30]. Another strain, Psychrobacter sp., produces
bioactive molecules that prevent bacterial biofilm formation [31]. A similar strain to Paracoccus sp. produces molecules against some pathogens and is also effective on multidrug resistant organisms [32].
The aim of this work is to identify the cultivable bacteria isolated from coelomic fluid and from eggs using the 16S rDNA sequencing method. Some of the isolated strains were tested to determine if they produce antimicrobial molecules. Finally, the bacteria and different extracts were used on sea urchin’s embryos to determine their effect on the embryological development.
3 Materials and methods
3.1 Marine Broth (MB) and Marine Agar (MA)
The Marine Broth is used to cultivate microorganisms living in the sea. A volume of 1.0 L of dH2O is
added to 40.20 g (balance BC1500, ORMA, n°33888) of Marine Broth (Conda proadisa, n°1217.00). The powder is dissolved by stirring then is boiled 1 minute in the microwave (Electrolux M8, n°EMS21400S) until complete dissolution. The medium is then autoclaved at 121°C, 1 atm during 20 minutes (autoclave Carlo Erba, n°5991). The medium is kept at RT until use.
To prepare Marine Agar, a solid medium, 1.5% (w/v) of agar (USB Corporation Cleveland, OH USA, n°J10907) are added to the medium. The mix is autoclaved. Petri dishes are then filled with the medium and left for solidification under biological laminar flow with UV light during approximatively 15 minutes. The plates are kept at 4°C until use.
Both mediums may present precipitates.
3.2 Strain’s plating
A volume of 50 µL of strain glycerol stock (SGS) was plated on MA under a biological laminar flow to prevent contaminations. The plates were incubated at 30°C or at room temperature (RT). The bacteria were plated on new plates until having single isolated colonies.
3.3 Strain’s cultivation in liquid medium
A volume of 5 mL of the liquid medium are filled in sterile test tubes under a biological laminar flow. A volume of 5 µL of SGS is added to the medium or 1 colony of agar plates. From solid medium, colonies are picked with sterile toothpicks and dropped in the medium. Incubation is done at the adequate temperature for the strain and agitated at 200 rpm.
3.4 Extraction of biologically active molecules
Two methods were used for the extraction of bioactive molecules. The first is the cell lysate (hydrophilic molecules) and the second is a methanolic extraction from the pellets after the cell lysis (lipophilic molecules).
3.4.1 Cell lysis
Two methods were used for the cell lysis, the first is the sonication and the second is an alkaline lysis.
3.4.1.1 Cell lysis with sonication
A volume of 2 mL of the liquid culture is pipetted in a 2 mL sterile tube under a biological laminar flow. The tube is centrifuged (Beckman Coulter, Microfuge®22R Centrifuge, F241.5P Rotor) at 12’000 rpm (10’870 x g) during 5 min at 4°C. The supernatant is stored at -20°C until use and the pellet is washed twice with 500 µL of sterile PBS and centrifuged with the same conditions as described previously. The pellet is resuspended in 500 µL of sterile PBS and sonicated on ice during 15 sec, 9 volts. The tube is kept on ice during 10 sec. The sonication is done 4 times. The tube is centrifuged again. The supernatant is pipetted in a new tube and both tubes are stored at -20°C until use.
3.4.1.2 Alkaline cell lysis
A volume of 2 mL of the liquid culture is pipetted in a 2 mL sterile tube under a biological laminar flow. The tube is centrifuged (Beckman Coulter, Microfuge®22R Centrifuge, F241.5P Rotor) at 12’000
rpm (10’870 x g) during 5 min at 4°C. The supernatant is stored at -20°C until use and the pellet is washed twice with 500 µL of sterile dH2O or MilliQ water and centrifuged with the same conditions
as described previously. The pellet is resuspended in 500 µL of 1M KOH. If needed, vortex the sample until complete dissolution of the pellet. The sample is incubated 5 min at RT. The tube is centrifuged again. The supernatant is pipetted in a new tube and both tubes are stored at -20°C until use.
3.4.2 Extraction of lipophilic molecules
After the cell’s lysis, the pellets are used for the extraction of lipophilic molecules. The pellets after alkaline lysis are washed twice with PBS. The tubes are centrifuged (Beckman Coulter, Microfuge®22R Centrifuge, F241.5P Rotor) at 12’000 rpm (10’870 x g) during 5 min at 4°C. The supernatant is discarded.
The pellet is resuspended in 1.0 mL of 0.5 M HCl with methanol (Sigma-Aldrich, n°32213) and incubated at RT ON with agitation. The samples are then centrifuged (Beckman Coulter, Microfuge®22R Centrifuge, F241.5P Rotor) at 12’000 rpm (10’870 x g) during 5 min at 4°C. The supernatant is transferred in a new tube and both pellet and supernatant are stored at -20°C until use.
3.5 Strain Glycerol Stock (SGS)
For the storage of the bacterial strains from liquid cultures, 1:1 (v/v) of liquid culture medium and glycerol 40% are pipetted together to obtain a final concentration of 20% of glycerol. The tubes are stored at -20°C until use.
3.6 Sea urchin fertilization
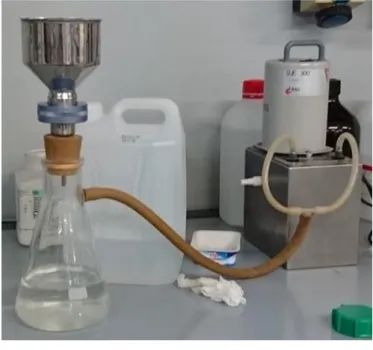
The sea urchin samples used for this thesis were bought from a fisherman from the coastal region of Palermo, from the coast of women’s island (Isola delle Femmine, 38°12’00’’N and 13°15’00’’E), during the months of May and June 2018. Sea water was also collected at the same place. The sea urchin samples are put in a container with paper humidified with sea water and were stored in a cold room (4°C) in the laboratory. The sea water was filtered with paper filter (Extacta Optech, n°G01526/A2L) then at 0.3 µm (PH Millipore filter, n°HAWP04700) as shown in Figure 7 and stored at 4°C.
Figure 7: Filtration system
The sea urchins are opened near the mouth from the peristomial membrane with scissors in a circular way. The organs are removed to have a better view on the gonads. Female gonads are put in a beaker filled with sea water and male gonads are put in an empty 15 mL falcon tube then stored on ice. When needed, 1 drop of sperm is added to 10 mL of sea water to activate the spermatozoids. The quality of the eggs is checked under microscope and a fertilization trial is done on a microscope slide. If a fertilization membrane appears around the eggs, then the fertilization in vitro is successful. The female gonads are filtered with organza and washed two times with sea water. For washing the eggs, they are placed in 40 mL of sea water and left for few minutes until sedimentation. Sea water is then aspirated without taking the eggs and then the beaker is filled again with 40 mL of sea water. The operation is done twice. After washing the eggs, a sample of sperm is diluted in 10 mL of sea water. Some drops are then added to the eggs. A sample is observed under microscope to check if fertilization is done.
3.7 P. lividus assays
Twenty-four well plates (Biofil, TCP 011024) are filled with 1 mL of sea water. The test compounds are then added in the wells and finally, between 150 and 300 sea urchin embryos are added in each well. The plates are incubated at 18°C. The development of the embryos is checked under microscope and stereo microscope.
According to the number of hours post fertilization, the embryos should be at a certain stage. To analyze the effect of the tested substances, the embryos are counted and classified in normal and abnormal stage. For counting embryos, 1 drop of 40% (m/v) filtered formaldehyde (Carlo Erba reagent, n° 2G702152G) is added to the well. With a micropipette, the embryos are mixed and after few seconds, they stop swimming. After embryos sedimentation, they are collected in approximatively 60 µL and put on a microscope slide. To create a counting chamber, the corners of the coverslip are embedded in plasticine. The coverslip is then put gently on the sample and the embryos are counted under microscope.
3.8 Antimicrobial assays
A volume of 20 µL of the SGS of the bacterial strains isolated from sea urchins is put in 2 mL of liquid MB and incubated ON at 30°C, 180 rpm. A volume of 20 µL of the liquid culture is spotted on a MA petri dish. The plates are stored at 30°C ON.
A volume of 20 µL of the SGS of two tester strains (E. coli DH10B and K. rizhophila) is pipetted in 2 mL of liquid LB at 37°C, 200 rpm ON for the bacterial growth.
In parallel, soft agar with LB is prepared and autoclaved. The tester strains OD at 600 nm is measured and according to the result a certain volume of the bacterial culture (for 1 OD pipet 100 µL) is added to 6 mL of soft agar. The soft agar with bacteria is mixed gently then added to the plates with spotted strains. After incubation at 37°C ON the growth of the testers is checked.
A different method of antimicrobial assay was used to determine if the strains isolated from the sea urchins have an influence on each other’s growth. A first strain is plated on a half pf a MA petri dish. After 24 or 48h of incubation at 30°C, the other strains are plated on the petri dish. After 24h of incubation at 30°C, the growth of the strains is checked to see if there’s an influence of the first strain on the development of the following ones.
3.9 Colony PCR – 16S rDNA analysis
3.9.1 PCR
To confirm and identify the strains of the used bacteria during this work, a colony PCR is done. One colony is picked from agar plate and put in 25 µL of TE buffer pH 8.0 (10 mM Tris.Cl, Sigma, n°T1503, 1 mM EDTA, AppliChem, n°A1103). Boil 5 min at 100°C then put on ice for 5 min. Use 1 µL for the PCR. A master mix is prepared for the number of the samples as described in Table 1.
Table 1: Reagents for PCR and their concentrations
Reagents Stock concentration Final concentration Volume for 1 sample [µL] PCR Rxn Buffer (Invitrogen, n°10342020) 10x 1x 2.5 MgCl2 (Invitrogen, n°10342020) 50 mM 1.5 mM 0.75 dNTPs (Invitrogen, 100 mM dNTP Set, n°10297-018) 10 mM 0.2 mM 0.5
Primer forward (Table 2) 10 µM 0.2 µM 0.5
Primer reverse (Table 2) 10 µM 0.2 µM 0.5
Taq DNA Polymerase
(Invitrogen, n°10342020) 5 U/µL 0.04 U/µL 0.2
H2O (Gibco) - - 19.05
For the 16S rDNA analysis, the PCR are to be done with the primers described in Table 2. The amplification conditions are described in Table 3.
Table 2: Primers used for the 16S rDNA PCR amplification
Name Number Sequence Supplier
1492r 50430X14E07 1/16 5’-TAC GGY TAC CTT GTT ACG ACT T-3’ metabion 27F 50430X14E08 2/16 5’-AGA GTT TGA TCM TGG CTC AG-3’ metabion In Table 2, the letter M in the primer’s sequence stands for Amino which means that it could be an A or a C. The letter Y stands for Pyrimidine which means it could be a C or a T.
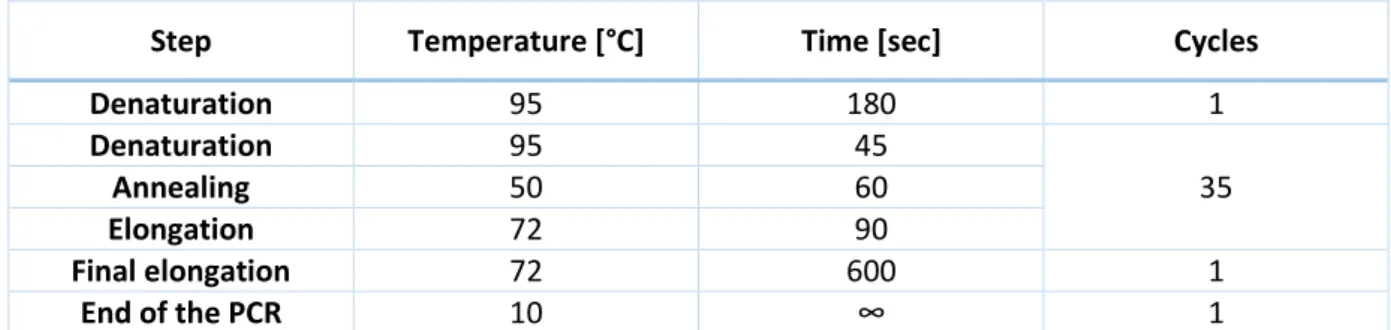
Table 3: 16S rDNA PCR conditions
Step Temperature [°C] Time [sec] Cycles
Denaturation 95 180 1 Denaturation 95 45 35 Annealing 50 60 Elongation 72 90 Final elongation 72 600 1 End of the PCR 10 ∞ 1
After the PCR, the samples are loaded on a 1% agarose (EURX, n°E0301) gel (0.6 g of agarose in 60 mL of TAE 1x) with 1.5 µL of ethidium bomide (Sigma, n°46067) for electrophoresis to check if the PCR worked. The TAE 1x is diluted from TAE 50x (242 g of Trizma, 57.1 mL of acetic acid and 100 mL of 0.5 M EDTA pH 8).
A volume of 2 µL of the sample is loaded on the agarose gel with 3.4 µL of H2O and 0.6 µL of loading
buffer (Invitrogen, 10x BlueJuiceTM Gel Loading Buffer, n°10816015). A volume of 4 µL of MW marker (Roche, DNA Molecular Weight Marker II, n°10 236 250 001) is also loaded on the gel.
3.9.2 PCR products purification
Before sending the PCR products for sequencing they must be purified to get rid of the PCR reagents. The purification is done with a commercial kit (Invitrogen, PureLinkTM Quick Gel Extraction & PCR Purification Combo Kit, n°K220001). The samples are eluted in 50 µL of elution buffer or sterile water.
After the purification, the samples are checked on an agarose gel as described in section 3.9.1 and DNA quantification was done by nanodrop (NanoDrop® Spectrophotometer ND-1000). The amount of DNA and primers is prepared according to the instructions of the company BMR Genomics, Padova. Dry the samples at 65°C during approximately 1h. The samples are stored at -20°C until the shipment to the sequencing company (BMR Genomics, Padova).
4 Results
4.1 Paracentrotus lividus embryo assays
Different bacterial strains from coelomic fluid or eggs of sea urchins were collected and stored in SGS. Some of these bacteria were plated on MA petri dishes then used for the inoculation of MB. After the liquid cultures, a part of it was stored with glycerol at -20°C. The spent media was stored and the bacterial pellet was used for cell lysis (sonication or with KOH) for the extraction of lipophilic molecules and the cell lysate pellet was used for the extraction of lipophilic molecules with MeOH. The detailed method is described in sections 3.2, 3.3, 3.4 and 3.5. Most of the strains grew but only 2 of them were used for the embryo assays: Idiomarina sp. and Vibrio sp. (a 16S rDNA analysis showed that in fact this strain was a Kocuria sp., see section 4.3). Both strains come from the coelomic fluid of sea urchins isolated from sant’Erasmo (polluted region in Sicily) in 2016. The assays were performed on embryos of sea urchins collected from a natural reserve (Isola delle Femmine). The fecundations were performed in the laboratory then the tested reagents were added on the embryos. To analyze the effect of the different fractions, the embryos were observed under microscope and counted. The obtained results are shown in Figure 8 and Figure 9. According to professor Cavalieri, only a difference of at least 20% means that the treatment has a significant effect on the embryos.
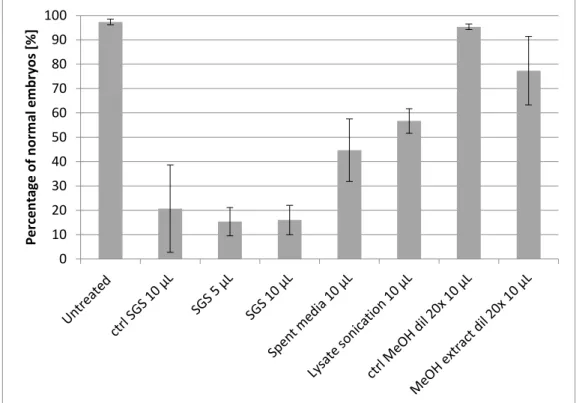
Figure 8: Obtained embryo results for the bacterial strain Kocuria sp.
Each treatment was done in triplicates.
In Figure 8, it can be observed that in the untreated wells almost 100% of the embryos are normal. An effect of the bacteria could not be evaluated in this experiment because there isn’t 20% of difference with its control (SGS). It seems that the MB with glycerol has a negative effect on the development of the embryos. The spent media and the cell lysate results can’t be used because no negative controls were performed during this experiment. Furthermore, results of other experiments suggested that the MB and the PBS may have an effect on the embryological development. Concerning the methanolic extracts, the result doesn’t show a clear effect on the embryos. Further experiments should be done to confirm or exclude the presence of a biologically active molecule in this methanolic extract.
0 10 20 30 40 50 60 70 80 90 100 Pe rc e n tage o f n o rm al e m b ry o s [% ]
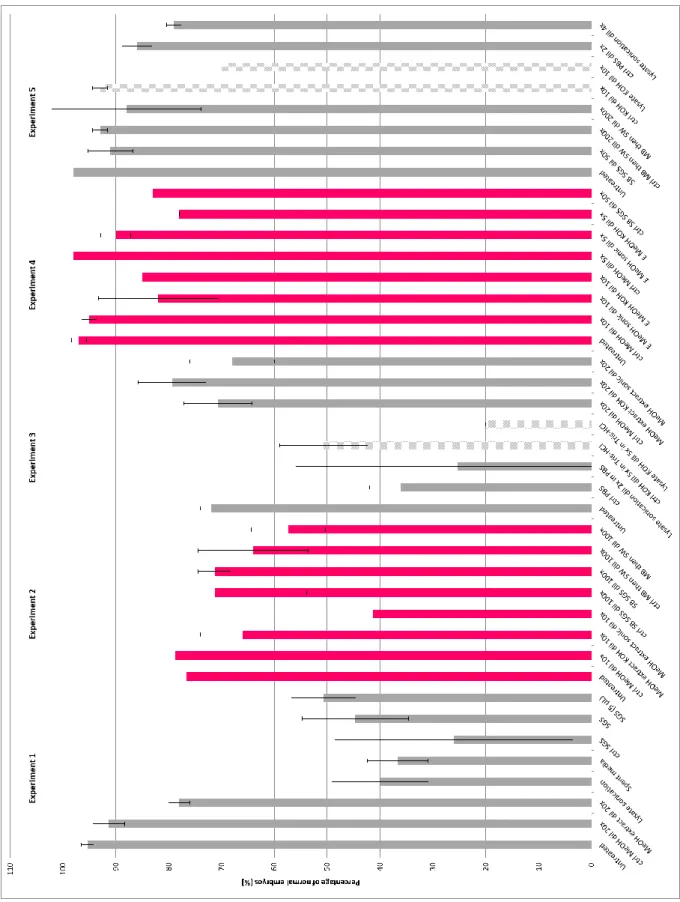
Figure 9: Obtained results of the bacterial strain Idiomarina sp.
The colors are used to separate the experiments. The tested fractions in experiments 1, 2 and 3 were done in triplicates and in experiments 4 and 5 were done in duplicates. The hatched results are significant (more than 20% of difference comparing to their control).
Concerning the strain Idiomarina sp., the obtained results are shown in Figure 9. Different couples of sea urchins were used to perform the experiments, except experiments 4 and 5, the embryos come from the same couple. The results of the first experiment suggest that the tested fractions don’t have an effect on the embryological development. The second experiment suggest that the methanolic
extract on the cell lysate pellet after sonication diluted 10 times may have an effect on the development of the embryos. The results of the experiment 3 suggest that the cell lysate with KOH may contain a biologically active molecule that has an effect on the embryos. The results of experiment 4 suggest that the methanolic extracts don’t have an effect on the embryos. Finally, the experiment 5 confirms that the cell lysate with KOH has an effect on the embryos. Observations under stereo microscope showed that the embryos of experiment 3 treated with cell lysate with KOH diluted 5 times were dead or weren’t swimming. The few swimming embryos turned around their own axis. Furthermore, the embryos treated with ctrl KOH diluted 5 times 48 hpf were at the pluteus stage while a lot of embryos treated with the cell lysate KOH diluted 5 times were delayed (most of them at the gastrula stage). The same results were observed in the last experiment even though the cell lysate were diluted 10 times.
Figure 10: Scheme of gastrula (24 hpf) and pluteus (48 hfp) embryos, in which are indicated the Animal/Vegetal, Dorsal/Aboral-Ventral/Oral and Left/Rigth axes [34].
The plutei length is around 430 µm [35]. Scale bars are not shown on the figures; the used software doesn’t give scale bars.
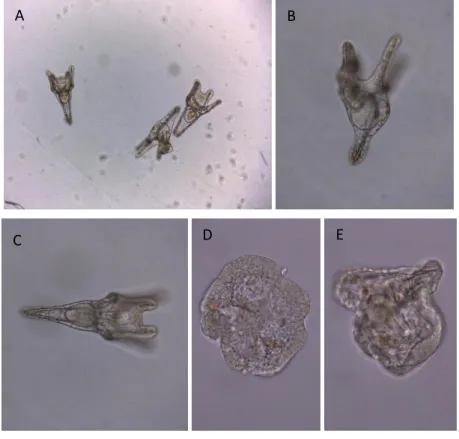
Figure 11: Obtained results of experiment 5
A (mag. 10x) and B (mag. 20x): Normal embryos at pluteus stage treated with ctrl KOH dil 10x. C (mag. 20x), D (mag. 40x) and E (mag. 40x): Embryos at pluteus stage treated with cell lysate KOH dil 10x. Embryos D and E are abnormal.
A B
As shown in Figure 11, the embryos in the ctrl well of KOH dil 10x seem to have a normal development. Some normal embryos were found in the treated wells with the cell lysate with KOH dil 10x but most of the embryos were delayed and/or abnormal. The two abnormal embryos are at the early pluteus stage with abnormal skeleton patterns and multiple spicules. Both contain pigment cells.
4.2 Antimicrobial assays
Two different antimicrobial assays were performed. The first consisted of spotting 20 µL of bacterial liquid cultures (in 2 mL of MB, ESP2 2F1 and Kocuria sp.) on MA plates. After 24h of incubation at 30°C, 6 mL of soft agar containing E. coli or K. rizhophila were added on the plates and incubated ON at 37°C.
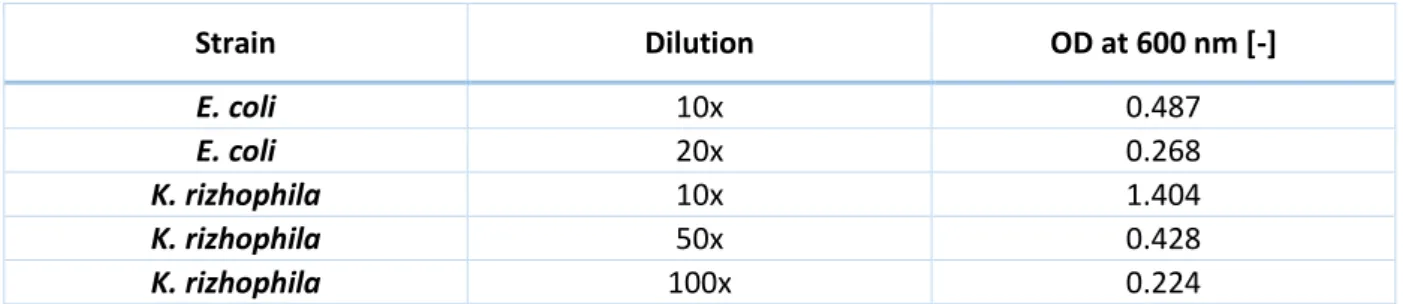
For the soft agar preparation, 20 µL of the liquid culture of E. coli were added to 6 mL of soft agar. For K. rizhophila, 5.0 µL were added to the soft agar. These volumes were chosen according to Table 4. Approximatively 100 OD of bacteria were added to 6 mL of soft agar.
Table 4: Optical density (OD) at 600 nm of the liquid cultures of E. coli and K. rizhophila
Strain Dilution OD at 600 nm [-] E. coli 10x 0.487 E. coli 20x 0.268 K. rizhophila 10x 1.404 K. rizhophila 50x 0.428 K. rizhophila 100x 0.224
To obtain the real OD, the OD in Table 4 must be mutilplied by the dilution factor.
The obtained result for the effect on the strain K. rizhophila is shown in Figure 12. There’s no observable halos around any spotted bacteria. In that culture conditions, no molecules with an effect on K. rizhophila were produced. With E. coli, the obtained result was similar to the one shown in Figure 12 (data not shown).
Figure 12: The obtained result of the first antimicrobial assay. In soft agar, the strain K. rizhophila was plated. The strain
V. jasicida in fact is Kocuria sp.
The second antimicrobial assay consisted in plating a first strain and waiting 24h or 48h before plating the other strains. The aim of this test is to determine of the first strain produces molecules that could inhibit the growth of the other strains.
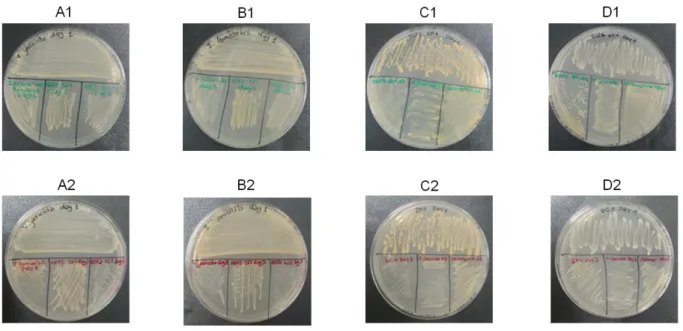
Figure 13: Obtained results of the second antimicrobial assay.
A: Kocuria sp. instead of V. jasicida B: I. homiensis C: ESP2 2F1 D: ESP3 6C1 – Series 1: Plating of the other strains 24h after the first one. Series 2: Plating of the other strains 48h after the first one.
The obtained results are shown in Figure 13. All the strains plated in a second time grew normally. This suggests that there’s no influence in that cultivation conditions of biologically active molecules on the different tested strains.
4.3 16S rDNA colony PCR for strains identification
Before sending the samples for the sequencing, a colony PCR for the amplification of the 16S rDNA was done. The PCR products were loaded on a 1% agarose gel with ethidium bromide for verification of the amplification. The obtained results are shown in Figure 14, Figure 15 and Figure 16. In all figures, the negative control was negative which confirms that the reagents used for the PCR were not contaminated. As positive control, gDNA was used for all the PCR. In all figures, it can be observed that the positive control was positive. This indicates that the PCR worked. The PCR products should be around 1’465 bp.
In Figure 14 it can be observed that the PCR didn’t work for V. jasicida (lane 6). The PCR was repeated for this strain and the obtained result is shown in Figure 15.
Figure 14: Agarose gel 1% - 16S rDNA colony PCR.
1: DNA ladder (DNA Molecular Weight Marker II,), 2: negative ctrl, 3: positive ctrl (gDNA of Streptomyces cyaneogriseus), 4: ESP2 14C, 5: ESP3 6C1, 6: V. jasicida, 7: I. homiensis, 8: ESP2 2F1
Figure 15: Agarose gel 1% - 16S rDNA colony PCR.
1: DNA ladder (DNA Molecular Weight Marker II,), 2: negative ctrl, 3: positive ctrl (gDNA of Streptomyces coelicolor M145), 4: V. jasicida
In Figure 16, the results of the PCR are shown for other strains. The SGS of ESP3 1F3 and ESP3 4F1 are contaminated. Yellow and white colonies were found so they were separated on solid medium. To identify which colony belongs to the sea urchin and which one is the contamination, a 16S rDNA identification was done.
Figure 16: Agarose gel 1% - 16S rDNA colony PCR.
1: DNA ladder (DNA Molecular Weight Marker II,), 2: negative ctrl, 3: positive ctrl (gDNA of Streptomyces coelicolor M145), 4: ESP2 2F3, 5: ESP3 2F2, 6: ESP3 1F3 (white colony), 7: ESP3 1F3 (yellow colony), 8: ESP3 4F1 (white colony), 9: ESP3 4F1 (yellow colony)
After the PCR, the products were purified using a commercial kit as described in section 3.9.2. The obtained results are shown in Figure 17 and Figure 18. The intensity of the bands is lower than the previous gels. This is due to the volume of elution buffer or water used for the elution of the purified PCR products from the column. The PCR was done in 25 µL and the samples were eluted after purification in 50 µL and the same out of both was loaded on the agarose gels.
Figure 17: Agarose gel 1% - Purified 16S rDNA colony PCR product.
Figure 18: Agarose gel 1% - Purified 16S rDNA colony PCR product.
1: DNA ladder (DNA Molecular Weight Marker II,), 2: negative ctrl, 3: positive ctrl (gDNA of Streptomyces cyaneogriseus), 4: ESP2 2F3, 5: ESP3 2F2, 6: ESP3 1F3 (white colony), 7: ESP3 1F3 (yellow colony), 8: ESP3 4F1 (white colony), 9: ESP3 4F1 (yellow colony)
The DNA concentration was also measured using a nanodrop and the obtained results are shown in Table 5. The ratio 260/280 should be between 1.8 and 2.0. If the result is lower than 1.8 it indicates a potential contamination by proteins and if it’s higher than 2.0 it shows a contamination by RNA. The ratio 260/230 should be higher than 1.5. If not, it indicates that the sample may be contaminated by organic compounds (like phenol or ethanol used for the DNA purification). For the phylogeny trees see section 7.2.
Table 5: PCR product’s concentration after purification and sequencing result. ESP2 come from Isola delle Femmine (2017) and ESP3 come from sant’Erasmo (2017). V. jasicida and I. homiensis come from sant’Erasmo (2016)
Sample DNA [ngµL-1] Ratio 260/280 [-] Ratio 260/230 [-] 16S rDNA identification result ESP2 2F1 18.8 1.61 1.51 Bacillus sp.
Vibrio jasicida 24.3 1.73 1.70 Kocuria sp.
Idiomarina homiensis 23.5 1.69 1.94 Idiomarina sp.
ESP2 2F3 10.5 2.02 2.40 Labrenzia sp.
ESP3 2F2 26.9 1.88 2.07 Kocuria sp.
ESP3 1F3 white colony 26.0 1.94 2.21 Staphylococcus sp.
ESP3 1F3 yellow colony 15.0 2.08 2.06 Paracoccus sp.
ESP3 4F1 white colony 27.1 1.79 1.99 Staphylococcus sp.
ESP3 4F1 yellow colony 21.9 1.81 2.07 Paracoccus sp.
In Table 5, the ratio 260/280 indicated that some samples may be contaminated by proteins. This could be due to the colony PCR. The DNA wasn’t extracted before the PCR. Concerning the ratio 260/230, all the samples seem to be free of organic compounds.
Both SGS of the ESP3 1F3 and ESP3 4F1 are contaminated. Two different types of colonies were visible. To identify the marine organism from the contamination the 16S rDNA analysis was performed. The results suggest that the contamination may be Staphylococcus sp.
5 Discussion, conclusion and perspectives
Many bacteria coming from the coelomic fluid or the eggs of the sea urchins were isolated and identified. All these bacteria may have a surmising role in the embryological development of P.
lividus. The results of the embryological assays are promising and more assays should be done to
complete the obtained results.
The results of the embryo assays suggest that in this experimental conditions, only one fraction coming from Idiomarina sp. have an effect on the embryological development of Paracentrotus
lividus. This fraction is the cell lysate with KOH. This fraction induced an abnormal development of
the embryos with abnormal skeleton patterns. Further experiments should be done to isolate and identify the biologically active molecule responsible of this response. Additionally, the mRNA profiles of a pool of genes that are involved in stress response and in development mechanisms, for example the transcription factors Pl-NFkB and Pl-FOXO; a marker of DNA repair, Pl-XPB/ERCC3; a mitogen-activated protein kinase (MAPK), Pl-p38; an ER stress gene, Pl-grp78; an adapter protein, Pl-14-3-3ε; two markers of pigment cells, Pl-PKS1 and Pl-gcm could be analyzed to determine if some of these pathways are activated [36].
The other results of these experiments cannot be used due to several reasons. For example, the cell lysate after sonication and the spent media of the bacterial strains were tested without negative controls. Other experiments showed that the MB and the PBS have negative effects on the embryological development.
Further analysis should have been done before the embryological assays like counting the number of bacteria or verify if the cell lysis worked or if the methanolic extractions worked. Few information about the samples preparation are known concerning their composition (number of bacteria, protein’s concentration, etc.) so it will be impossible to repeat the experiment in the same conditions. The standardization of the method could also help improve the accuracy of the assay’s results. Many measures could be taken to improve the repeatability and the reproducibility of these assays, like the increase of the number of replicates or the minimization of the differences between the experimental conditions. Some molecules could have an effect at different stages of the embryological development so counting the embryos at the same stage of development could help improve the results.
Concerning the antimicrobial assays, the results showed that in the tested conditions, the bacteria don’t seem to produce biologically active molecules that have an effect on the growth of the other strains. This confirms the obtained results in a previous bachelor thesis [9]. Nevertheless, positive controls should be done to confirm the efficiency of the used methods.
The 16S rDNA analysis allowed the identification of the bacterial strains isolated from the coelomic fluid or the eggs of P. lividus. Concerning the result of the strain V. jasicida that seems to be Kocuria
sp., the sequencing should be done again to confirm the obtained result. Genus specific primers
could be used to obtain a more specific result. For all the bacterial strains, a cultivation method could be used to confirm the obtained results like the Api galleries.
In general, the bacterial strains isolated from sea urchins were stored for few years (1-3 years) in the laboratory at -20°C or -80°C. Some of these strains didn’t grow again. It could be helpful to do fresh cultures and store them again to minimize the risk of losing these precious samples.
In conclusion, the obtained results of the embryo assays are promising. Ameliorations could be done to improve the quality of the results, the repeatability and the reproducibility. Due to the amount of bacteria to analyze, a screening per type of extract or material could be done to help the comparison between the results of different bacterial strains. For example, it would be interesting to test all the SGS of the bacteria then the spent, etc. A first step with the counting of the normal vs. abnormal or
delayed embryos helps making a rapid screening. If a result is interesting, the assay could be repeated with the interesting fraction and the morphology of the embryos could be studied more in details and at different developmental stages.
For the antimicrobial assays, it would be interesting to try a cell culture in coelomic fluid (natural environment) then do antimicrobial assays. The natural environment may induce the production of antimicrobial molecules that helps the regulation and maintain the equilibrium for the survival of all the strains.
As suggested in the metagenomics analysis, there are some differences between the species living in the sea urchins isolated from the natural reserve or the polluted region in Sicily. It would be interesting to identify and compare these strains with the uncultivable method. The metgenomics analysis also suggested that the bacteria isolated from the sea urchins coming from the polluted area are capable of degrading some organic molecules. This result could be confirmed by PCR or cultivation media. All these assays could help improve the knowledge about the sea urchin’s microbiota.
6 Bibliography
[1] S. Widder et al., “Challenges in microbial ecology: building predictive understanding of community function and dynamics,” Isme J., vol. 10, no. 11, pp. 2557–2568, Nov. 2016.
[2] “Microbiology by numbers,” Nat. Rev. Microbiol., vol. 9, no. 9, p. 628, Sep. 2011.
[3] V. Asnaghi, L. Mangialajo, J.-P. Gattuso, P. Francour, D. Privitera, and M. Chiantore, “Effects of ocean acidification and diet on thickness and carbonate elemental composition of the test of juvenile sea urchins,” Sens. Mar. Environ. Using Differ. Anim. Models Levels Complex., vol. 93, pp. 78–84, Feb. 2014.
[4] L. Morroni, A. Pinsino, D. Pellegrini, F. Regoli, and V. Matranga, “Development of a new integrative toxicity index based on an improvement of the sea urchin embryo toxicity test,” 6th
Biannu. Ecotoxicol. Meet. BECOME 2014 - Environ. Emergencies Ecotoxicol. Manag. Tool, vol.
123, pp. 2–7, Jan. 2016.
[5] T. Torres, I. Cunha, R. Martins, and M. M. Santos, “Screening the Toxicity of Selected Personal Care Products Using Embryo Bioassays: 4-MBC, Propylparaben and Triclocarban,” Int. J. Mol.
Sci., vol. 17, no. 10, p. 1762, Oct. 2016.
[6] T. Tato, N. Salgueiro-González, V. M. León, S. González, and R. Beiras, “Ecotoxicological evaluation of the risk posed by bisphenol A, triclosan, and 4-nonylphenol in coastal waters using early life stages of marine organisms (Isochrysis galbana, Mytilus galloprovincialis,
Paracentrotus lividus, and Acartia clausi),” Environ. Pollut., vol. 232, pp. 173–182, Jan. 2018.
[7] L. Stabili and P. Pagliara, “The sea urchin Paracentrotus lividus immunological response to chemical pollution exposure: The case of lindane,” Chemosphere, vol. 134, pp. 60–66, Sep. 2015.
[8] N. Ruocco et al., “High-quality RNA extraction from the sea urchin Paracentrotus lividus embryos,” Plos One, vol. 12, no. 2, p. e0172171, Feb. 2017.
[9] B. Zuber, “Bachelor’s thesis: Isolation and characterization of sea urchin P. lividus microbiota from coelomic fluid.” 28-Oct-2016.
[10] Gianguzza Paola, Badalamenti Fabio, Gianguzza Fabrizio, Bonaviri Chiara, and Riggio Silvano, “The operational sex ratio of the sea urchin Paracentrotus lividus populations: the case of the Mediterranean marine protected area of Ustica Island (Tyrrhenian Sea, Italy),” Mar. Ecol., vol. 30, no. 1, pp. 125–132, Jan. 2009.
[11] Deveci Remziye, Şener Ecem, and İzzetoğlu Savaş, “Morphological and ultrastructural characterization of sea urchin immune cells,” J. Morphol., vol. 276, no. 5, pp. 583–588, Jan. 2015.
[12] D. Schillaci et al., “Antimicrobial and antistaphylococcal biofilm activity from the sea urchin
Paracentrotus lividus,” J. Appl. Microbiol., vol. 108, no. 1, pp. 17–24, Jan. 2010.
[13] V. Arizza, M. Vazzana, D. Schillaci, D. Russo, F. T. Giaramita, and N. Parrinello, “Gender differences in the immune system activities of sea urchin Paracentrotus lividus,” Comp.
Biochem. Physiol. -Mol. Integr. Physiol., vol. 164, no. 3, pp. 447–455, Mar. 2013.
[14] S. Couvray, Étude de la dynamique de populations d’oursins comestibles Paracentrotus lividus
(Lamarck, 1816) en zone pêchée et anthropisée. : Évaluation de l’efficacité et de l’impact d’opérations de lâchers de juvéniles pour le repeuplement. Toulon, 2014.
[15] V. Cavalieri and G. Spinelli, “Symmetry Breaking and Establishment of Dorsal/Ventral Polarity in the Early Sea Urchin Embryo,” Symmetry-Basel, vol. 7, no. 4, pp. 1721–1733, Dec. 2015.
[16] S. A. Barghouthi, “A Universal Method for the Identification of Bacteria Based on General PCR Primers,” Indian J. Microbiol., vol. 51, no. 4, pp. 430–444, Oct. 2011.
[17] N. I. Kalinovskaya et al., “Low-molecular-weight, biologically active compounds from marine
Pseudoalteromonas species,” Curr. Microbiol., vol. 48, no. 6, pp. 441–446, Jun. 2004.
[18] D. Feher, R. S. Barlow, P. S. Lorenzo, and T. K. Hemscheidt, “A 2-Substituted Prodiginine, 2-(p-Hydroxybenzyl)prodigiosin, from Pseudoalteromonas rubra,” J. Nat. Prod., vol. 71, no. 11, pp. 1970–1972, Nov. 2008.
[19] I. D. B. Arthaud et al., “Studies on the Secondary Metabolites of a Pseudoalteromonas sp Isolated from Sediments Collected at the Northeastern Coast of Brazil,” Chem. Biodivers., vol. 9, no. 2, pp. 418–427, Feb. 2012.
[20] Y. Wang et al., “Cytotoxic Prodigiosin Family Pigments from Pseudoalteromonas sp 1020R Isolated from the Pacific Coast of Japan,” Biosci. Biotechnol. Biochem., vol. 76, no. 6, pp. 1229– 1232, Jun. 2012.
[21] S. Sagar et al., “Induction of apoptosis in cancer cell lines by the Red Sea brine pool bacterial extracts,” Bmc Complement. Altern. Med., vol. 13, p. 344, Dec. 2013.
[22] G. Nakase, M. Tokuda, K. Nomura, and H. Tanaka, “Isolation and characterization of bacteria causing mortality in early stage larvae of captive-bred Japanese eels (Anguilla japonica Temminck & Schlegel),” Aquac. Res., vol. 46, no. 11, pp. 2637–2643, Nov. 2015.
[23] S. A. Hettiarachchi et al., “A Rapid and Efficient Screening Method for Antibacterial Compound-Producing Bacteria,” J. Microbiol. Biotechnol., vol. 27, no. 8, pp. 1441–1448, Aug. 2017.
[24] N. Ruocco, S. Costantini, F. Palumbo, and M. Costantini, “Marine Sponges and Bacteria as Challenging Sources of Enzyme Inhibitors for Pharmacological Applications,” Mar. Drugs, vol. 15, no. 6, p. 173, Jun. 2017.
[25] S. Sagar et al., “Cytotoxic and apoptotic evaluations of marine bacteria isolated from brine-seawater interface of the Red Sea,” Bmc Complement. Altern. Med., vol. 13, p. 13, Feb. 2013. [26] P. Karthick and R. Mohanraju, “Antimicrobial Potential of Epiphytic Bacteria Associated With
Seaweeds of Little Andaman, India,” Front. Microbiol., vol. 9, p. 611, Apr. 2018.
[27] L. Liu et al., “A Vibrio owensii strain as the causative agent of AHPND in cultured shrimp,
Litopenaeus vannamei,” J. Invertebr. Pathol., vol. 153, pp. 156–164, Mar. 2018.
[28] L. Liu et al., “Rapid diagnosis of Vibrio owensii responsible for shrimp acute hepatopancreatic necrosis disease with isothermal recombinase polymerase amplification assay,” Mol. Cell.
Probes, vol. 33, pp. 4–7, Jun. 2017.
[29] S. Elkahoui et al., “Mass spectrometry identification of antifungal lipopeptides from Bacillus sp BCLRB2 against Rhizoctonia solani and Sclerotinia sclerotiorum,” Appl. Biochem. Microbiol., vol. 50, no. 2, pp. 161–165, Mar. 2014.
[30] S. N. Kumar, C. Dileep, C. Mohandas, B. Nambisan, and C. A. Jayaprakas, “Cyclo(D-Tyr-D-Phe): a new antibacterial, anticancer, and antioxidant cyclic dipeptide from Bacillus sp N strain associated with a rhabditid entomopathogenic nematode,” J. Pept. Sci., vol. 20, no. 3, pp. 173– 185, Mar. 2014.
[31] R. Papa et al., “Anti-Biofilm Activities from Marine Cold Adapted Bacteria Against Staphylococci and Pseudomonas aeruginosa,” Front. Microbiol., vol. 6, p. 1333, Dec. 2015.
[32] I. F. Begum, R. Mohankumar, M. Jeevan, and K. Ramani, “GC-MS Analysis of Bio-active Molecules Derived from Paracoccus pantotrophus FMR19 and the Antimicrobial Activity Against Bacterial Pathogens and MDROs,” Indian J. Microbiol., vol. 56, no. 4, pp. 426–432, Dec. 2016.
[33] “Sea Urchin staging series.” [Online]. Available: https://www.swarthmore.edu/NatSci/sgilber1/DB_lab/Urchin/urchin_stage.html. [Accessed: 15-Mar-2018].
[34] R. Russo, R. Bonaventura, M. Chiaramonte, C. Costa, V. Matranga, and F. Zito, “Response to metals treatment of Fral, a member of the AP-1 transcription factor family, in P. lividus sea urchin embryos,” Mar. Environ. Res., vol. 139, pp. 99–112, Aug. 2018.
[35] J. Kanold, J. Wang, F. Brümmer, and L. Šiller, “Metallic nickel nanoparticles and their effect on the embryonic development of the sea urchin Paracentrotus lividus,” Environ. Pollut., vol. 212, pp. 224–229, May 2016.
[36] R. Bonaventura, F. Zito, M. Chiaramonte, C. Costa, and R. Russo, “Nickel toxicity in P. lividus embryos: Dose dependent effects and gene expression analysis,” Mar. Environ. Res., vol. 139, pp. 113–121, Aug. 2018.
7 Annexes
7.1 Summary of sea urchin’s experiments and results
7.1.1 Experiment of 05.06.2018 (week 23)
7.1.1.1 Plate 5 – V. jasicida
This experiment details are at page 23 of the laboratory notebook. 24 well plate with each sample in triplicates.
In each well 1 mL of sea water + 20 µL of embryos (approx. 300 embryos) + sample.
Samples:
o SGS 5 µL o SGS 10 µL
o Spent media 10 µL
o Cell lysate after sonication 10 µL
o Methanolic extract of the pellet after sonication (diluted 20x in sea water) 10 µL
Controls
o MB with 20% glycerol 10 µL
o 0.5 M HCl diluted in MeOH (diluted 20x in sea water) 10 µL o No treatment
7.1.1.2 Plate 6 – I. homiensis
This experiment details are at page 23 of the laboratory notebook. 24 well plate with each sample in triplicates.
In each well 1 mL of sea water + 20 µL of embryos (approx. 300 embryos) + sample.
Samples:
o SGS 5 µL o SGS 10 µL
o Spent media 10 µL
o Cell lysate after sonication 10 µL
o Methanolic extract of the pellet after sonication (diluted 20x in sea water) 10 µL
Controls
o MB with 20% glycerol 10 µL
o 0.5 M HCl diluted in MeOH (diluted 20x in sea water) 10 µL o No treatment
7.1.2 Experiment of 13.06.2018 (week 24)
7.1.2.1 Plate 7 – I. homiensis
This experiment details are at page 35 of the laboratory notebook. 24 well plate with each sample in triplicates.
In each well 980 µL of sea water + 40 µL of embryos (approx. 300 embryos) + 10 µL sample.
Samples:
Liquid culture in MB
Centrifugation, wash pellet with 1 mL of sea water
Resuspend pellet in 1 mL SGS (500 µL of sea water + 500 µL of 40% glycerol) Dilute the SGS 100x in sea water
o Bacteria SB
Liquid culture in SB (sea water + 5 g/L peptone + 1 g/L yeast extract) SGS (500 µL culture + 500 µL of 40% glycerol)
Dilute the SGS 100x in sea water
o Methanolic extract of the pellet after KOH (diluted 10x in sea water) o Methanolic extract of the pellet after sonic (diluted 10x in sea water)
Controls o MB
Liquid culture in MB
Centrifugation, wash pellet with 1 mL of sea water
Resuspend pellet in 1 mL SGS (500 µL of sea water + 500 µL of 40% glycerol) Dilute the SGS 100x in sea water
o SB
Liquid culture in SB (sea water + 5 g/L peptone + 1 g/L yeast extract) SGS (500 µL culture + 500 µL of 40% glycerol)
Dilute the SGS 100x in sea water
o 0.5 M HCl diluted in MeOH (diluted 10x in sea water) o No treatment
7.1.2.2 Plate 8 – I. homiensis
This experiment details are at page 35 of the laboratory notebook. 24 well plate with each sample in triplicates.
In each well 980 µL of sea water + 40 µL of embryos (approx. 300 embryos) + 10 µL sample.
Samples:
o Methanolic extract of the pellet after KOH (diluted 20x in sea water) o Methanolic extract of the pellet after sonic (diluted 20x in sea water) o Cell lysate with KOH (dil 5x in 1 M Tris-HCl pH 7.5)
o Cell lysate after sonication Dil 2x in PBS Centrifuge Discard pellet
Controls
o 0.5 M HCl diluted in MeOH (diluted 20x in sea water) o 1 M KOH (dil 5x in 1 M Tris-HCl pH 7.5)
o PBS
o No treatment
7.1.3 Experiment of 19.06.2018 (week 25)
7.1.3.1 Plate 9 – I. homiensis
This experiment details are at page 50 of the laboratory notebook. 24 well plate with each sample in triplicates.
Samples:
o Methanolic extract of the pellet after KOH (diluted 5x in sea water) o Methanolic extract of the pellet after sonic (diluted 5x in sea water) o Methanolic extract of the pellet after KOH (diluted 10x in sea water) o Methanolic extract of the pellet after sonic (diluted 10x in sea water)
Controls o SB
Liquid culture in SB (sea water + 5 g/L peptone + 1 g/L yeast extract) SGS (500 µL culture + 500 µL of 40% glycerol)
Dilute SGS 50x in sea water
o 0.5 M HCl diluted in MeOH (diluted 5x in sea water) o 0.5 M HCl diluted in MeOH (diluted 10x in sea water) o No treatment
7.1.3.2 Plate 10 – I. homiensis
This experiment details are at page 50 of the laboratory notebook. 24 well plate with each sample in triplicates.
In each well 910 µL of sea water + 110 µL of embryos (approx. 250 embryos) + 10 µL sample.
Samples:
o Bacteria MB
Liquid culture in MB
Centrifugation, wash pellet with 1 mL of sea water
Resuspend pellet in 1 mL SGS (500 µL of sea water + 500 µL of 40% glycerol) Dilute the SGS 200x in sea water
o Bacteria SB
Liquid culture in SB (sea water + 5 g/L peptone + 1 g/L yeast extract) SGS (500 µL culture + 500 µL of 40% glycerol)
Dilute the SGS 50x in sea water o Cell lysate after sonication
Dil 2x in PBS Centrifuge Discard pellet
Dilute the supernatant 2x in sea water
o Cell lysate with KOH (dil 5x in 1 M Tris-HCl pH 7.5, then dilute 2x in sea water – final dilution 10x)
Controls
o PBS (diluted 2x in sea water)
o 1 M KOH (dil 5x in 1 M Tris-HCl pH 7.5, then dil 2x in sea water – final dilution 10x) o MB
Liquid culture in MB
Centrifugation, wash pellet with 1 mL of sea water
Resuspend pellet in 1 mL SGS (500 µL of sea water + 500 µL of 40% glycerol) Dilute the SGS 200x in sea water
7.1.4 Results of the embryo assays
In this section the detailed results of the embryological assays are found.
Table 6: Obtained results of plate n°5 – V. jasicida
Sample Average normal embryos % normal
No treatment 48.7 ± 1.4 (0.6; 95%; 3) 97.3 Ctrl MeOH* 10 µL 47.7 ± 1.4 (0.6; 95%; 3) 95.3 Ctrl SGS 10 µL 10.3 ± 22.3 (9.0; 95%; 3) 20.7 MeOH extract* 10 µL 38.7 ± 17.4 (7.0; 95%; 3) 77.3 Lysate sonication 10 µL 28.3 ± 6.3 (2.5; 95%; 3) 56.7 Spent media 10 µL 22.3 ± 16 (6.4; 95%; 3) 44.7 SGS 10 µL 8.0 ± 7.5 (3.0; 95%; 3) 16.0 SGS 5 µL 7.7 ± 7.2 (2.9; 95%; 3) 15.3
*Samples were diluted 20x in sea water before their addition in the plate.
The obtained results in Table 6 show that the MB may have an effect on the embryos. These results should be investigated due to repeatability problems. The methanolic extractof the pellet after the cell lysis by sonication may contain a compound than has a negative effect on the embryos. Only 77.3% of the embryos were normal against 95.3% in the methanol control.
Table 7: Obtained results of plate n°6 – I. homiensis
Sample Average normal embryos % normal
No treatment 47.7 ± 1.4 (0.6; 95%; 3) 95.3 Ctrl MeOH* 10 µL 45.7 ± 3.8 (1.5; 95%; 3) 91.3 Ctrl SGS 10 µL 13.0 ± 28.0 (11.3; 95%; 3) 26.0 MeOH extract* 10 µL 39.0 ± 2.5 (1.0; 95%; 3) 78.0 Lysate sonication 10 µL 20.0 ± 11.4 (4.6; 95%; 3) 40.0 Spent media 10 µL 18.3 ± 7.2 (2.9; 95%; 3) 36.7 SGS 10 µL 22.3 ± 12.5 (5.0; 95%; 3) 44.7 SGS 5 µL 25.3 ± 7.6 (3.1; 95%; 3) 50.7
*Samples were diluted 20x in sea water before their addition in the plate.
The results shown in Table 7 suggest that there’s no visible effect of the different tested compounds. Following experiments will reveal an effect of PBS (also used for sonication) that excludes the observed effects during this experiment. Even the methanolic extract has less than 20% of difference with its control. For both plates of the experiment 3, observations under stereo microscope showed that embryos in contact with MB had an abnormal swimming. Some embryos were turning around their own axis and others didn’t move at all.
The results of the fourth experiment are shown in Table 8 and Table 9. The pH of cell lysates (with KOH) is decreased by diluting the samples 5x in 1 M Tris-HCl pH 7.5. The final pH of the sample was between pH 8.2 and pH 8.5. The pH of the sea water is 8.0.
Table 8: Obtained results of plate n°7 – I. homiensis
Sample Average normal embryos % normal
No treatment 38.3 ± 14.1 (5.7; 95%; 3) 76.7
Ctrl MeOH* 39.3 ± 3.8 (1.5; 95%; 3) 78.7
MeOH extract KOH* 33.0 ± 9.9 (4.0; 95%; 3) 66.0
MeOH extract sonic* 20.7 ± 17.6 (7.1; 95%; 3) 41.3
SB bacteria** 35.7 ± 3.8 (1.5; 95%; 3) 71.3
Ctrl SB ** 35.7 ± 21.7 (8.7; 95%; 3) 71.3
MB then sea water bacteria** 28.7 ± 8.7 (3.5; 95%; 3) 57.3
Ctrl MB then sea water** 32.0 ± 12.9 (5.2; 95%; 3) 64.0
*Samples were diluted 10x in sea water before their addition in the plate. **Samples were diluted 100x in sea water before their addition in the plate.
Table 9: Obtained results of plate n°8 – I. homiensis
Sample Average normal embryos % normal
No treatment 36.0 ± 2.5 (1.0; 95%; 3) 72.0 Ctrl PBS 18.0 ± 7.5 (3.0; 95%; 3) 36.0 Sonicate* 12.7 ± 38.0 (15.3; 95%; 3) 25.3 Ctrl KOH** 25.3 ± 10.3 (4.2; 95%; 3) 50.7 KOH** 10.0 (0.0; 95%; 3) 20.0 Ctrl MeOH*** 35.3 ± 8 (3.2; 95%; 3) 70.7
MeOH extract KOH*** 39.7 ± 8 (3.2; 95%; 3) 79.3
MeOH extract sonic*** 34 ± 9.9 (4; 95%; 3) 68.0
*Samples were diluted 2x in PBS before their addition in the plate.
**Samples were diluted 5x in 1 M Tris-HCl pH 7.5 for neutralization before their addition in the plate. ***Samples were diluted 20x in sea water before their addition in the plate.
The obtained results of the fifth experiment are shown in Table 10 and Table 11. Due to the quality of the starting material because of the end of the spawning season, only few eggs were obtained. The treatments were tested only in duplicates.
Table 10: Obtained results of plate n°9 – I. homiensis
Sample Average normal embryos % normal
No treatment 48.5 97.0
Ctrl MeOH* dil 10x 47.5 95.0
MeOH extract* sonic dil 10x 41.0 82.0
MeOH extract* KOH dil 10x 42.5 85.0
Ctrl MeOH** dil 5x 49.0 98.0
MeOH extract sonic** dil 5x 45.0 90.0
MeOH extract KOH** dil 5x 39.0 78.0
Ctrl SB*** dil 50x 41.5 83.0
*Samples were diluted 10x in sea water before their addition in the plate. **Samples were diluted 5x in sea water before their addition in the plate. ***Samples were diluted 50x in sea water before their addition in the plate.
Table 11: Obtained results of plate n°10 – I. homiensis
Sample Average normal embryos % normal
No treatment 49.0 98.0 SB bacteria* 45.5 91.0 MB + SW bacteria** 44.0 88.0 Ctrl MB + SW dil** 46.5 93.0 Lysate KOH*** 35.0 70.0 Ctrl KOH*** 46.5 93.0 Sonicate**** 39.5 79.0 Ctrl PBS**** 43.0 86.0
*Samples were diluted 50x in sea water before their addition in the plate. **Samples were diluted 200x in sea water before their addition in the plate.
***Samples were diluted 5x in 1 M Tris-HCl pH 7.5 for neutralization then 2x in sea water before their addition in the plate. ****Samples are diluted 2x in PBS then 2x in sea water before their addition in the plate.
7.2 16S rDNA phylogenetic trees
The sequencing results received from the company BMR Genomics in Padova (Italy) were used for the identification of the bacterial strains. First of all the amplified sequences with the reverse primer were adapted (reverse complement). Then the amplified regions with the forward and reverse primer (reverse complement) were aligned using Blast. The alignment was used to identify the bacteria using Blast who searched for similarities in its database (16S ribosomal RNA sequences (Bacteria and Archaea)). The first 10 most similar strains and some outliners were selected for the construction of the distance trees. The construction of the phylogenetic trees was done using an online program (http://www.phylogeny.fr/simple_phylogeny.cgi) and the “one click” option. The obtained results are shown in the following figures.
Figure 20: Phylogeny tree for the identification of the strain ESP2 2F3
Figure 22: Phylogeny tree for the identification of the strain ESP3 1F3 yellow colony
Figure 23: Phylogeny tree for the identification of the strain ESP3 2F2
Figure 25: Phylogeny tree for the identification of the strain ESP3 4F1 yellow colony
Figure 26: Phylogeny tree for the confirmation of a previous identification of the strain Idiomarina homiensis
The obtained result in Figure 26 shows that the genus of the previous identification was correct but the species couldn’t be confirmed. The strain is Idiomarina sp.
Concerning the strain V. jasicida, the result of the sequencing didn’t permit the obtainment of a correct alignment. The sequences were used independently (forward and reverse) to identify the strain. The obtained results show that the previous sequencing may have been wrong. The results suggest that the strain is Kocuria sp. for both primers (Figure 27 and Figure 28).
![Figure 4: The internal structure of P. lividus. The coelomic fluid in not shown on the image [9]](https://thumb-eu.123doks.com/thumbv2/123doknet/14818336.614402/10.892.128.768.368.745/figure-internal-structure-lividus-coelomic-fluid-shown-image.webp)
![Figure 5: Simplified scheme depicting key developmental stages and early molecular activities regulating morphogenesis along the Dorsal/Ventral axis of the sea urchin embryo [15]](https://thumb-eu.123doks.com/thumbv2/123doknet/14818336.614402/11.892.122.770.522.768/simplified-depicting-developmental-molecular-activities-regulating-morphogenesis-ventral.webp)
![Figure 6: Sea urchin staging series [33]](https://thumb-eu.123doks.com/thumbv2/123doknet/14818336.614402/13.892.177.718.100.1144/figure-sea-urchin-staging-series.webp)