Publisher’s version / Version de l'éditeur:
The Astrophysical Journal, 846, 2, p. 96, 2017-09-05
READ THESE TERMS AND CONDITIONS CAREFULLY BEFORE USING THIS WEBSITE. https://nrc-publications.canada.ca/eng/copyright
Vous avez des questions? Nous pouvons vous aider. Pour communiquer directement avec un auteur, consultez la première page de la revue dans laquelle son article a été publié afin de trouver ses coordonnées. Si vous n’arrivez pas à les repérer, communiquez avec nous à PublicationsArchive-ArchivesPublications@nrc-cnrc.gc.ca.
Questions? Contact the NRC Publications Archive team at
PublicationsArchive-ArchivesPublications@nrc-cnrc.gc.ca. If you wish to email the authors directly, please see the first page of the publication for their contact information.
NRC Publications Archive
Archives des publications du CNRC
This publication could be one of several versions: author’s original, accepted manuscript or the publisher’s version. / La version de cette publication peut être l’une des suivantes : la version prépublication de l’auteur, la version acceptée du manuscrit ou la version de l’éditeur.
For the publisher’s version, please access the DOI link below./ Pour consulter la version de l’éditeur, utilisez le lien DOI ci-dessous.
https://doi.org/10.3847/1538-4357/aa84ae
Access and use of this website and the material on it are subject to the Terms and Conditions set forth at
Where are the Binaries? Results of a long-term search for radial
velocity binaries in proto-planetary nebulae
Hrivnak, Bruce J.; Steene, Griet Van De; Winckel, Hans Van; Sperauskas,
Julius; Bohlender, David; Lu, Wenxian
https://publications-cnrc.canada.ca/fra/droits
L’accès à ce site Web et l’utilisation de son contenu sont assujettis aux conditions présentées dans le site LISEZ CES CONDITIONS ATTENTIVEMENT AVANT D’UTILISER CE SITE WEB.
NRC Publications Record / Notice d'Archives des publications de CNRC:
https://nrc-publications.canada.ca/eng/view/object/?id=e7644cba-9797-40a1-8a82-e6a1e6bf97d9 https://publications-cnrc.canada.ca/fra/voir/objet/?id=e7644cba-9797-40a1-8a82-e6a1e6bf97d9Where are the Binaries? Results of a Long-term Search for
Radial Velocity Binaries in Proto-planetary Nebulae
Bruce J. Hrivnak1 , Griet Van de Steene2, Hans Van Winckel3 , Julius Sperauskas4 , David Bohlender5 , and Wenxian Lu1,6
1
Department of Physics and Astronomy, Valparaiso University, Valparaiso, IN 46383, USA;bruce.hrivnak@valpo.edu,wen.lu@valpo.edu
2
Royal Observatory of Belgium, Astronomy & Astrophysics, Ringlaan 3, Brussels, Belgium;g.vandesteene@oma.be
3
Instituut voor Sterrenkunde, K.U. Leuven University, Celestijnenlaan 200 D, B-3001 Leuven, Belgium;Hans.VanWinckel@ster.kuleuven.be
4
Vilnius University Observatory, Ciurlionio 29 Vilnius 2009, Lithuania;julius.sperauskas@ff.vu.lt
5National Research Council of Canada, Herzberg Astronomy and Astrophysics, 5071 West Saanich Road, Victoria, BC V9E 2E7, Canada;David.Bohlender@nrc-cnrc.gc.ca
Received 2017 June 28; revised 2017 August 1; accepted 2017 August 4; published 2017 September 5
Abstract
We present the results of an expanded, long-term radial velocity search (25 years) for evidence of binarity in a sample of seven bright proto-planetary nebulae (PPNe). The goal is to investigate the widely held view that the bipolar or point-symmetric shapes of planetary nebulae (PNe) and PPNe are due to binary interactions. Observations from three observatories were combined from 2007 to 2015 to search for variations on the order of a few years and then combined with earlier observations from 1991 to 1995 to search for variations on the order of decades. All seven show velocity variations due to periodic pulsation in the range of 35–135 days. However, in only one PPN, IRAS 22272+5435, did we find even marginal evidence for multi-year variations that might be due to a binary companion. This object shows marginally significant evidence of a two-year period of low semi-amplitude, which could be due to a low-mass companion, and it also displays some evidence of a much longer period of >30 years. The absence of evidence in the other six objects for long-period radial velocity variations due to a binary companion sets significant constraints on the properties of any undetected binary companions: they must be of low mass, 0.2 Me, or long period, >30 years. Thus the present observations do not provide direct
support for the binary hypothesis to explain the shapes of PNe and PPNe and severely constrains the properties of any such undetected companions.
Key words:binaries: general – binaries: spectroscopic – planetary nebulae: general – stars: AGB and post-AGB
1. Introduction
One of the outstanding problems in the study of planetary nebulae (PNe) over the past 25 years has been the determina-tion of the mechanism or mechanisms that produce the interesting array of shapes of the circumstellar nebulae. These range from round to elliptical to bipolar to irregular. This was particularly highlighted by the intricate, often bipolar and sometimes multipolar or point-symmetric shapes revealed by the Hubble Space Telescope (HST; Balick & Frank2002; Sahai & Trauger 1998). Since PNe evolve from approximately spherical asymptotic giant branch (AGB) stars, this range of shapes does not meet our simplest expectation. Initial arguments to explain these pitted rotation and magnetic fields (García-Segura et al.1999,2005)versus binaries (Soker2004; De Marco 2009) as the main driver of the shaping, and discussions of this are common at the regular series of IAU Planetary Nebulae Symposia (most recently Liu et al. 2017) and the series of Asymmetrical Planetary Nebulae conferences. Photometric monitoring of the central stars of PNe revealed that a few of these displayed periodic photometric variability due to binarity (Bond2000). As a means to investigate the role of binarity in the shaping of PNe, photometric studies of variability in PNe increased. With the identification by Miszalski et al. (2009) of 21 new binary central stars using the OGLE database to study PNe in the galactic bulge, the number of known binaries was approximately doubled. Other studies have continued to add to these (Jones et al. 2015; Hillwig et al.2017)and approximately 50 close binary central
stars have been identified.7Most of these have periods of less than one day. It is estimated that ∼20% of PNe have close binary central stars and this could be a lower limit, as studies with the Kepler mission found several PNe with very low amplitude variability, lower than could be measured from the ground (De Marco et al. 2015). At least some of these are binaries. The Kepler II mission is observing many more PNe, albeit with precision that is not as good as the earlier Kepler mission (Jacoby et al.2016). Based on these short periods, it is assumed that these objects have passed through a common envelope phase. During this time, the companion to the then AGB star was engulfed by its expanding envelope and spiraled inward, leading to the ejection of the envelope but avoiding a merger of the two stars (e.g., Nie et al.2003). Recently, Hillwig et al. (2016)presented strong evidence of the role of binaries in the shaping of PNe by showing the tight correlation between the angle of the orbital axis of the binary and the independently determined angle of the axis of the symmetric nebula. Although the sample size is small, only eight objects, it consists of all of the objects that have well-determined values for the two angles and it covers a broad range of inclinations. Central stars of PNe with wider spectroscopic orbits have recently been found (e.g., Van Winckel et al. 2014; Jones et al.2017; Miszalski et al.
2017), but not yet in significant numbers. There are also observational biases against discovering these, as long-term radial velocity monitoring programs are scarce and are restricted to bright central stars. The role of binaries in shaping
846:96 (12pp), 2017 September 10 https://doi.org/10.3847/1538-4357/aa84ae
© 2017. The American Astronomical Society. All rights reserved.
6
and even in forming PNe has recently been reviewed by Jones & Boffin (2017).
The identification of proto-planetary or pre-planetary nebulae (PPNe) in the late-1980s made it possible to investigate the precursors to PNe. These are post-AGB objects in transition between the AGB and the PN phase in the evolution of intermediate-mass (1.5–8 Me) stars. As such, they are
com-posed of a central star evolving toward higher temperatures that is surrounded by a detached circumstellar envelope composed of mass lost during the AGB phase. The expanding gaseous component of the nebula was observed in molecular lines of CO and HCN (Omont et al.1993)or maser lines of OH (Likkel
1989). Dust condensed in the outflow and gave rise to a large infrared excess that helped to first identify objects as PPNe candidates (Hrivnak et al.1989). The dust peaked at ∼25 μm, at dust temperatures of 150–300 K. HST observations showed that they possess faint, angularly small nebulae (typi-cally<4″), which are viewed in reflected visible light (Ueta et al.2000; Sahai et al.2007; Siódmiak et al.2008). When the temperature of the central star becomes hot enough to photo-ionize this envelope, the object will have entered the PN phase. Thus they have central stars in the range of 4000–30,000 K. The observed properties of PPNe agree well with what one would expect for the progenitors of most PNe and are expected to evolve into PNe.
Photometric studies of PPNe, particularly by Arkhipova and collaborators (Arkhipova et al. 2010,2011) and Hrivnak and collaborators (Hrivnak et al.2010,2015a,2015b)revealed light variations with periods (or quasi-periods) in the range of 35–160 days. Radial velocity studies supported the idea that these variations were due to pulsations in the stars (Burki et al.
1980; Barthès et al. 2000; Začs et al. 2009; Hrivnak et al.
2013).
Observations of another class of stars with an infrared excess suggested that they too are post-AGB objects, with typical spectral types of F−G and in many cases unusual abundance patterns. However, in this class of stars, the excess starts near the dust sublimation temperature and peaks in the near-infrared below 10 μm. Radial velocity studies indicated that these are binaries, with P≈120–1500 days (Van Winckel et al.2009). The dust is found to reside in a circumbinary disk (e.g., Van Winckel2003; Bujarrabal et al.2015; Hillen et al.2017), and
these have been referred to as post-AGB “disk” objects. They are distinguished from the PPNe, which have cooler dust not confined to a disk and are labeled “shell” sources. It seems unlikely that these objects evolve into PNe, but rather evolve into white dwarfs without passing through a PN stage.
Hrivnak et al. (2011) carried out a study of seven bright PPNe to look for long-term radial velocity variations due to binary companions. The observations were carried out from 1991 to 1995 and then again from 2007 to 2010. Pulsational variations were found in each but only in one object was there a suggestion of long-term variation. In light of the importance of verifying the presence or at least constraining the properties of any potential binary companions to these PPNe, we have extended the study of these same seven objects over five additional years. In this extended study, we have also increased the data density by including observations from two additional observatories, increased the precision in the observations, and more carefully considered the potential complications of comparing observations made at different times with different instruments.
2. Program Objects
The program objects are the seven brightest (V<10.5 mag) PPNe observable from mid-latitudes in the northern hemi-sphere. Thus they can be monitored with 1–2 m class telescopes with high spectral resolution. They all possess the various properties of PPNe and have been the subjects of many studies of their stellar and circumstellar properties. They all have spectral types of F−G supergiants, with double-peaked spectral energy distributions: one peak due to the reddened photosphere and the other, in the mid-infrared, due to the re-radiation from the dust envelope (e.g., Hrivnak et al. 1989). They are shell sources and show no evidence for the presence of a disk. Some are oxygen-rich and some are carbon-rich, as seen in their optical spectra, infrared dust emission features, and molecular radio lines. Some basic properties of the program objects are listed in Table1.
For each of these objects, we have obtained contempora-neous light and radial velocity curves from 2007 to 2015, and we have also obtained radial velocity curves from 1991 to 1995. Detailed studies of the pulsation of these have or will be
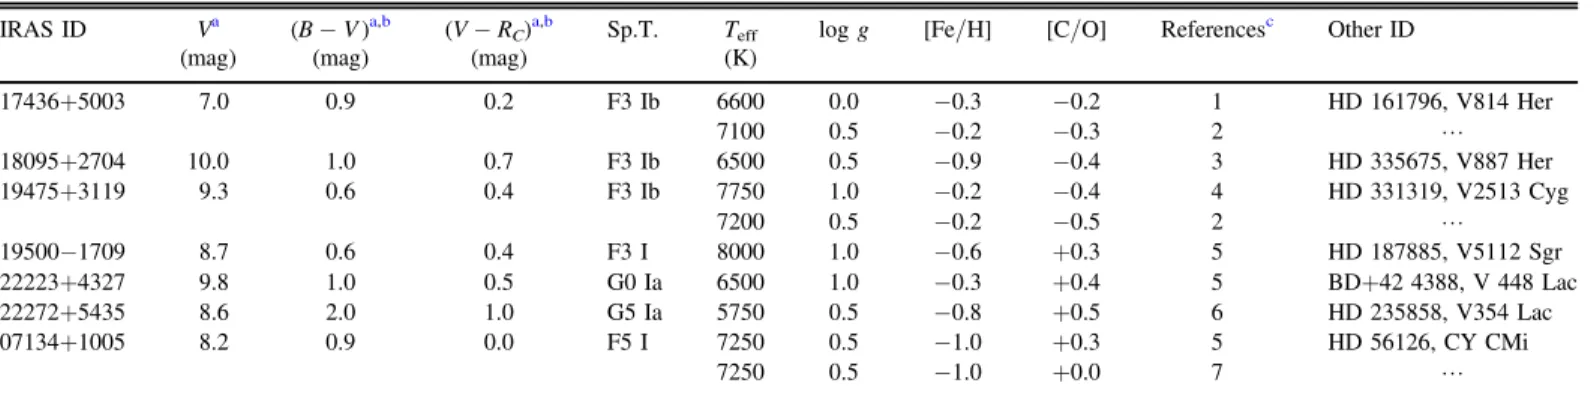
Table 1 Program Objects IRAS ID Va (
B − V )a,b (
V − RC)a,b Sp.T. Teff log g [Fe/H] [C/O] Referencesc Other ID
(mag) (mag) (mag) (K)
17436+5003 7.0 0.9 0.2 F3 Ib 6600 0.0 −0.3 −0.2 1 HD 161796, V814 Her 7100 0.5 −0.2 −0.3 2 L 18095+2704 10.0 1.0 0.7 F3 Ib 6500 0.5 −0.9 −0.4 3 HD 335675, V887 Her 19475+3119 9.3 0.6 0.4 F3 Ib 7750 1.0 −0.2 −0.4 4 HD 331319, V2513 Cyg 7200 0.5 −0.2 −0.5 2 L 19500−1709 8.7 0.6 0.4 F3 I 8000 1.0 −0.6 +0.3 5 HD 187885, V5112 Sgr 22223+4327 9.8 1.0 0.5 G0Ia 6500 1.0 −0.3 +0.4 5 BD+424388, V 448 Lac 22272+5435 8.6 2.0 1.0 G5Ia 5750 0.5 −0.8 +0.5 6 HD 235858, V354 Lac 07134+1005 8.2 0.9 0.0 F5 I 7250 0.5 −1.0 +0.3 5 HD 56126, CY CMi 7250 0.5 −1.0 +0.0 7 L Notes. a Variable. b
Includes circumstellar and interstellar reddening. c
References for the spectroscopic analyses: (1) Luck et al. (1990); (2) Klochkova et al. (2002); (3) Sahin et al. (2011); (4) Arellano Ferro et al. (2001); (5) Van Winckel & Reyniers (2000); (6) Reddy et al. (2002); (7) Reddy & Hrivnak (2003).
published separately (Hrivnak et al.2013; B. J. Hrivnak et al. 2017, in preparation).
3. Radial Velocity Observations and Reductions We began radial velocity studies of these seven bright PPNs in 1991. Observations were initially carried out at the Dominion Astrophysical Observatory (DAO) using the Radial Velocity Spectrometer (RVS; Fletcher et al.1982)at the Coudé focus of the 1.2 m telescope. The RVS uses a physical mask based on the spectrum of the F star Procyon and covers the spectral range of 4000–4600 Å. The incremental motion of the mask across the spectrum resulted in a cross-correlation profile of the transmitted light. The velocities were determined by fitting a parabola to the upper half of these profiles. We will refer to these as the DAO-RVS observations. They are from 1991 to 1995, with most of the data from 1991 to 1993.
We reinitiated the radial velocity monitoring program at the DAO in 2007, but with a CCD (DAO-CCD) replacing the RVS physical mask and photocell. These high-resolution DAO-CCD spectra covered a smaller spectral region, 4350–4500 Å. The spectra were measured for velocity by cross-correlation with a set of bright IAU radial velocity standards observed with the same instrumentation. Again, velocities were determined by fitting a parabola to the upper half of the profiles. More details of the DAO observations and data calibration with these two systems are given in earlier papers (Hrivnak et al.2011,2013). The observations reported in this study extend through the end of 2015, or to early 2016 in the case of IRAS 07134+1005.
To increase the number of observations, the observing program was expanded to include two additional telescopes. Observations for all seven stars in this program began in 2009 on the Flemish 1.2 m Mercator Telescope on La Palma, equipped with the HERMES spectrograph. HERMES is a fiber-fed echelle spectrograph and covers the large wavelength range of 3900–9000 Åwith a spectral resolution of λ/Δλ∼85,000 (Raskin et al. 2011). For our measurements, we used the spectral range of 4770–6550 Å(orders 55–74), which gave the fits with the best signal-to-noise ratio (S/N). These data were cross-correlated with a template constructed to match an F star, and the entire profile was fit with a Gaussian function to determine the velocity. The resulting velocities are of high precision, ∼0.4 km s−1. For three of the objects, observations
were also carried out with a CORAVEL-type radial velocity spectrometer mounted on the 1.65 m telescope of the Moletai Observatory (Lithuania). The spectrum measured covered the interval 3850–6400 Å, and the physical mask contains 1650 slits and was based primarily on the solar spectrum. Velocity measurements were determined by fitting a Gaussian function to the entire profile (Sperauskas et al.2016). Observations used in this program were carried out from 2008 to 2014. (Earlier observations of IRAS 22272+5435 from 2005 to 2007, with this CORAVEL-type instrument primarily at the Steward Observatory (Začs et al.2009), were not included in this study.) A recent study of K−M dwarfs with this instrument indicated a small systematic zero-point offset of +0.3 km s−1 (Sperauskas
et al.2016), but we did not apply this to our F−G-type objects (but see below). In Table2, the radial velocity data sets used in this study are listed. The individual radial velocities are listed elsewhere (Hrivnak et al. 2013; B. J. Hrivnak et al. 2017, in preparation).
Although the observations with the different telescope–spectro-graph–detector systems were calibrated using observations of IAU
radial velocity standard stars, we found that there were small but significant systematic differences between the velocity values measured. These were on the order of±0.5 km s−1 between
CORAVEL and HERMES but were larger between DAO-CCD and HERMES; on the order of ± 1.0 km s−1and reached to about
+2.0 km s−1in one case.
We have considered in turn several possible causes for these systematic differences. (1) These stars have complex spectra, with some containing molecules (such as C2), peculiar
abundances (such as enhanced s-process elements), and fast outflows. These can effect the measured velocities when compared with more normal standard stars, depending upon whether spectral regions containing these effects are included or not. (2) Observations made in different regions of the spectrum with the different systems would then include different regions of the complex spectra. (3) These stars are pulsating, which produces variable asymmetries in the line profiles due to shocks and outflows (Lèbre et al. 1996; Začs et al.2009,2016). Different methods of fitting the asymmetric cross-correlation function profiles can result in systematic differences. We investigated these effects empirically by analyzing the HERMES spectra over different intervals of wavelength similar to those of the other systems and indeed found systematic differences. Thus, given these physical complexities in the stellar spectra, differences in the spectro-scopic systems, and differences in the fitting of the cross-correlation profiles, it is reasonable to expect such differences at some level.
For this study, we have added empirically determined offsets to the DAO-CCD and CORAVEL velocities to bring them to agreement with the higher-precision HERMES velocities. The determination of these offsets is discussed in more detail in the
Appendix. These radial velocity offset values are also listed in Table 2. Given these observed systematic differences in the radial velocity sets, we have chosen not to include in our analysis any of the various miscellaneous velocities found in the literature for these seven objects. We do, however, refer in the Discussion to the constraints that these other observa-tions bring to the objects’ velocities during the gap in time (1996–2006) between our two observing sessions.
4. Investigation of Long-term Velocity Variations In this study, we used our expanded data set to look for longer-term velocities variations in the following two ways. First, we combined the DAO-CCD, HERMES, and CORAVEL 2007–2015 data and searched for longer-term velocity varia-tions beyond the pulsavaria-tions periods over this nine-year interval. We did this using the observational data, and where consistent pulsation periods are found, we also searched the residuals of the pulsational curves. Second, we compared the average values of the 1991–1995 data with the average values of the 2007–2015 data, looking for significant differences that might indicate variations on a timescale of decades.
The experience that we have gotten by comparing observa-tional results from the three different telescope-spectrograph-detector systems from 2007 to 2015 has also given us new insight into complications that can arise when combining the results of such different observational data sets for stars with complicated spectra. Hence, with these complications in mind, we did not combine the 1991–1995 data directly with the 2007–2015 data to searched for longer-term variations, as we had done in our earlier study (Hrivnak et al.2011).
In Figure1, the combined radial velocity curves for the seven objects from 2007 to 2015 is shown. The 1991–1995 observations were displayed earlier (Hrivnak et al. 2011). We will discuss the objects individually in the next two subsec-tions. They show dominant pulsational variations in the range of 35–135 days, which complicate the search for binarity. Period analyses were carried out using PERIOD04 (Lenz & Breger2005), which uses a Fourier technique to determine the frequencies in the data. The recommendations of a significance criterion of an S/N greater than or equal to 4.0 in the frequency spectrum (Breger et al.1993)was applied.
4.1. Long-term, Multi-year Variations 4.1.1. IRAS 17436+5003
Radial velocity observations of this object were made from all three sites, and the combined data showed a total velocity range of 13 km s−1. The period analysis of the three data sets
from 2007 to 2015 combined led to a period of 39.4 days, but it was not formally significant. We did, however, find that consistent periods could be found in the combined velocity curves when analyzing the data in shorter time intervals of one or two years. These yielded periods in the range of 42–52 days. An analysis of the DAO-RVS observations yielded a period of 43 days for 1991–1992. These are discussed in detail in the pulsation study by B. J. Hrivnak et al. (2017, in preparation). This object is bright, V=7 mag, and variable, and consequently
it has a long history of photometric studies, initially by Fernie (a series of papers terminating with Fernie & Seager 1995) and more recently by us (Hrivnak et al. 2015a). Our recent photometric study revealed several periods of 42–50 days in the combined data. The analyses of the velocity and light-curve data document the complexities of these changing and multi-periodic pulsation curves.
We next examined the combined 2007–2015 radial velocity data set for periodicity longer than that of the pulsation. The apparently complex, changing period of the short-term pulsational variations prevented us from first removing it from the velocity curves. Analysis of the combined 2007–2015 radial velocity curve yielded no evidence for a longer period in the data.
4.1.2. IRAS 18095+2704
Observations from DAO-CCD and HERMES separately revealed the same period of 103.5 days, and the combined radial velocity curve from 2007 to 2015 resulted in a pulsation period of 103.5 days. This is close to the photometric period of 102.3 days found for 2010–2013 (B. J. Hrivnak et al. 2017, in preparation). The DAO-RVS observations from 1991 to 1995 possess a period of 109.2 days, similar to the long-term (1993–2012) period in the light curve (Hrivnak et al.2015a).
The periodogram study of the combined 2007–2015 data did not reveal a longer period in the data over the nine seasons of
Table 2
Radial Velocity Data Sets and Measured Velocity Differencesa
IRAS ID Data Set Years No. á ñV ΔVR(offset)b ΔVR(HER−RVS)c ΔVR(DAO)d
Obs. (km s−1) (km s−1) (km s−1) (km s−1) 17436+5003 DAO-RVS 1991–1995 59 −53.06 L 0.0 −0.7 DAO-CCD 2007–2015 121 −51.99 −0.7 L L CORAVEL 2008–2014 105 −53.27 +0.5 L L HERMES 2009–2015 107 −53.07 L L L 18095+2704 DAO-RVS 1991–1995 47 −29.36 L −2.2 +0.8 DAO-CCD 2007–2015 78 −30.32 −1.45 L L HERMES 2009–2015 75 −31.58 L L L 19475+3119 DAO-RVS 1991–1995 38 2.13 L −1.0 −0.2 DAO-CCD 2007–2015 77 2.18 −1.2 L L HERMES 2009–2015 57 0.94 L L L 19500–1709 DAO-RVS 1991–1995 35 13.96 L −0.6 +1.1 DAO-CCD 2007–2015 46e 13.14 +0.5 L L HERMES 2009–2015 27 13.84 L L L 22223+4327 DAO-RVS 1991–1995 34 −40.52 L −0.1 +1.2 DAO-CCD 2007–2015 86 −41.66 +1.1 L L CORAVEL 2008–2014 116 −41.27 +0.15 L L HERMES 2009–2015 95 −40.55 L L L 22272+5435 DAO-RVS 1991–1995 34 −37.58 L −2.8 +3.3 DAO-CCD 2007–2015 90 −40.74 +0.5 L L CORAVEL 2008–2014 149 −39.26 −0.8 L L HERMES 2009–2015 96 −40.34 L L L 07134+1005 DAO-RVS 1991–1995 21 88.00 L −0.4 +2.4: DAO-CCD 2007–2016 53f 86.15 +2.0: L L HERMES 2009–2016 75 87.58 L L Notes. a
Uncertain values are indicated with colons (:). b
The systematic radial velocity offsets determined between the HERMES and the DAO-CCD or CORAVEL velocities. (See the text for details.) c
The systematic differences between the HERMES and the DAO-RVS radial velocity measurements. In the cases where the data could be fit by a periodic sine curve, we used the systemic velocities; otherwise, we used average velocities. (See the text for details.)
d
Difference between theΔVR(offset) for the DAO-CCD system and theΔVR(HERMES–DAO-RVS) values.
e
Excluding one observation of IRAS 19500–1709, which possessed a very deviant velocity value from the others (2015; VR=−11 km s−1).
f
Figure 1. (a) Radial velocity observations from 2007 to 2015. Symbols: filled circles (DAO-CCD), open circles (HERMES), and filled triangles (CORAVEL). (b) Radial velocity observations from 2007 to 2015. Symbols as in Figure1(a).
observations, in either of the individual data sets or the combined data set. Nor was one present in the residuals from the radial velocity curve when the period of 103.5 days was first removed. These residuals are shown in Figure2.
4.1.3. IRAS 19475+3119
An analysis of the combined 2007–2015 radial velocity curve resulted in a period of 37.1 days. Periodogram analysis of the 1991–1995 DAO-RVS observations resulted in a signifi-cant period of 47.1 days, although, if we restrict the analysis to the first three of these seasons, when almost all of the observations were made, a period of 39.0 days is found. Periodicities in the light curve range from 35 to 43 days, similar to what is seen in the velocity curves. We further investigated the combined data for evidence of a longer period but none was found. Nor was one found when we first removed the 37.1 day periodicity. We also found a null result when analyzing only the higher-precision HERMES data.
4.1.4. IRAS 19500–1709
This object is rather far south for observations from DAO and the observing season is relatively short from both telescopes. Consequently, the number of observations from each site is more limited. The velocity variation for this star is larger than the others, with a range of 21 km s−1. Separate analyses of the DAO-CCD
and the HERMES velocities resulted in periods of 42.6 and 38.0 days, respectively. Note that these values are 1 year aliases of each other. The analysis of the combined data set yielded periods of 42.5 or 38.1 days, with the former being the stronger. The periods found from the photometric data from 2002 to 2007 are 38.3 and 42.4 days (Hrivnak et al.2010), the same periods present in the radial velocity data. The DAO-RVS radial velocity data from 1991 to 1995 were examined and found to be fitted well with a period of 38.5 days, similar to a period found in the HERMES data and the photometry. Thus all of the radial velocity and photometry data reveal consistent pulsation periods. No longer-term periodicity was found in the 2007–2015 data set, even when we first removed the pulsation period of 42.5 days.
Figure 2. Residuals from the pulsation fits to the combined 2007–2015 data. Shown are the sine curve fits to the residuals of IRAS 22223+43427 (P=814 days,
4.1.5. IRAS 22223+4327
This object was observed at all three sites and the velocities yielded similar periods; the combined data set yielded pulsation periods of 86.3 and 91.0 days. These are similar to the periods of 86.7 and 89.7 days determined from the 2003–2011 light curves (Hrivnak et al.2013). The earlier 1991–1995 DAO-RVS radial velocity data set has a period of 88.8 days, approximately the average value of the two periods found in the more recent data sets.
This combined data set was examined for longer-term periodicity that might be attributed to a binary orbit. The periodogram analysis of the 2009–2015 data suggested a period of 770 days that almost met the significance criterion; it had S/N=3.9 (4.0 is the minimum considered significant). However, when we examined the longer 2007–2015 data set, the resultant period, 810±20 days, was less significant (S/N=3.6). Analyzing the velocity curves from the indivi-dual observing sites showed a period of ∼800 days to be found in the CORAVEL data and the HERMES data, but to be formally significant only in the CORAVEL 2009–2014 data set. In Figure2is shown the sine curve fit to the residuals of the combined 2007–2015 radial velocity curve with the periods of 86.3 and 91.0 days first removed. The longer-term period has a velocity semi-amplitude of only 0.9±0.1 km s−1. This can be
compared to the full range of the combined data of 13 km s−1
and the range of the residuals following the removal of the pulsations, which is 9.5 km s−1
. While the fit follows the higher residuals of the 2009, 2011, 2013–2014 velocities and the more negative residuals of the 2010 and 2012 data, it is not a good fit to the the more positive residuals in 2008 and 2015. Thus there is a suggestion of a longer period of ∼800 days in the radial velocity data of IRAS 22223+4327, but it is not formally significant.
4.1.6. IRAS 22272+5435
This object was also observed at all three sites and similar periods were found in all three data sets. With the combined data set, two dominant periods of 66 and 135 days and a weaker but significant period of 162 days were determined. A period analysis of the 1991–1995 radial velocity data reveal a period of 124 days. The light curves have consistently shown periods of 131 and 126 days (Hrivnak et al.2013).
Visual inspection of the 2007–2015 radial velocity curve shows that the average velocities are larger on some years than others, with the velocities on the even years 2008, 2010, 2012, and 2014 being more positive, both in the combined and the individual data sets. Additional periodogram analysis of the 2007–2015 radial velocity curve revealed, in addition to the pulsation periods, a longer period of 710±20 days that just meets our significance criterion (S/N=4.0). Searching for this in the individual radial velocity sets revealed a significant period of ∼830 days in the HERMES data, the suggestion of a period of ∼700 days in the DAO-CCD data, but no indication of such a long period in the CORAVEL data. Thus there is marginally significant evidence for a period of ∼2 years in the combined data from 2007 to 2015 for IRAS 22272+5435. This is shown in Figure 2, where we have displayed the sine curve fit of this period to the residuals of the combined velocity curve after the removal of the three shorter, more dominant periods. The velocity semi-amplitude is only 0.7±0.1 km s−1. This is
a small fraction of the full range of the combined data,
10 km s−1, and of the range of the residuals following the
removal of the pulsations, 8 km s−1 (if we neglect one point
that is +2 km s−1 larger than the others).
The fit of this period to the seasonal variations in velocities is reasonably good, though the scatter in the residuals is still large (σ=1.3 km s−1). Much of this is due to the irregular
amplitudes of the pulsation, which are seen in the light and velocity curves. So for IRAS 22272+5435, there is a longer period (710 days) that is formally significant. In Section5, we explore the implications of a two-year period that may be due to a binary companion.
4.1.7. IRAS 07134+1005
The radial velocity of this object varies over a range of 15 km s−1
. When investigated separately, no significant period was found in the HERMES radial velocities, but a marginally significant period of 83.2 days was found in the DAO-CCD data. These data sets were then combined, although the systematic offset was rather uncertain (+2.0 ± 1.0 km s−1).
No significant periods were found in the combined radial velocity curve over the entire interval of 2009–2016, either shorter-term ones due to pulsation or longer-term ones that might indicate a binary behavior. The 1991–1995 DAO-RVS data set is small, with only 21 observations and 11 of them in the 1991–1992 observing season. A period of 145 days was found for the entire data set and a period of 197 days in the 1991–1992 season for this small sample. Previous light and velocity curves suggested periods in the range of 35–45 days (Barthès et al.2000; Hrivnak et al.2010).
The pulsations of these low-gravity stars induce complex atmospheric differential motions. A detailed study of the atmospheric motions of IRAS 07134+1005 was presented by Lèbre et al. (1996)and modeled by Fokin et al. (2001). These studies showed that complex atmospheric motions produce line profile asymmetries, making the detection of orbital motion with a low amplitude difficult.
4.2. Long-term, Multi-decade Variations
Figure3shows a composite of the long-term radial velocity data for all seven objects, including the 1991–1995 observa-tions. We would like to use these data to investigate longer-term, multi-decade variations in the radial velocities that might be due to a longer period binary. We started by comparing the DAO-RVS radial velocity values from 1991 to 1995 with the HERMES values from 2009 to 2015 for the objects, to see if there were significant differences that arose during the gap in observations of 14 years. (The combined 2007–2015 values, with systematic offsets included, are similar the the HERMES values.) For most of the objects, we had determined periodic variations in the data sets, and so we compared the systemic velocities of the 1991–1995 data set with the 2009–2015 data set. For the two in which we were not able to do this (IRAS 17436+5003, 07134+1005), we simply used the average values. In Table2(col. 7) are listed the differences, in the sense of the HERMES–DAO-RVS velocities. They range from −2.8 to 0.0 km s−1, and are particularly large for IRAS 22272+5435
(−2.8 km s−1)
and IRAS 18095+2704 (−2.2 km s−1).
The interpretation of this comparison between the 1991–1995 and the 2009–2015 data sets is, however, complicated by our recognition that systematic offsets can
arise between different radial velocity observing systems. This was evidenced even when comparing the HERMES, DAO-CCD, and CORAVEL data sets that were observed contem-poraneously. In Table 2 (col. 6) are listed the systematic velocities offsets that were determined between the HERMES and the DAO-CCD systems for each of these stars. As noted earlier, they range from −1.45 to +2.0: km s−1.
Since the DAO-RVS observations were made with a different telescope-spectrograph-detector system at a different time than the 2007–2015 observations, there is no direct way
to distinguish between a significant systematic offset and a long-term, multi-decade variation in the radial velocities. Nevertheless, we attempted to investigate this by comparing the DAO-RVS and DAO-CCD measurements to get a sense of whether the above differences between the HERMES and DAO-RVS measurements are larger than expected. Suppose that we assume that the velocity offsets between the DAO-CCD and HERMES systems and the DAO-RVS and HERMES systems would be expected to be similar in value. The basis for such an assumption might be that they both use the same DAO
Figure 3. Long-term radial velocity study, comparing the 1991–1995 and the 2007–2015 values. Symbols: filled squares (DAO-RVS), filled circles (DAO-CCD), open circles (HERMES), and filled triangles (CORAVEL). Other values from the literature from 1996 to 2006 are plotted as open triangles.
telescope and spectrograph, albeit with different detectors, over a relatively small wavelength range in the blue part of the spectrum. We then compared the differences between the measured HERMES and DAO-RVS velocities (col. 7) to the previously determined HERMES and DAO-CCD offsets (col. 6). These differences are listed in column 8 of Table2. In this case, IRAS 18095+2704 no longer stands out, and the differences between the DAO-RVS and HERMES values are generally similar to the differences between the DAO-CCD and HERMES values (ranging from −0.7 to +1.2 km s−1 except
for two outliers. These are IRAS 22272+5435, for which the DAO-RVS difference remains large, +3.3 km s−1, even when
compared to the DAO-CCD values, and IRAS 07134+1005, for which the value is large, approximately +2.4 km s−1, but
uncertain.
Thus, we are not able to determine with certainty if the differences between the 2009–2015 HERMES and the 1991–1995 DAO-RVS measurements represent real differences in the motion of the PPNe or if they arise from systematic effects found between the different systems. The fact that the differences are all 0.0 km s−1suggests the presence of a real,
negative systematic offset. The average difference between the Hermes and the DAO-RVS values is −1.0±0.4 km s−1,
changing to −0.7±0.3 km s−1 if we neglect IRAS 22272
+5435. Only for IRAS 22272+5435 is the difference both well-determined and much larger than that found for any of the other well-determined empirically measured offsets. Thus for IRAS 22272+5435 there remains the suggestion of a real, multi-decadal difference in radial velocity.
5. Discussion and Conclusions
We have carried out a long-term observational study of a sample of seven bright PPNe. They have been examined over several timescales, and several results have been found thus far. 1. Pulsation periods of 35–135 days have been found for
each of them.
2. Evidence for multi-year periodic variations is weak, with only two of the objects showing suggestions of this (P≈2 years) at a level just at or below the significance criteria. And in these two cases, the amplitudes are very small (<1.0 km s−1), and the results were seen in only
some of the data sets. Thus the PPNe clearly differ from the post-AGB binary “disk” sources, in which the pulsations and binary motions are clearly distinguished and separable (Manick et al. 2017).
3. Evidence for multi-decade variations is seen in one of the objects, IRAS 22272+5435. However, as discussed above, the interpretations of the difference between the early and later data sets is tempered by the empirical measurement of systematic differences (offsets) among the three recent contemporaneous data sets. The larger, multi-decade variation observed in IRAS 22272+5435 might indeed be real, but will require continued long-term observations with the same or a similar instrument to confirm.
What are the implications of a two-year period of small amplitude? In the best case for a multi-year periodic variability due to a binary companion, IRAS 22272+5435, the observed values are P=710±20 days with semi-amplitude K=0.7±0.1 km s−1. The visible-band HST image of this
object shows a bipolar or multipolar nebula (Ueta et al.2000).
A mid-infrared study indicates a bipolar morphology with a torus, and this has been modeled by Ueta et al. (2001), who deduced an inclination of the torus of 25°±3°. If we assume that the torus is caused by a binary companion orbiting in the same plane, then we can calculate the mass of the secondary star (M2). If we assume MPPN=0.62 Meand a circular orbit, then
the secondary has the very low mass of 0.053±0.006 Me.
Exploring a wide range for the mass of the PPN, one finds that for these parameters, if MPPN=0.50 Methen M2=0.046 Me,
and if MPPN=0.80 Methen M2=0.063 Me. These M2values are appropriate masses for late-M spectral type dwarf stars (Baraffe & Chabrier 1996). If we generalize and assume that K=1.0 km s−1, P=2 years, M
PPN=0.62 Me, and a circular
orbit, then for various inclinations we find very low to low values for M2ranging from 0.032 Mefor i=90°, to 0.066 Me
for i=30°, to 0.14 Mefor i=15°.
There are also astrophysically important implications for the radius of the orbit with a two-year period. Again assuming a circular orbit, the radius of the orbit is ∼300 Refor M2within the ranges of 0.03–0.14 Mefound above. This would put the
secondary at about or within the radius of the PPN progenitor on the tip of the AGB (∼400 Re), and thus could lead to a
spiraling in of the secondary due to the loss of angular momentum as it orbits within the tenuous atmosphere of the AGB star (Nie et al.2003).
One can also explore the evidence for multi-decadal change in the radial velocity of IRAS 22272+5435, the one object that shows a large difference in its average velocities between the recent (2007–2015) and the early (1991–1995) measurements. Let us assume for the moment that the change of 2.8 km s−1
represents a real change and is not due to a systematic effect, as has been seen at lower levels among the recent data sets. Assuming a circular orbit, the gap of 11 years in our observations is too short for the system to have gone through a half cycle in that interval when compared to the nine-year interval from 2007 to 2015 in which the observations are at a fairly constant level. Thus the associated period must be on the order of or longer than twice the time interval of 18 years between the middle points of each of the recent and early data sets. If we assume a period of 36 years and a semi-amplitude of 1.4 km s−1, then for M
PPN=0.62 Me in a circular orbit with
i=25°, M2=0.36 Me. This would imply a situation in which
the secondary is of low mass and at a separation of ∼11 au or ∼2300 Refrom the PPN.
Of course, one might speculate that IRAS 22272+5435 or one of the other objects might be a binary with a very elliptical orbit, which makes an extreme excursion in velocity during the gap of 11 years (1996–2006) between our early and recent observations. Such a situation was recently illustrated for the central object BD+30° 623 of the PN NGC 1514. Observations of that object made over a two-year interval showed no evidence of binary motion, while observations over an eight-year interval revealed a nine-eight-year period orbital period with an eccentricity of 0.46 (Jones et al. 2017). To address this possibility, we have also plotted in Figure 3 velocity values from the literature8that fall into the gap between our early and recent velocity measurements. These each have a precision of
8
IRAS 17436+5003: Kipper (2007), Takeda et al. (2007); IRAS 19475 +3119: Klochkova et al. (2002); IRAS 19500–1709: Klochkova (2013); IRAS 22223+4327: Klochkova et al. (2010); IRAS 22272+5435: Reddy et al. (2002), Začs et al. (2009); IRAS 07134+1005: Van Winckel & Reyniers (2000), Hrivnak & Reddy (2003), Klochkova et al. (2007).
1 km s−1. We have not used these in the analysis because we
have no way to measure possible systematic effects in the velocity systems, which as we have seen might be as large as±2 km s−1. Nevertheless, with that in mind they do provide
some constraints on the velocities during that 11 year gap. These velocities are all consistant with our observations; none show a large variation that might suggest an elliptical orbit. For IRAS 07134+1005, they fill in the gap, precluding any large excursions in velocity, and for IRAS 22223+4327, 19500–1709, 19475+3119, and 22272+5435, they partially fill in the gap, making large excursions less likely. They have little to no effect on the gaps in IRAS 17436+5003 and 18095 +2704. Thus while these do not rule out the possibility of a highly eccentric orbit in all cases, it is highly unlikely that elliptical orbits with periods of less than 25–30 years exist for many, if any, of these objects.
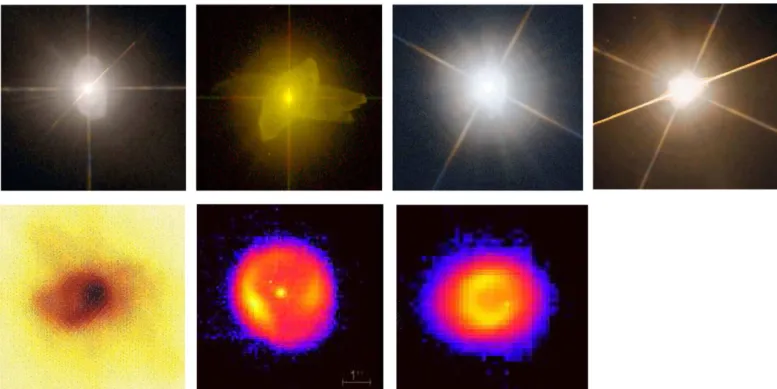
In Figure4, high-resolution visible (HST) or mid-IR images of the seven sources are shown. They are each clearly bipolar or multipolar with bright central stars. In our previous study of these seven PPNe, we discussed the possibility that our targets are biased toward low inclination as a result of our choice to observe those with bright central stars (Hrivnak et al. 2011), since those at higher inclinations would be more likely to be obscured. However, published modeling of their envelopes based on mid-IR observations and the appearance of the nebula in HST images indicate that this is not the case in general, and suggests that some, and likely most, of them are at intermediate inclinations (see Hrivnak et al.2011for details). In this earlier study, we showed that even without knowing the inclinations of the objects, significant limiting values of P and M2could be determined for undetected companions. These indicated that any undetected companions must have low masses (M2<0.2 Me) or be in long-period orbits (P>20 years).
These were based on assuming an upper limit for the undetected velocity semi-amplitude of 2.0 km s−1. The present
study reinforces these results, implying even lower masses and/or longer periods since the upper limit of the velocity semi-amplitudes appear to be on the order of 1.0–1.4 km s−1
for a circular orbit.
We conclude this study with the question with which we began. Where are the binaries? Several alternatives come to mind as a result of this study, and we list them below with a brief assessment.
1. They are present but perhaps hidden in long-period (>30 year) orbits.
2. They are present but perhaps hidden due to the low mass of the secondaries (<0.2 Me), which might even be
planets.
3. They are present but hidden inside the atmosphere of the F−G star—unlikely due to timescale arguments for spiraling in, which are on the order of the dynamic timescale of a few years, followed by the ejection of the atmosphere in a common envelope phase.
4. They are merged with the central star—but there is no evidence to support this. They appear as normal post-AGB stars and are not rapid rotators, as documented by their high-resolutions spectral studies and the widths of their cross-correlation profiles.
5. They are absent and these PPNe are evolving as single stars.
The observational evidence presented in this study, based on precise radial velocity measurements of PPNe, does not provide direct support for binary companions. These PPNe are in clear contrast to the post-AGB “disk” sources studied by Van Winckel and collaborators, which all appear to be binaries and
Figure 4. High-resolution visible HST and mid-infrared images of the seven objects in this study, taken from the literature. Top row (left to right): IRAS 17436+5003, 19475+3119, 22223+4327, 22272+5435 (Balick et al.;https://faculty.washington.edu/balick/pPNe/). Bottom row (left to right): IRAS 18095+2704 (Ueta et al.
possess well-measured periods in the range of ∼120–1500 days. It is these “shell” source PPNe that would be expected to evolve into PNe; however, they do not appear to be the progenitors of the short-period (1 day) central stars found in many ( 20%) PNe, which are thought to have gone through a common envelope phase. Thus the progenitors of these short-period binary central stars of PNe remain as yet unidentified. Disclosing the evolutionary links between samples of known PPNe and PNe is made difficult due to the observational biases and the lack of well-constrained distances. To prove or exclude the presence of binaries is crucial to our understanding of the way(s) that bipolar PPNe and PNe form. If it turns out that these PPNe are not binaries, then it raises the possibility that there may be more than one way to produce bipolar PNe. If, on the other hand, one argues that these objects do not evolve into PNe, then we are left without good candidates for the immediate progenitors of PNe.
We finally conclude this study by listing suggestions for further progress in answering this important question of the binary nature of PPNe and the necessity of a binary companion to shape the nebulae. One can continue to observe these seven PPNe with the same or similar instrumentation to investigate the suggested 2 year periodicity and the decadal shift in velocities, especially for IRAS 22272+5435. This might be best carried out by using only the higher-precision HERMES measurements. One can improve our analysis with a better selection of lines to probe deeper into the star where the effects of pulsation are lessened. One can also observe a different sample of edge-on PPNe, where one would see the full impact of the velocity along the line of sight. Then there would be no uncertainty about the inclination of the bipolar axis with respect to the plane of the sky. Bipolars with tight, obscured waists would particularly seem to be best explained by a binary interaction. However, in such objects, the central star is then obscured by a dusty torus. We have initiated such a study of three edge-on PPNe for which the central star is obscured in visible light but seen in the near-infrared. Only a few infrared spectra have been obtained thus far and their study requires 8 m class telescopes.
B.J.H. acknowledges ongoing support from the National Science Foundation (most recently AST 1009974, 1413660). J.S. acknowledges support of the Research Council of Lithuania under the grant MIP-085/2012. This research is based in part on observations obtained at the Dominion Astrophysical Observatory, NRC Herzberg, Programs in Astronomy and Astrophysics, National Research Council of Canada. It is also based in part on observations made using the Mercator Telescope, operated on the island of La Palma by the Flemish Community, situated at the Spanish Observatorio del Roque delos Muchachos of the Instituto de Astrof´isica de Canarias. We used data from the HERMES spectrograph, supported by the Fund for Scientific Research of Flanders (FWO), the Research Council of K.U. Leuven, the Fonds National Recherches Scientific (FNRS), the Royal Observatory of Belgium, the Observatoire de Genève, Switzerland, and the Thringer Landessternwarte Tautenburg, Germany. This research has been conducted in part based on funding from the Research Council of K.U. Leuven (GOA/13/012) and was partially funded by the Belgian Science Policy Office under contract BR/143/A2/STARLAB. We thank the referee for raising several points for consideration that added to the
completeness of the discussion. This research has made use of the SIMBAD database, operated at CDS, Strasbourg, France, and NASA’s Astrophysical Data System.
Appendix
Emperically Determined Offsets between the Different Radial Velocity Systems
As we found and discussed in an earlier paper (Hrivnak et al.
2013), the presence of small but systematic velocity differences exist between the different telescope–spectrograph–detector systems with their associated methods of fitting of the cross-correlation profiles, and these differ for each star. In the present study, we therefore determined empirical adjustment offsets to correct this by comparing the measured velocities for each star in the different systems. These were determined by three methods, and we then applied the one(s) that was most secure for a particular object. (1) Since these stars are known to vary in velocity over a timescale of weeks or months due to pulsation, we looked for instances when a star was observed with two different systems on the same or adjacent nights. From these we determined the differences between the observed velocities on the two systems. (2) We searched for periodicities in the radial velocity data sets for each star in the different systems. Where they were found, we fitted the velocities with sine curves and then compared the systemic velocities to determine systematic differences between the two systems for that star. (3) We compared the average velocities for a star as observed on the different systems over the same time interval, 2009–2015. This last method gave us reasonably well-determined values for most of the objects, but since the distributions of nights are not the same, the determined systematic offsets are not as secure as the other methods for these pulsating objects, especially when there were not a lot of observations. This is particularly the case for IRAS 07134 +1005 and 19500–1709; for the latter of these, the problem is exacerbated by the relatively large range of velocities for this star.
We then examined the results of the offsets determined by each of these three methods, and chose the best-determined one to use for each star. The offsets for IRAS 18095+2704, 19500-1709, and 22223+4327 were determined by method 2. For IRAS 17436+5003 we used method 1, for IRAS 19475+3119 we used a combination of methods 2 and 3, and for IRAS 22272+5435 we used the averages of the similar values determined from methods 1 and 2. For IRAS 07134+1005, for which we found very different values from methods 2 and 3, we used a combination of the two; this one was the must unreliable. These empirically determined offsets were then added to the system velocities to combine the 2007–2015 data for each star. We chose to express the values of the offsets with respect to the HERMES telescope–spectrograph–detector system because this system is the most precise and its velocities are based on a large wavelength range. We estimate the uncertainties in these empirically determined offsets to be ±0.7–1.0 km s−1 for the poorly determined value for IRAS
07134+1005, <±0.5 km s−1 for the well-determined values
for IRAS 17436+5003 and 22272+5435, and ±0.5 km s−1for
the other four (IRAS 18095+2704, 19475+3119, 19500–1709, 22223+4327).
ORCID iDs
Bruce J. Hrivnak https://orcid.org/0000-0003-1471-8892
Hans Van Winckel https://orcid.org/0000-0001-5158-9327
Julius Sperauskas https://orcid.org/0000-0003-0931-7744
David Bohlender https://orcid.org/0000-0003-0936-5578
References
Arellano Ferro, A., Giridhar, S., & Mathias, P. 2001,A&A,368, 250
Arkhipova, V. P., Ikonnikova, N. P., & Komissarova, G. V. 2010, AstL,
36, 269
Arkhipova, V. P., Ikonnikova, N. P., & Komissarova, G. V. 2011, AstL,
37, 635
Balick, B., & Frank, A. 2002,ARA&A,40, 439
Baraffe, I., & Chabrier, G. 1996,ApJL,461, L51
Barthès, D., Lèbre, A., Gillet, D., & Mauron, N. 2000, A&A,359, 168
Bond, H. E. 2000, in ASP Conf. Ser. 199, Asymmetrical Planetary Nebulae II Origins to Microstructures, ed. J. H. Kastner, N. Soker, & S. Rappaport (San Francisco, CA: ASP),115
Breger, M., Stich, J., Garrido, R., et al. 1993, A&A,271, 482
Bujarrabal, V., Castro-Carrizo, A., Alcolea, J., & Van Winckel, H. 2015,A&A,
575, L7
Burki, G., Mayor, M., & Rufener, F. 1980, A&AS,42, 383
De Marco, O. 2009,PASP,121, 316
De Marco, O., Long, J., Jacoby, G. H., et al. 2015,MNRAS,448, 3587
Fernie, J. D., & Seager, S. 1995,PASP,107, 853
Fletcher, J. M., Harris, H. C., McClure, R. D., & Scarfe, C. D. 1982,PASP,
94, 1017
Fokin, A. B., Lèbre, A., Le Coroller, H., & Gillet, D. 2001,A&A,378, 546
García-Segura, G., Langer, N., Róz¨ycka, M., & Franco, J. 1999,ApJ,517, 767
García-Segura, G., López, J. A., & Franco, J. 2005,ApJ,618, 919
Hillen, M., Van Winckel, H., Menu, J., et al. 2017,A&A,599, 41
Hillwig, T. C., Frew, D., Reindl, N., et al. 2017,AJ,153, 24
Hillwig, T. C., Jones, D., De Marco, O., et al. 2016,ApJ,832, 125
Hrivnak, B. J., Kwok, S., & Volk, K. M. 1989,ApJ,346, 265
Hrivnak, B. J., Lu, W., Maupin, R. E., & Spitzbart, B. D. 2010,ApJ,709, 1042
Hrivnak, B. J., Lu, W., & Nault, K. A. 2015a,AJ,149, 184
Hrivnak, B. J., Lu, W., Sperauskas, J., et al. 2013,ApJ,766, 116
Hrivnak, B. J., Lu, W., Volk, K., et al. 2015b,ApJ,805, 78
Hrivnak, B. J., Lu, W., Wefel, K. L., et al. 2011,ApJ,734, 25
Hrivnak, B. J., & Reddy, B. E. 2003,ApJ,590, 1049
Jacoby, G. H., Long, J., Kronberger, M., De Marco, O., & Hillwig, T. C. 2016, American Astronomical Society, AAS Meeting 227,238.01
Jones, D., & Boffin, H. M. J. 2017,NatAs,1, 0117
Jones, D., Boffin, H. M. J., & Rodrìguez-Gil, P. 2015,A&A,580, A19
Jones, D., Van Winckel, H., Aller, A., Exter, K., & De Marco, O. 2017,A&A,
600, L9
Kipper, T. 2007, BaltA,16, 191
Klochkova, V. G. 1995,MNRAS,272, 710
Klochkova, V. G. 2013,AstL,38, 765
Klochkova, V. G., Chentsov, E. L., Tavolganskaya, N. S., & Shapovalov, M. V. 2007,AstBu,62, 162
Klochkova, V. G., Panchuk, V. E., & Tavolganskaya, N. S. 2002,AstL,28, 49
Klochkova, V. G., Panchuk, V. E., & Tavolganskaya, N. S. 2010, ARep,
54, 234
Lagadec, E., Verhoelst, T., Mékarnia, D., et al. 2011,MNRAS,417, 32
Lèbre, A., Mauron, N., Gillet, D., & Barthès, D. 1996, A&A,310, 923
Lenz, P., & Breger, M. 2005,CoAst,146, 53
Likkel, L. 1989,ApJ,344, 350
Liu, Z., Stanghellini, L., & Karakas, A. (ed.) 2017, in IAU Symp. Ser. 323, Planetary Nebulae: Multiwavelength Probes of Stellar and Galactic Evolution (Cambridge: Cambridge Univ. Press)
Luck, R. E., Bond, H. E., & Lambert, D. L. 1990,ApJ,357, 188
Manick, R., Van Winckel, H., Kamath, D., Hillen, M., & Escorza, A. 2017,
A&A,597, A129
Miszalski, B., Acker, A., Moffat, A. F. J., Parker, Q. A., & Udalski, A. 2009,
A&A,496, 813
Miszalski, B., Manick, R., Mikołajewsia, J., et al. 2017, arXiv:1703.10891
Nie, J. D., Wood, P. R., & Nicholls, C. P. 2003,MNRAS,423, 2764
Omont, A., Loup, C., & Forveille, T. 1993, A&A,267, 515
Raskin, G., Van Winckel, H., Hensberge, H., et al. 2011,A&A,526, 69
Reddy, B. E., & Hrivnak, B. J. 2003,ApJ,590, 1049
Reddy, B. E., Lambert, D. L., Gonzalez, G., & Yong, D. 2002,ApJ,564, 482
Sahai, R., Morris, M., Sánchez Contreras, C., & Claussen, M. 2007, AJ,
134, 2200
Sahai, R., & Trauger, J. Y. 1998,AJ,116, 1357
Sahin, T., Lambert, D. L., Klochkova, V. G., & Tavolganskaya, N. S. 2011, A&A, 458, 173
Siódmiak, N., Meixner, M., Ueta, T., et al. 2008,ApJ,677, 382
Soker, N. 2004, in ASP Conf. Ser. 313, Asymmetrical Planetary Nebulae III Winds, Structure, and the Thunderbird, ed. M. Meixner, J. H. Kastner, B. Balick, & N. Soker (San Francisco, CA: ASP),562
Sperauskas, J., Bartašiūtė, S., Boyle, R. P., et al. 2016,A&A,596, A116
Takeda, Y., Taguchi, H., Yoshioka, K., et al. 2007,PASJ,59, 1127
Ueta, T., Meixner, M., & Bobrowsky, M. 2000,ApJ,528, 861
Ueta, T., Meixner, M., Hintz, P., et al. 2001,ApJ,557, 831
Van Winckel, H. 2003,ARA&A,41, 391
Van Winckel, H., Jorissen, A., Exter, K., et al. 2014,A&A,563, L10
Van Winckel, H., Lloyd Evans, T., Briquet, M., et al. 2009,A&A,505, 1221
Van Winckel, H., & Reyniers, M. 2000, A&A,354, 135
Začs, L., Musaev, F., Kaminsky, B., et al. 2016,ApJ,816, 3