ANALYSIS OF VSTOL AIRCRAFT
CONFIGURATIONS FOR
SHORT HAUL AIR
TRANSPORTATION SYSTEMS
R. Gallant
M. Scully
W. Lange
pppp-*1
ARCHIVES
MRCHNVES
MASSACHUSETTS INSTITUTE OF TECHNOLOGY Flight Transportation Laboratory
Technical Report FT-66-1 November 1966
Analysis of VSTOL Aircraft Configurations for Short Haul Air Transportation Systems
R. Gallant M. Scully W. Lange
This report was performed under Contract C-136-66 for the Department of Commerce, Office of High Speed Ground Transport.
CONTENTS
Page
1 I. Introduction
5 II. Discussion of Results
8 III. Aircraft Design Procedures 8 111-l. General
8 a) Atmospheric Model 9 b) Turbo-Shaft Engines 10 c) Cruise Turbofan Engines
12 d) Direct Operating Cost Program 16 111-2. Tilt Wing Jet Lift and STOL Aircraft
16 a) Tilt wing, Jet Lift and STOL Aircraft Computer Design Programs
45 b) Component Weight Formulas 50 111-3. Rotary Wing Aircraft
50 a) Rotary Wing Aircraft Design Studies 55 b) Computer Design Procedures
66 c) Performance - Fuel Burn
74 d) Component Weights
81 IV. Discussion of Aircraft Designs
81 a) Optimization of Tilt Wing, Jet Lift, and STOL Aircraft
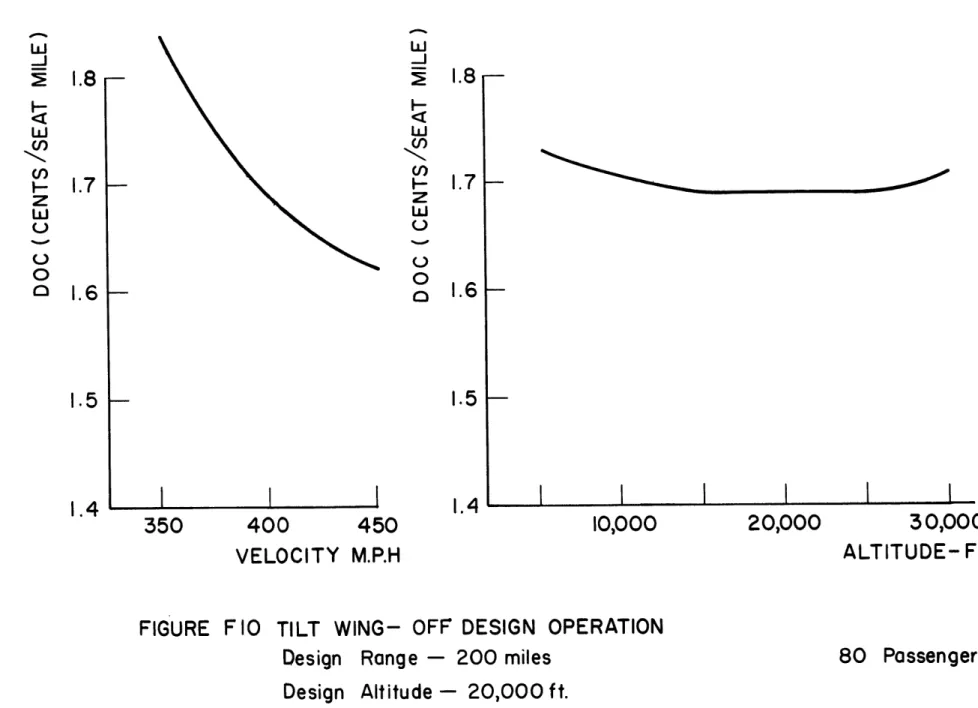
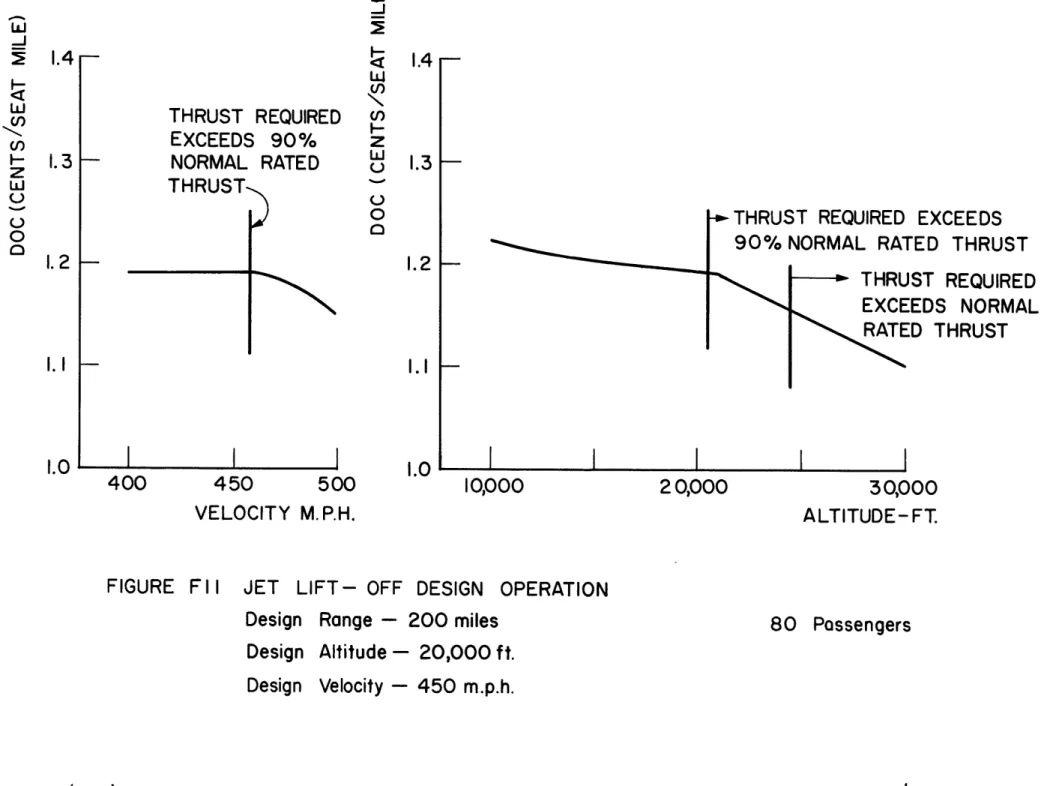
82 b) Off Design Operation
85 c) Fuselage Parametric Analysis 86 d) Tilt Wing Aircraft Transition
98 e) Design Variations of the Tilt Wing Aircraft 108 f) Tilt Wing STOL
110 g) Multiple Hops Operations 112 h) Rotary Wing Aircraft 114 V. References
I. INTRODUCTION
The potential of air transportation as a means of filling the growing need for a mass short haul trans-portation system was investigated in Ref. 1 where all aspects of short haul air transportation systems were examined in some detail. It was concluded that air transportation could provide a promising means of relieving the congestion associated with the heavy vehicular ground traffic encountered on our urban access routes and at a cost which could well be com-petitive in the 1970 period with surface transportation systems. This conclusion was postulated on the basis of existing developments in the aircraft industry not yet put into practice on operating airlines but whose feasibility has been well demonstrated with experimen-tal units.
Among the many aspects of the total system which must be examined in arriving at such a conclusion are the flight vehicle characteristics. The direct operating costs (DOC) of these vehicles was chosen as a measure of their effectiveness. In short haul operations the direct costs are frequently less important than indirect
costs in determining total transportation costs and hence ticket price. However the DOC is a convenient measure for estimating the relative performance of
different vehicle configurations and of the penalties associated with operation off optimum conditions. Furthermore, the previous study (Ref. 1) had quanti-fied the almost obvious need in short haul transpor-tation for a vehicle capable of operating from highly congested areas and requiring a minimum in take-off, landing or cleared approach areas. This need directed attention to the newer concepts of vertical take-off and landing (VTOL) aircraft which would not have the speed limitation of present day helicopters, the only VTOL aircraft currently in commercial operations.
Be-cause present day experience with these aircraft indi-cates their direct operating costs to be several times that of comparable fixed wing aircraft, there has been a natural reluctance to predict future operating costs for these vehicles at a level which would make them effective other than in a high-priced specialized operation such as an airline feeder system.
Consequently, in Ref. (1), a study of the costs and operating procedures of the existing helicopter
airlines was conducted in some depth and by this means the predicted direct operating costs were removed from the realm of discussion and opinion and reduced to a matter of statistics and analysis. Maintenance costs
and lost time in air and ground maneuvering were, as
expected, important aspects of the cost problem and
these were therefore analyzed on a quantitative basis. While there may still be room for disagreement on the predicted DOC for the various vehicles considered in this study, the quantitative information on which these are based have been carefully documented in
Ref. (1) and are further substantiated in Ref. (2) for the maintenance aspects and in this report for
the vehicle characteristics such as weight, fuel burned and block speeds. This additional documentation has been considered desirable not only to confirm the pre-vious results and to explore otner promisiLig configura-tions, but also to provide a basis for rational dis-cussion of the relative merits and potentials of different vehicle configurations which all too often in the past has been conducted on a subjective rather than an objective basis.
It may be well to reiterate the conclusion of Ref. (1) that, in face of the high indirect costs inherent in short haul systems, the actual vehicle configuration is not a dominant factor in determining
total operating costs.
Any well engineered
configura-tion capable of safe all weather operaconfigura-tions would probably prove satisfactory. However the need for direct access to city centers with a minimum of land taking does indicate the desirability of VTOL. These vehicles have the potential for appreciably reducing block times, and hence costs, in the shorter legs, below 50 miles, of interest in intra urban or suburban
travel, providing present concepts of control and navigation currently under intensive development for military applications can be reduced to practice in
the more legalistic environment of commercial opera-tions.
II. DISCUSSION OF RESULTS
This report has investigated the effects of further refinements to the computer programs as used for determining the vehicle characteristics and hence DOC, and also includes studies in greater depth than was possible in Ref. (1) of the stopped and stowed rotor configuration and of a new concept of a tilt wing configuration where both the wing and rotor/ propeller can be individually tilted. This permits
lower disc loading hence reduced weights and lower costs, but in turn introduces problems associated with the accomodation of large rotors on a wing of optimum area while still maintaining sufficient stiff-ness to prevent aeroelastic instabilities. The net result is however a tilt wing of appreciably better performance than that predicted in Ref. (1).
Studies of the stowed rotor continue to show this aircraft to be a competitive configuration with DOCs of the same order as those of the helicopter at ranges above 50 miles. Unknown problems associated with
stopping, retracting and stowing the rotor continue to make the prediction of the actual DOC of these
vehicles difficult. The sensitivity of the results to these assumptions is discussed in the body of the report.
An investigation of the effects of multiple hops, typical of a line haul type operation as compared to a shuttle type operation over a given stage length indicated that the average DOC was not appreciably affected by the multiple stop operation when compared with an aircraft operating over the same shorter
dis-tance.
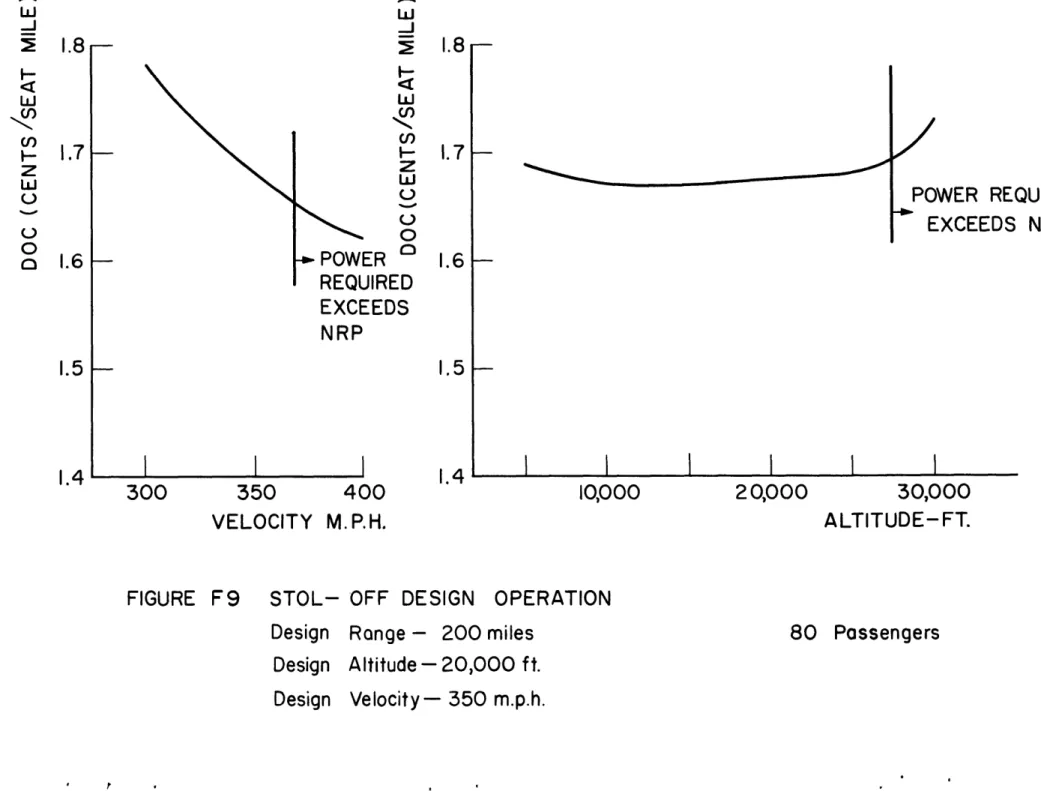
Studies of the effects of operating the aircraft off optimum speed and altitude similarly showed rela-tively little effect on the DOC indicating the high degree of operational flexibility inherent in such an
air transportation system. Operation at different al-titudes in order to reduce turbulence or minimize noise
as weather conditions, passenger comfort and community requirements may dictate is therefore entirely feasible.
An investigation was conducted to determine the capabilities of a tilt wing operating in an STOL mode and, as expected, this aircraft is a superior STOL air-craft although the advantage at the shorter range remains with the tilt wing operated as a VTOL aircraft.
Finally, a study of the effects of increasing
fuselage width to increase the number of seats abreast
while maintaining constant passenger load showed no
appreciable effect on DOC. This study was conducted
in an attempt to optimize fuselage weight and
aero-dynamic drag and indicates the relative insensitivity
of DOC to the aircraft fuselage dimensions, thus
permitting the use of a configuration with maximum
passenger appeal and which would minimize time for
loading or unloading.
In summary, the results of these studies
sub-stantiate the cost estimate prepared in Ref. (1) as
being somewhat conservative.
Continued refinement
of the computer programs and more complete optimization
studies have lowered the estimated direct operating
costs by small amounts. The general conclusions of
Ref. (1) remain substantially unchanged.
III. AIRCRAFT DESIGN PROCEDURES III-l General
a) Atmospheric Model
The ICAO standard atmosphere as presented in NACA TR 1235 is used. For hot days the temperature is increased by the same amount at all altitudes. The formulas used are as follows:
T = T T - 0.003566h (OR) .JLI p 1.233 (T/Tg)4.2561 (slug/ft3) SL
a
=
1117.
T/519.
(ft/sec)
where: T = temperature (0R)TSL = sea level temperature
TSLSTD = 5190 R std. day 0
TSL,HOT = 550 R hot day
h = altitude (ft)
a = speed of sound (ft/sec) p = pressure (slug/ft3)
b) Turbo-Shaft Engines
The power to weight ratio of the turbo-shaft engines is taken as 7.5 hp/lb at a 30-minute maximum continuous power rating and sea level, standard con-ditions. The installation factor is taken as 1.5, exclusive of fuel system. The 30-minute rating is assumed to be 1.2 times normal rated power at all times. The variation of normal rated power (NRP) with temperature and altitude is approximated by:
NRP = Kc (NRP)
c SL,STD
.55h
.15 (TSL-520)
where Kc = 30000 ~ 30
The specific fuel consumption (SFCNRP) is taken as .55 lb fuel/hp-hour at normal rated power and sea level 900 F conditions. No reduction in specific fuel consumption (SFC) with altitude and speed is assumed since an investigation of various advanced free tur-bine engine concepts indicated that the increase in SFC associated with the reduction in turbine rpm re-quired to obtain reasonable rotor and propeller effi-ciencies in forward flight approximately cancels the effects of speed and altitude. The variation of SFC
with power is approximated by:
SFC = SFC NRP j
N4RP Power used] SL, STD
c) Cruise Turbofan Engines
Cruise turbofan engines with a by-pass ratio of 2 (bypass mass flow equal to twice the gas genera-tor mass flow) are taken to have a thrust to weight ratio of 10 lb thrust/lb. of weight exclusive of thrust deflectors, at 30-minute maximum continuous rating and sea level standard conditions. The
in-stallation factor is taken as 2 including thrust deflectors. The 30-minute rating is taken at 1.2
times normal rated thrust at all times. The variation of normal rated thrust (NRTT) with temperature and al-titude is approximated by:
NRTT = LTC (NRT)SLSTD
.55h .08(TS
where
KT
[30000
30
The thrust specific fuel consumption is taken as .55 lb fuel/(lb thrust-hr) at normal rated thrust and sea level - static conditions. The variation of TSFC
with speed and altitude is approximated by:
.05h TSFC = TSFCSL,ST + .45M - 30000
where M = aircraft Mach number, h - altitude (ft),
and ST implies M=O conditions.
The jet lift engines are assumed to have a by-pass ratio of 2 with a thrust to weight ratio of 25 at 30 minute maximum continuous rating and sea level conditions. The installation factor is taken as 2. The variation of normal rated thrust with temperature
and altitude is the same as the cruise turbofan
engines. The static sea level specific fuel consump-tion is taken as 0.7. The variation of specific fuel consumption of the lift engines with speed and alti-tude is taken as
0.12V _ 0.lh
TSFC = TSFC + 20 0
SL, ST 30000
d) Direct Operating Cost Program
The direct operating cost program calculates the DOC in dollars per aircraft mile for an airborne vehicle as estimated by the methods described in Ref. (1) and further developed in Ref. (2).
It was found early in the analysis of the operating costs of these vehicles that maintenance costs would represent a major portion of the DOC and it was further established that these costs were highly dependent on the state of development of the aircraft and its components. Consequently an analy-sis was made of the subsystem maintenance costs for both existing fixed wing and rotary wing aircraft, as reported in Ref. (1). From this, estimates were made for the 1970 technology VTOL aircraft maintenance
costs. These estimates were substantiated by a de-tailed analysis of the cost and causes of all mainte-nance items over a one year period for two existing short haul airlines operating rotary wing aircraft as reported in Ref. (2).
The vehicles are powered by gas turbine engines, all of which are normally operating continuously
(ex-cept for the lift engines of the jet lift aircraft). The total direct operating costs are broken down into the following costs:
Total Flight Operations Pilot
Co-pilot Fuel and Oil Insurance
Total Direct Maintenance Airframe Maintenance a. Labor b. Materials Engine Maintenance a. Labor b. Engines
Applied Maintenance Burden
Total Depreciation Airframe Engines
Airframe Spares Engine Spares
Propellers and/or rotors Electronic Equipment
Assumptions of the input coefficients were as follows:
a) Operating crew consists of one pilot
and one copilot, paid at US domestic rates. b) Fuel is JP4 at 0.11 dollars per gallon and
6.5 pounds per gallon.
c) Oil is 6 dollars per gallon and 8.1 pounds per gallon.
d) Insurance rate is 4% of the aircraft cost per year.
e) Public liability and property damage rate is .0087 $/aircraft mile.
f) Labor rate is $3 per hour.
g) Depreciation is to a residual value of 15% for airframe, engine propellers, and airframe and engine spares.
h) Electronic equipment valued at $150,000 is fully depreciated over five years.
i) Airframe spares are assessed at 10% of the empty airframe cost.
j)
Engine spares are assessed at 50% of the total engine cost with a spare parts pricefactor of 1.5.
k) The cost of the airframe is related to the production run through an 85% learning curve, with an initial cost of $150 per pound and a development cost of $5000 per pound.
Normal values of input parameters for DOC cost studies were:
1) Distances: 10, 20, 30, 40, 50, 60, 80, 100, 200, 400 miles
2) Cost of engines: turbo shaft 300 $/lb turbo jet 150 $/lb 3) Engine time between overhauls = 4000 hrs. 4) Airframe depreciation period = 12 years
5) Vehicle utilization = 3000 hours per year 6) Production run of airframe = 300
7) Maintenance cost factor: helicopter = 1.3
(See Refs. 1 and 2)
tilt wing = 1.3
STOL = 1.1
The DOC program accepts as input from the design programs the fuel, burn, and average block speed for the set of distances less than design range. Any two parameters can be selected as variable in one run. For example, DOC versus distance can be given for
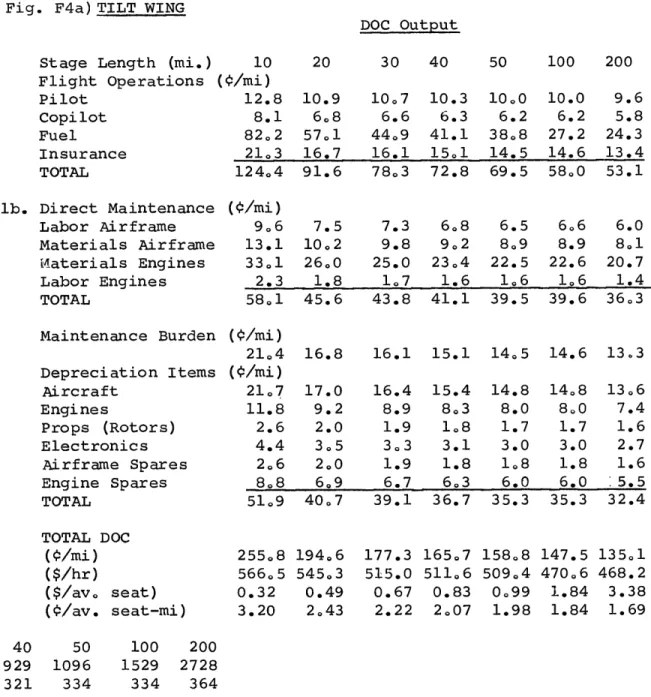
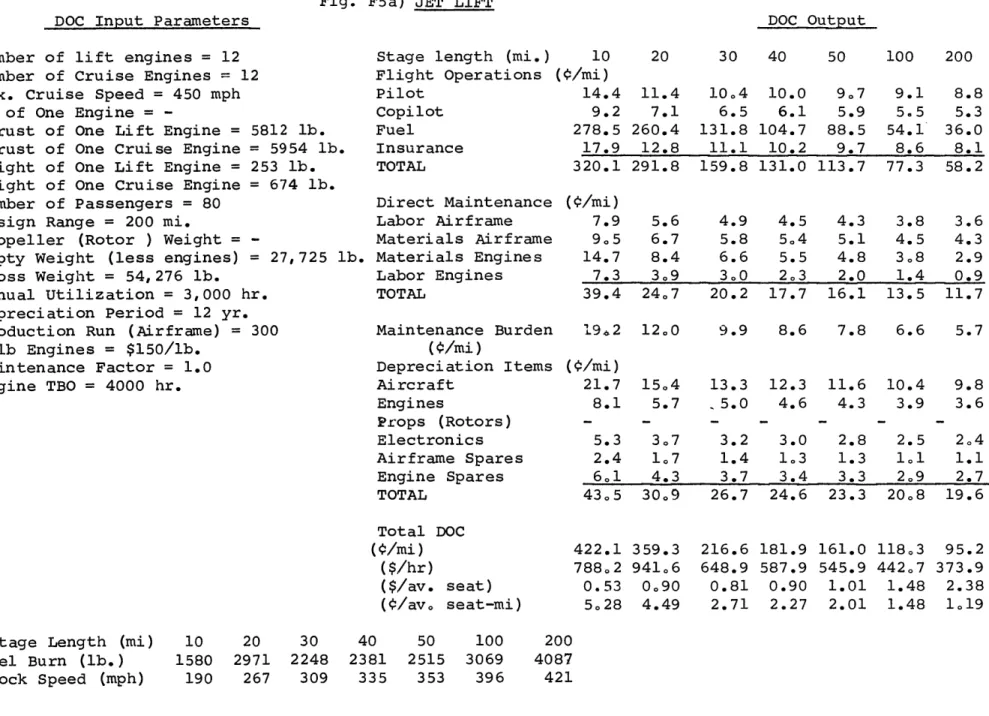
utilizations of 1000, 2000, 3000, etc. hours per year. Typical breakdowns of the DOC for all aircraft are given in Figures F4a, F5a, F6a and Figures R20, R21, and R22.
111-2 Tilt Wing, Jet Lift, and STOL Aircraft
a) Tilt Wing, Jet Lift and STOL Aircraft Computer Design Programs
The design procedure for the conventional tilt wing, jet lift and STOL aircraft is discussed in this
section. Since the design techniques are all basically the same, the three vehicles will be discussed simul-taneously. Differences in techniques will be appro-priately noted. The design information presented here supplements that given in Ref. (1).
The aircraft design is an iterative procedure. For a given payload and design range, etc., the general method is to
i) estimate a gross weight
ii) design aircraft components based upon the assumed gross weight and specified operational requirements.
iii) determine the fuel used over the design range
iv) calculate a new gross weight based upon the fuel used and component weights.
v) repeat the procedure until changes in the assumed and calculated gross weights are no more than 10 pounds.
The design of all aircraft was based upon the requirement that the aircraft was capable of taking off on a 900 F hot day at sea level. These design requirements are considered to be conservative designs for the Northeast Corridor environment. The sequential steps in the computer program are now given.
1) Aircraft Sizing
The fuselage length was based upon the number of passengers, the specified number of seats abreast, the number of main entrance doors, the number of
toilets, and a fixed length which allowed for the cockpit, nose section and tapered tail section.
The relationship used was
fuselage length no. of passengers x 2.833 no. of seats abreast
+ no. of doors x 3.7
+ no. of toilets x 4.5 + 27.5 (ft)
The length of fuselage allotted to the doors allows for clearance area. The fuselage area opposite each main door is assumed to be clear for the purpose of
an emergency door and sufficiently allows for the satis-faction of FAA emergency door requirements. The lengtY
of fuselage allotted for the toilet is considered conservative since the area opposite the toilet is not utilized. It could be used for a coat rack and package storage area. Generally, for the 80 passen-ger aircraft, 6 seats abreast, 2 entrance doors and one toilet were assumed.
For the jet lift aircraft additional fuselage length is required for the installation of lift en-gines in two engine bays located in forward and aft sections of the fuselage. It was assumed that the lift engines had an effective loading of 1000 lbs. per square foot over the horizontal cross-section of this engine bay. It was also assumed that 80% of the breadth of fuselage (inside diameter) was avail-able for lift engine installations. This would permit the installation of two engines side by side with an
aisle for walking from the cockpit to the passenger compartment. Therefore the additional length of fuse-lage necessary for the installation of lift engines is
lift engine thrust
fuselage = 1000 x .8 (breadth of fuselage)
The breadth of fuselage was based upon the number of seats abreast and a fixed value which allowed for one
aisle and seat clearances at the fuselage walls as follows.
Breadth of fuselage = 1.6 (no. of seats abreast)
+ 2.3, feet
The fuselage outside diameter is considered to be eight inches greater than the inside diameter. All aircraft were designed with a maximum of six seats abreast.
On the first pass of the design loop the wing area is determined from a guess of gross weight and wing loading. Subsequent wing areas are then deter-mined by the most recent values of gross weight and wing loading.
2) Drag Calculations
The profile drag of the aircraft, CDo, is then determined. The drag coefficient of each major air-craft component was determined independently and then summed to obtain the total profile drag coefficient. The drag accumulation takes into account interference drag, roughness and leakage. The Reynolds number used was based on cruise altitude and speed.
(i) Fuselage Drag
CD wet 1.5
__ = 1 +
Cf (1/d) 3/2 (1/d) 3
where 1 = fuselage length d = fuselage diameter
CD wet= drag coefficient based on wetted area
and Cf = friction drag coefficient based on flat plate theory
The friction drag coefficient is taken as:
C =.030
(Rnfus)
where Rn is the Reynolds number at cruise flight con-ditions
Rnfus. = (1) * (Rn/foot)
Swet g
(l)-(d)
= wetted fuselage areaS = I (d)
LO 4 = frontal area of fuselage
CDwet
r
wet]
Cf
L
o
CD Dwet , (41/d) CfC
D
Cgwhere CDo = total fuselage drag coefficient based on frontal area.
These are reduced to:
6
28
CDo = Cf 4(1/d) + (1/d)l/2 + (1/d)
based on frontal area.
(ii) Wing Drag
CDO
=
2Cf
1
+
2
-
(t/c)
+
60
-
(t/c)4]
where:
CDo is based on projected wing area, Sw.
Cf is based on wetted areas of the wing
t/c = thickness/chord ratio. If we take t/c = 0.12 .CDO = 2.48 C fwing .030 Cfwing (Rn wing) 1/7 Rwing = - (Rn/foot)
where C is the mean chord length. These are reduced to:
.0744 CDowing
- (Rn wing)1/7 based on Sw
(iii) Empennage - (includes interference drag)
CDoemp = .6 (CDowing)
based on
Sw
(iv) Nacelles - (for 4 nacelles)
CD
0fuse
(So/Sw)
+ CDowing
+ CDoemp
based on Sw
(v) CDo Total
CDo = 1.1
CDo
fuse (So/Sw)
+
CDo wing
+
CDo emp
+ CDo nacbased on
Sw
The constant of 1.1 takes into account leakage and roughness of the aircraft.
The CDo for several current commercial aircraft was determined using this model to verify its validity
and were found to compare quite well.
3) Wing Area and L/D for Cruise
Using the profile drag coefficient, the coefficient of lift, CL, which would result in maximum lift to drag ratio, L/D, for the tilt wing and jet lift aircraft in cruise was determined by:
CL
=
(CDo
I
e AR)1/2
where we have specified as input parameters
e = efficiency factor of wing
AR = wing aspect ratio
The maximum L/D was then determined by CL
L/D=max 2
CDO
Determining the CL which results in the maximum L/D will yield the optimum use of the wing at a given
speed. However, designing the wing solely on this criteria may result in too large a CL, resulting in the possibility of inadvertent wing stall due to ver-tical gusts. Therefore, whenever the calculated value
of CL is greater than 0.5, the CL is set at 0.5 and the corresponding L/D is determined by
CL, CL L/D = CDo + CDi
where
CD 2 CD = induced drag = 'i eARFor the STOL aircraft the coefficient of lift was determined by
WL
CL
1/2
2
LVcr
where
WL = wing loading is fixed by takeoff con-siderations
P is the density at cruise altitude Vcr is cruise velocity.
Whenever CL is greater than 0.5 it is reset to 0.5. Since the wing loading is fixed, the cruise velocity is then increased to the value which will satisfy the CL equation above. The lift to drag ratio is then com-puted by
CL L/D =
4) Thrust Requirements
The cruise drag equals cruise thrust for the STOL, therefore,
Thrustcr = 1/2) V2 r CD Sw where CD = CDo + CDi
An improved value of wing area and wing loading for the tilt wing and jet lift aircraft is now com-puted by Gross Weight
1/2
Vcr CL
W WL Gross Weight W9 Wing Area SwFor the jet lift aircraft, the cruise thrust requirement is simply determined by the cruise drag.
Thrustcr = 1/2 V2 CD Sw
For the tilt wing aircraft, a wing loading to disc loading ratio (DL/WL) of 0.6 is an important design requirement. Its function is to insure a high velocity propeller slipstream over the wing which improves the
stall characteristics of the wing during accelerating and decelerating transitions. Therefore, with this
restriction the disc loading becomes:
disc loading = (DL/WL) (Wing Loading) The propeller diameters are then determined by
W
1/2
D = 2 NE x DL x IT where NE = Number of Engines DL = Disc loading, lbs/ft2The rotational speed of the propellers (.) is deter-mined by the propeller diameters and the requirement
that the propeller tip Mach number equal 0.75 on a 900 F sea level day. This Mach number was chosen for noise consideration. It was felt that rotor noise at higher Mach numbers would not be tolerable at city center locations. The propeller thrust-co-efficient at hover is then determined by
W
Thover (NE) SLl- (D/2)4
The propeller solidity (Cr) is
CThover _ propeller area
where
CT/'0r = .12, fixed input
The value of (' is constrained to a maximum value of .25 since that is considered to be the upper
limit in the design of a practical propeller. When-ever the calculated value of C violates this con-straint, it is reset to .25, and the propeller disc loading, diameter, thrust coefficient, and rotational speed must be recalculated. Consequently, a new wing loading, wing area, aircraft profile drag coefficient (CDo), lift coefficient, and cruise L/D must also be recalculated since the wing design is coupled to the propeller design through the (DL/WL) ratio.
5) Power Requirements
The horsepower required for the tilt wing is determined by hover requirements:
3/2
Gross
Weight
[
CDprop
+CT__
The engine shaft horsepower required is
SHP = HPhover
I.
hover. Y trans.
where
lThover = .9 = propeller efficiency in hover
-Itrans = .9 = transmission efficiency
The maximum shaft horsepower available (SHPO) is determined by the requirement that the engines have 15 percent extra power available to be used as control power. An additional 33 1/3% power is also made available for engine-out emergency operation.
The tilt wing is assumed to have four engines. The maximum shaft horsepower is considered to be 120
per-cent of normal rated power (NRP). Therefore, in
summary, the tilt wing normal rated power is
1.533 HP hover
NRP =
1.2yhover trans
The installed power of the STOL aircraft is
-28-determined by cruise requirements. Using the thrust needed in cruise, the horsepower used is determined by (Thrustr) Vcr cr 550
TRprop
'TI
trans where prop = 0.875 trans = 0.90The equivalent sea level power is then determined by the correction factor presented in Section IIIb.
Also, the engine is assumed to operate at 90 percent of NRP in cruise. Therefore, the NRP is 1.11 times the equivalent sea level cruise power. No extra
horse-power is considered necessary for engine-out capability. The propellers were sized by assuming that the
ratio of horsepower to propeller diameter squared was 7.5. A propeller solidity of .165 was assumed. These relationships were established as a result of propeller optimization studies as being reasonably representative. Their use considerably simplified the computational
around 87 percent, which was used in all computations. The jet lift aircraft is designed with separate cruise and lift engines. The normal rated thrust (at sea level (NRT) of the cruise engines is determined by the thrust required in cruise corrected for alti-tude effects plus the assumption that the engines operate at 90 percent of their NRT in cruise.
The lift engine installed thrust is based on the requirement that the total available thrust (lift plus cruise engines) is equal to 1.5 times the gross weight at sea level, 900 F. This thrust to weight ratio of
1.5 is required for engine-out hover capability with a second engine shutdown in order to maintain thrust symmetry. It also leaves sufficient excess thrust to insure control capability amounting to an acceleration of approximately radian per second squared in pitch, and a margin for deceleration of the aircraft.
6) Fuel Requirements
The next phase of the design process was to deter-mine fuel requirements. This was accomplished by flying
the aircraft over the design range. The fuel consumed
-30-during each segment of the flight profile was based
on the power or thrust used and the specific fuel consumption (SFC). The SFC was determined by the relationship presented in Sections IIIb and IIIc. The fuel consumed by the tilt wing aircraft will be considered first. The fuel consumed during engine start and checkout was assumed equivalent to normal rated power for 0.6 minutes. The aircraft had a total hover time of 12 seconds consisting of the time to ascend vertically to 50 feet from take-off, and the reverse when landing. The fuel consumed during the hover mode was based on the engine shaft horsepower used and the associated SFC.
Fuel (hover) = (SFChover) (HPhover
th
where
th = time in hover
For simplicity, and with no loss in overall ac-curacy, the acceleration and transition to the climb velocity at 1500 feet altitude and the acceleration
from the termination of climb to cruise velocity were handled as one total acceleration period.
The total time for this acceleration was computed to be typically 0.7 minutes. The fuel consumption was based on the conservative assumption that the engines were operating at normal rated power.
Fuel (acceleration) =
(SFCNRP) (HPNRP) x tacc
where tacc = acceleration and transition time = 0.7 minutes.
The climb phase was performed at maximum rate of climb at NRP. The horizontal velocity which results in the maximum rate of climb for a given altitude is determined by
b-
1/2
2Wg
VC1 Sw
3
T
e AR CDThe average forward velocity for maximum rate of climb was determined by averaging VC1 at 1500 feet al-titude and at cruise alal-titude. The average'rate of climb (R/C) is determined by
R/C = 33,000 HPCly prop' trans - 60 - VCl 0
Drag Gross Weight
(ft/min) where
HP = average shaft horsepower available, i.e. NRP corrected for average altitude
VCl= average horizontal velocity during climb Drag = average drag
Since NRP is used during climb the specific fuel con-sumption (SFCCl) is taken to equal SFCNRP. The fuel consumed during climb was
Fuel (Climb) = (SFCNRP) (HPCl) (t)Cl
where
t = time to climb = cruise altitude - 1500 (min.)
Cl R/C
The thrust required for the tilt wing aircraft for the cruise phase of the profile is equal to the drag. The cruise shaft horsepower is then- calculated by
Thrustcr Vcr SHPcr = 550T(prop
trans where
Thrustcr = Cruise Thrust Vcr = Cruise Velocity
trans x prop = overall efficiency
= .81 for Vcr $$ 400 mph
The sea level equivalent horsepower, specific fuel consumption and the fuel consumed per minute are determined as in the climb phase. The total fuel consumed during cruise is determined from the fuel consumed per minute, and the cruise velocity and distance. The cruise distance is determined by
subtracting the distances covered in the accelera-tion, climb, descent and deceleration phases from the design range (see Fig. F-la). Therefore the fuel consumed in cruise is Fuel (cruise) = (SFC)cr (HPcr) (tcr) where tcr = time in cruise _ cruise distance Vcr
The descent phase of the tilt wing aircraft profile is performed at the cruise velocity. The rate of descent
(R/D) is approximated by Vcr
R/D = (L/D)
where
L/Davg = the average of the lift to drag
ratio at cruise and 1500 feet altitude.
It is assumed that no thrust is available from the engines. However, a fuel consumption equivalent to the engine operating at 25% of NRP and SFC equal to SFCNRP is assumed, since the engine is in flight idle.
Fuel (descent) = (SFCNRP) (NRP/4) (td)
where
t = time of descent cruise altitude - 1500
td . R/D
The deceleration and re-transition phase of the tilt wing flight profile is assumed to require an average power level equal to 0.75 of the horsepower required in hover. The weight of fuel during deceleration is
Fuel (deceleration) = (SFCdec) (HPdec) (tdec) where
tdec = time of deceleration = 1 minute HPdec = average deceleration power
SFCdec = specific fuel consumption in deceleration based on
HPdec-Reserve fuel is based on 20 minutes of reserve time at cruise power and specific fuel consumption.
At this point, the weight of various aircraft com-ponents such as engines, wings, propellers, fuel tanks, etc. can be re-estimated using the weight formulae of Section IIIf. The fuel weight, payload, and this new estimate of aircraft empty weight combine to give a new gross weight, and the computer design process will
return to step (1) if the new gross weight differs by more than 10 lbs. In this way, an aircraft will be designed for specified inputs of payload-range, as-pect ratio, seats abreast, cruise speed, cruise alti-tude, etc. which will have properly sized engines, propellers, wings, etc. to perform the specified mis-sion. Investigation of the sensitivity to all of the design input parameters (such as cruise speed) can be quickly carried out to choose optimum parameter values. This sensitivity investigation gives an aircraft design optimized for any criterion such as direct operating cost, minimum gross weight, etc. In this study, the computer output of the design program was linked to the DOC program, and aircraft were optimized for mini-mum DOC.
The jet lift and STOL are designed in much the
same way as the tilt wing aircraft. For the jet lift
aircraft, the fuel consumed during the start and
check-out phase of all engines is based on a thrust specific
fuel consumption (TSFC) of 0.7 for 0.6 minutes of
nor-mal rated thrust. The fuel consumed in the hover mode
was based on a TSFC of 0.7 for 0.2 minutes at a total
thrust level of 1.2 of the gross weight. The weight
of fuel used in the acceleration period is based on
a TSFC of 0.7 for the lift engine and 0.55 for the
cruise engines. The cruise engines are considered
to operate at normal rated thrust and the lift engine
at 0.6 normal rated thrust for the acceleration phase.
The acceleration time is the time taken to accelerate
the aircraft from hover to cruise velocity at an
average acceleration of
g. Unlike the tilt wing
all the acceleration takes place at 1500 feet altitude
and therefore the climb to cruise altitude is at cruise
velocity. In the climb phase, the thrust of the lift
engines is
thrust of lift engines
=(Wq)
(R/C)
where Wg = Gross Weight
R/C = rate of climb = 5000 ft/min
VCl = climb velocity = cruise velocity
The thrust of the cruise engines it taken to be the average of the normal rated thrust at 1500 feet al-titude and at cruise alal-titude.
The thrust specific fuel consumption of the lift and cruise engines in climb is the average of the TSFC at 1500 ft. and cruise altitude. Hence, the fuel con-sumed in climb is based on the average TSFC and thrust of the lift and cruise engines and the time to climb. The time to climb is determined from the R/C and cruise altitude minus 1500 feet.
The weight of fuel consumed in cruise is determined by the thrust in cruise of the cruise engines alone, the time in cruise and the TSFC in cruise. The time is calculated as in the tilt wing case and the TSFC in cruise is determined by
TSFCcr = TSFC + .45 Mn .05 hcr 30,000
where TSFC = .55
TSFCcr = cruise TSFC Mn = cruise Mach No. hcr = cruise altitude
The lift engines are shut down during cruise. The
rate of descent is determined as in the tilt wing
case. The fuel used in descent is based on the time
in descent, 25 percent of normal rated thrust and
the thrust specific fuel consumption used in cruise.
The fuel consumed in the deceleration conversion
is based on the lift engines operating at .6 normal
rated thrust.
The reserve fuel is based on the
operation of the cruise engine at cruise normal
thrust for 20 minutes.
An additional amount of fuel is consumed in the
restart and checkout of the lift engines prior to the
landing of the jet lift aircraft. The restart fuel
consumed is based on .5 minute operation at normal
rated thrust of the lift engines and at cruise specific
fuel consumption.
For the STOL aircraft the fuel consumed during
engine start is determined as in the tilt wing case.
However,
additional fuel required for taxiing is based
on 25 percent normal rated power at a specific fuel consumption of .55 for 6 minutes.
Three acceleration periods are considered in the STOL aircraft operation, 1) ground roll acceleration from zero velocity to lift off velocity, 2) accelera-tion from lift off velocity to velocity of maximum rate of climb at 1500 ft. and 3) acceleration from maximum rate of climb at cruise altitude to cruise velocity. The acceleration periods are described below.
The velocity at lift off is considered to be 118.5 fps, which assumes a take-off lift coefficient of 3.0 or .9 CL max at a wing loading of 50 psf. The average
thrust during the take-off roll is determined by the approximation
1.2 NRP.Aprop'\ trans' 550 Thrust =
roll 0.7 Vlift
where
NRP = normal rated power
Ytprop = 0.875 = propeller efficiency
1\
trans= 0.90 = transmission efficiency Vlift = 118.5 fps = lift off velocityThe average acceleration is then determined by
F
thrustroll
-
dragroll
I
Acceroll
=Wg
where
= 0.1 = ground roll friction based on the
requirement for takeoff on a smooth runway but in slush.
Wg = gross weight, lbs.
drag=roll SL (7 Vlift)2 CDO Sw (lbs)
pSL
= sea level air density, slugs/ft 2CDo = parasite drag coefficient SW = wing area, ft2
g = gravity = 32.17 ft/sec 2
The time of the roll acceleration is the time it takes to accelerate to Vlift at the average acceleration
Accelroll-The second acceleration phase is that from Vlift to the velocity at maximum rate of climb at 1500
(VC11500). The maximum rate of climb is determined as in the tilt wing case. The average thrust is cal-culated as
-41-1 .2 NRPR ,.550
Thrustaccel2
prop
trans
()
(Vlift + VCl500)The associated average acceleration is determined by
(Thrustaccelp - drag 2) Accel = where m = aircraft mass
drag
2 =e
1500
Vlift
+
VC
11500
2 CD S
P1500
= density at 1500 ft altitude SW = wing areaCD = CDo + CDi ; aircraft drag coefficient evaluated at the average velocity
The corresponding acceleration time is the time it takes- to accelerate from Vlift to VC
1 1500 at Accel2' The third acceleration phase is that from the velocity at maximum rate of climb at cruise altitude to cruise velocity and is determined in essentially the same way as for the 1500 feet altitude accelera-tion case. Also the cruise and descent phases were determined as in the tilt wing case. The fuel con-sumed in the three acceleration phases are handled as a group. It is assumed that the engines operate at normal rated power at a specific fuel consumption
.55 for the total time of the three acceleration phases. The fuel consumed during climb cruise and descent is calculated the same as for the tilt wing.
It is assumed that the total deceleration from cruise velocity to zero velocity is at an average of 8 feet per second squared at 0.25 normal rated power and a specific fuel consumption (from Section IIIb).
SFCdec = 0.55 (NRP/.25 NRP)
An additional amount of fuel is also required for four minutes of maneuvering in approach patterns. The power is conservatively assumed to be the same as the cruise power and the corresponding specific fuel consumption. Reserve fuel is based on one-half hour reserve time at cruise conditions.
When a converged solution for any aircraft type is finally achieved, a set of fuel burned and blocks speeds is computed for various ranges less than the design range. These calculations assume that the cruise velocity and fuel flow rate are the same as for the design range case. This information along
with the gross weight, empty weight, number of engines, utilization, etc. is then used to calculate direct
operating costs versus range using the DOC program described in Section IIId.
b) Component Weights Formulas
The empirical relations used to determine the com-ponents weights of the tilt wing, jet lift, and STOL aircraft are as follows:
Fuselage
where
WF = Fus. Wt. = .8 (LF) .5(OD) (25N x Wg )15
LF = length of fuselage (ft)
OD = fuselage outside diameter (ft)
N = structural load factor = 4.5
Wg = gross weight (lbs.) Wing W = Wing Wt. = .015 N: W 1.15 WL 0.6 . 1 +1 (AR)5
t/c
cosA where N Wg WL t/cA
= structural load factor - 4.5
= gross weight (lbs)
- wing loading - psf
tip chord - .5 for tilt wing
root chord
= .25 for jet lift
= thickness to chord ratio .1 = mean sweepback angle
= 0 deg. for tilt wing and STOL = 30 deg. for jet lift
AR = aspect ratio
= 9.5 for tilt wing
= 7..0 for STOL
= 6.0 for
jet
liftEmpennage WTs = Empennage Wt. = .025 Wg, for tilt wing and jet lift = .035 Wg, for STOL
Engines WE = Engine Wt. = 12 NRP for the tilt wing and
6.375 STOL turbo prop engines, lbs.
1.2 NRTT for jet lift,
cruise 9.2 engines, lbs.
1.2 NRTT for jet lift, lift 23. engines, lbs.
where NRP = normal rated power of the turbo prop engines
NRTT = normal rated thrust of turbofan engines
1.2 NRT = engine 30 minute rating
Propellers W = Propeller Wt. = (NE).(14.2)
25
(p
5
NE)5 vtip D2 T .67
where NE = no. of engines D = propeller diameter
Pi = power input to propeller
Vtip = propeller tip velocity, fps ~ = solidity
Nacelles WN = Nacelle Wt. = 0.5 (WE), for tilt wing and STOL
= cruise engine and lift engine
weight, for jet lift
Engine Oil WO = Engine Oil Wt. = 35 (NE), for all aircraft
Undercarriage WLG = Undercarriage Wt. = .03 (Wg),
for all aircraft
Transmission - WT
The tilt wing transmission weight equals the larger of
1.2
NRP
WT1 = 60 LVtiPhover HPcr WT2 = 60 cr Vtipcr .8 - D/2.8
- D/2 D = propeller diameter= Propeller tip velocity in hover, fps = Propeller tip velocity in cruise, fps where
VtiPh
The tip velocity in hover is limited to Mach 0.75; in cruise to Mach 0.9. Under most flight con-ditions WT 1 is the larger value.
The STOL transmission weight is
WT = 60 1.2 NRP D/2 0.8
Vtip
where Vtip is limited to Mach 0.9 at sea level.
Furnishings - WFE
Furnishings and equipment were assumed to weigh 400 pounds plus 50 pounds for each crew member, plus 40 pounds per passenger. The crew consists of pilot, co-pilot and steward at 200 lbs. each.
Air Conditioning - WAC
Provision for air conditioning and anti--icing was taken to be 500 pounds plus 13 pounds per passenger.
Hydraulics - WH
The weight of the hydraulics was Hydr. Wt. = 5 x 10⁻⁴ (Wg)1-2 8
Electrical Equipment - WEL
Electronic Equipment - WES
Assumed value of 642 lbs.
Flight Controls - WFC
Flight Control Weight = .02 (Wg)
Fuel Tanks - WFT
Fuel Tank Weight
=
.3Fuel
wt.
6.7 Payload - WPL WPL = 200 (no. of passengers) Crew - WCR WCR = 200 (No. of crew) = 600 lbs.-49-111-3. Rotary Wing Aircraft
a) Rotary Wing Aircraft Design Studies
A computer program is used to design these aircraft and to compute their DOC vs range performance. This approach allows parametric studies of the effects of aircraft size, design range, engine performance, etc. to be run off easily, as in Reference (1). It also makes direct optimization of parameters such as block speed, cruise altitude, aspect ratio, etc. for minimum DOC possible instead of the more conventional optimi-zations to minimize gross weight or drag which do not necessarily minimize DOC. Computer results are more easily analyzed and evaluated if an understanding of the program which generated them is available. There-fore a detailed discussion of the rotary winged aircraft design program is presented below. This program designs and computes the DOC vs range performance of helicopters, compound helicopters, and stowed rotor aircraft. The program also prints out weight, and drag breakdowns and a table of time, distance covered, and fuel burned in
the various phases of flight (acceleration, climb, cruise, etc.). This program is a development of the program used
to calculate the helicopter and compound helicopter performance for Reference (1).
The stowed rotor performance presented in Ref. (1) was calculated by modifying the program which calculated
jet lift performance. This gave a first estimate. The decision was made to conduct a more detailed analysis of the stowed rotor since other studies indicate this to be a promising configuration. The current stowed rotor analysis is sufficiently detailed to show the ef-fects of different choices of transition speed, rotor solidity, etc.
Various refinements have been made to the analysis of the helicopter and the compound helicopter since the work reported in Ref. (1). These are summarized below, see pages 54 - 63 for a detailed discussion of the pro-gram used for this report.
1) The rotor transmission and drive system is designed to a torque limit which is optimized by a parametric analysis for minimum DOC.
2) The parasite drag calculation has been refined with the fuselage and wing drag calculated individually. The effects of different choices of fuselage length and diameter are then more clearly indicated.
3) The equation for fuselage length has been
changed to allow more room for doors and carry-on
baggage, and a tradeoff between extra fuselage length
(fairing at the tail) and drag has been investigated.
4) A parametric study of the cost of more
com-fortable seating (larger seat pitch and seat width)
has been conducted.
5) The estimate of high speed rotor performance
(CT/G' and L/DE vs /11 , Table I, page 56) has beenrefined.
In addition
C5'(
the rotor solidity
)
has been
chosen by trying various values of
6
in the computer
calculation and choosing the value of (r which results
in the lowest DOC. Previously a typical value of
was obtained from other studies.
6) The acceleration distance and fuel burn
has-been calculated in greater detail, using numerical
in-tegration, instead of assuming an average velocity and
fuel flow rate.
7) The tip Mach number in hover of the rotor has
been limited to obtain improved noise characteristics.
This condition sizes the rotor for the stowed rotor
air-craft and for compound helicopters.
8)
A more detailed calculation of the auxiliary
propulsion equipment weight and performance has been
conducted for the compound. This included a detailed
study of propeller performance in order to choose an
optimum propeller solidity
(6j ).
The more detailed
study has resulted in a considerable reduction in the
auxiliary propulsion system weight estimates and hence
an improvement in DOC for the compound.
9)
Instead of choosing a wing L/D and wing loading
based on typical values from other studies, these are
calculated from the aspect ratio (AR) and lift
coef-ficient (CL).
The AR and CL are optimized by a
para-metric analysis for minimum DOC.
10)
Instead of unloading the rotor 75% in cruise
for the compounds the rotor is
sized by a tip Mach
number limit in hover and operated at design CT/C
in cruise (see Table I).
The wing is then sized to
carry the remaining lift.
11)
The maximum speed capability of the compound
(as limited by aeroelastic effects) has been increased
in the light of more recent information.
12) The download on the wings and fuselage during hover is now calculated instead of being estimated. This is necessary for the optimization of ~ since a high
(' implies a high disc loading and hence a high down-load.
b) Computer Design Program
The design procedure is an iterative one. Ini-tially a gross weight is estimated based on the payload required. This gross weight is used to calculate the
fuel burn for the design mission and the component weights. From these results an improved estimate of the gross weight is generated which is used to recal-culate the fuel burn and component weights, etc. This process continues until successive estimates of the gross weight agree within 10 lbs.
Since the wing loading is independent of gross weight, it is chosen first.
WL = P V
N
2 CLFor the stowed rotor aircraft the wing is designed for transition at 5000 ft. and VTR = 160 mph with CL = 1.5. For the effect of varying VTR and CL see Figs. Rl and R2. The wing of the compound is designed for cruise with the CL = 1.0. An aspect ratio of 8 is used for
both the compound and the stowed rotor. These are prac-tical limits, the DOC decreases slightly for higher values of both AR and CL. The DOC of the compound is not very
sensitive to CL and AR variations.
The rotor is designed next. For advance ratios flight speed >0.3 the following table of rotor tip speed
design thrust coefficient/solidity (CT/T ) and equiva-lent lift to drag ratio of the rotor, less hub, (L/DE) is used:
TABLE I: High Speed Rotor Performance
.30 .35 .40 .45 .50 .55 .575 .60 .65 .68 CT/f .070 .068 .0655 .058 .054 .052 .051 .0505 .0485 .047 L/DE 8.5 9.5 9.7 9.5 8.1 7.4 7.2 6.9 6.5 6.3
The rotor tip speed in cruise (VT) is chosen to give a .95A Mach number at the advancing blade tip of .95, VT = 19 ,
1 +) where A = speed of sound. The rotor blades are 12% thick
inboard tapering to 6% at the tip to avoid excessive com-pressibility losses. For the helicopter the rotor thrust in cruise is taken equal to the gross weight and the
rotor is sized based on the design (CT/Q") (see Table I),
VT-= W
)
(VT)
2where R = rotor radius W = gross weight
For the compound and the stowed rotor the rotor is sized by a limit on the tip Mach number in hover of M = 0.6 (see below). The wing of the compound is then sized by requiring the rotor to operate at design
(Cr/(y') (see Table I) in cruise.
Wing Lift
=
Lw
=W
-p
R
2(VT)
2(r
(C)
The rotor solidity ((3' = blade area ) is chosen to disc area
minimize DOC (See Figs. R3, R4, and R5).
In hover CTH/ = 0.10 is used and the thrust is taken as 1.1 times gross weight to allow for control requirements. Therefore the hover tip speed = VTH
1.lw . If the tip Mach number in hover (VT H/A)
p 1 R2
.6 then the DL = W/T R2 is reduced to make (VTH/A)
required in hover is calculated as
HPH
~
pIR 2 (VTH )3 CDo + CTH3/2550 flH
where CDO = .012 and YtH = 0.86 - D1/W for single
rotor aircraft (including allowance for tail rotor
power) or ^OH = 0.92 - .15 (OL) - (DI/W) for tandem
rotor aircraft. DI is the download on the wings and fuselage calculated assuming CD = 0.8 for the fuselage, CD = 1.2 for the wings, and a fully developed uniform
rotor downwash and OL = 1.0 - (LF-10.0)/(2R) is the
overlap. For the engine out hover case the equivalent, installed normal rated power required, corrected to sea level, standard conditions, is:
HP
=N HPH.(NE/1-NE)
-HN HRc KEP
where NE = number of engines, KEP = 1.2, a factor to correct 30 min. rating to normal rated power, and Kc is a factor to correct power to sea level, standard conditions (see page 9).
The fuselage outside diameter is taken as OD = SW (SAB) + 3.0, where SW = 1.6 ft. = seat width and SAB =
number of seats abreast. The fuselage length is taken as LF = SP - (PX)/SAB + 3.7 (DN) + 20 (FSL) + 4.5
where SP = 2.83 (ft) seat pitch and PX is the number of passengers (Figure R8 shows the effect of varying SP and SW for a typical aircraft). DN, the number of large doors per side, is taken as 1 for 40 passengers, 2 for 80,and 3 for 120. FSL, the tail fairing
allow-ance, is 1.0 or 1.5 depending on the degree of tail fairing in order to allow for a trade-off between fuse-lage weight and drag. Optimum FSL = 1.0 for the tandem rotor aircraft and 1.5 for single rotor aircraft. For
single rotor aircraft it is necessary to ensure that the fuselage is long enough to accomodate both the main and tail rotors. Therefore, for single rotor aircraft:
LF >l.12R + 0.5 (SP) (PX)/SAB + 3.7 (DN +12.25 (ft)
For tandem rotor aircraft: LF >, l.2R + 10. (ft) The parasite drag is built up from the drag of the various components. The drag of the fuselage is:
(in terms of equivalent flat plate area)
FF = .0066 (OD)2 LF + 1.5 D + 7
(22
/FSLwhere FSL is the tail fairing parameter mentioned above.
W
The wing parasite drag is FW = .008 - The drag of
the rotor hubs and pylons, the engine nacelles, and the tail rotor is taken as FR = .0096 W2/3. For the heli-copter and the compound the parasite drag flat plate area is taken as:
F = 1.12 (FF + 1.5 FW + FR)
where the 1.12 allows for roughness, protuberances, and leakage and the 50% increase in FW represents the drag of the tail. For the stowed rotor in cruise configura-tion the parasite drag (flat plate area) is taken as:
F + 1.12 (.124 FR + 1.1 FF + 1.5 FW)
and when the rotor is operating: F = 1.12 (FR + 1.1
FF + 1.5 FW). The fuselage drag is increased by 10% to account for the drag of the enlarged part of the
fuselage required to stow the rotor. The wing skin friction drag is increased by 50% to allow for the drag of the tail. The drag of the engine nacelles and tail is .095R. It is possible to provide doors to cover
-60-the retracted rotor hub and first 1/3 of -60-the blades only thus saving 10% on rotor system weight and paying
.029FR in drag as compared to completely covering the blades. For the short ranges considered here (200 mi.)
leaving the last 2/3 of the blades uncovered results in a slightly lower DOC.
The overall aircraft lift/drag ratio is calculated as follows:
1 + pV 2 F + LR
L/D i2W ~W
1
-
1
L/DE L/D
where LR/W = rotor lift/gross weight, L/DE = rotor equiv-alent L/D (see page 55), and L/Di is the lift/induced drag of the wing.
L/D =1.4 AR PV2
L/D = (W)
The installed power for the helicopter and compound aircraft is determined by either the cruise requirement or the engine out hover condition, whichever requires more power. The equivalent, installed, sea level, stan-dard day, normal rated power required for engine out hover (HPHN) was calculated above (page 58). The power required for cruise is: