Publisher’s version / Version de l'éditeur:
The Astrophysical Journal, 836, 1, p. 120, 2017-02-10
READ THESE TERMS AND CONDITIONS CAREFULLY BEFORE USING THIS WEBSITE.
https://nrc-publications.canada.ca/eng/copyright
Vous avez des questions? Nous pouvons vous aider. Pour communiquer directement avec un auteur, consultez la première page de la revue dans laquelle son article a été publié afin de trouver ses coordonnées. Si vous n’arrivez pas à les repérer, communiquez avec nous à PublicationsArchive-ArchivesPublications@nrc-cnrc.gc.ca.
Questions? Contact the NRC Publications Archive team at
PublicationsArchive-ArchivesPublications@nrc-cnrc.gc.ca. If you wish to email the authors directly, please see the first page of the publication for their contact information.
Archives des publications du CNRC
This publication could be one of several versions: author’s original, accepted manuscript or the publisher’s version. / La version de cette publication peut être l’une des suivantes : la version prépublication de l’auteur, la version acceptée du manuscrit ou la version de l’éditeur.
For the publisher’s version, please access the DOI link below./ Pour consulter la version de l’éditeur, utilisez le lien DOI ci-dessous.
https://doi.org/10.3847/1538-4357/836/1/120
Access and use of this website and the material on it are subject to the Terms and Conditions set forth at
The next generation virgo cluster survey (NGVS). XXIV. The red
sequence to
∼10^6L⊙ and comparisons with galaxy formation models
Roediger, Joel C.; Ferrarese, Laura; Côté, Patrick; Macarthur, Lauren A.;
Sánchez-Janssen, Rúben; Blakeslee, John P.; Peng, Eric W.; Liu, Chengze;
Munoz, Roberto; Cuillandre, Jean-Charles; Gwyn, Stephen; Mei, Simona;
Boissier, Samuel; Boselli, Alessandro; Cantiello, Michele; Courteau,
Stéphane; Duc, Pierre-Alain; Lançon, Ariane; Mihos, J. Christopher; Puzia,
Thomas H.; Taylor, James E.; Durrell, Patrick R.; Toloba, Elisa;
Guhathakurta, Puragra; Zhang, Hongxin
https://publications-cnrc.canada.ca/fra/droits
L’accès à ce site Web et l’utilisation de son contenu sont assujettis aux conditions présentées dans le site LISEZ CES CONDITIONS ATTENTIVEMENT AVANT D’UTILISER CE SITE WEB.
NRC Publications Record / Notice d'Archives des publications de CNRC:
https://nrc-publications.canada.ca/eng/view/object/?id=f79969dd-18d7-40f7-ad76-10492c4d0ebf https://publications-cnrc.canada.ca/fra/voir/objet/?id=f79969dd-18d7-40f7-ad76-10492c4d0ebfTHE NEXT GENERATION VIRGO CLUSTER SURVEY (NGVS). XXIV. THE RED SEQUENCE TO ∼106L ⊙
AND COMPARISONS WITH GALAXY FORMATION MODELS.
JOELC. ROEDIGER1, LAURAFERRARESE1, PATRICKCÔTÉ1, LAURENA. MACARTHUR1,2, RÚBENSÁNCHEZ-JANSSEN1, JOHNP. BLAKESLEE1, ERICW. PENG3,4, CHENGZELIU5, ROBERTOMUNOZ6, JEAN-CHARLESCUILLANDRE7, STEPHENGWYN1, SIMONA MEI8,9, SAMUELBOISSIER10, ALESSANDROBOSELLI10, MICHELECANTIELLO11,12, STÉPHANECOURTEAU13, PIERRE-ALAINDUC7,
ARIANELANÇON14, J. CHRISTOPHERMIHOS15, THOMASH. PUZIA6, JAMESE. TAYLOR16, PATRICKR. DURRELL17, ELISA TOLOBA18,19, PURAGRAGUHATHAKURTA18, HONGXINZHANG6,20
1National Research Council of Canada, Herzberg Astronomy and Astrophysics Program, 5071 West Saanich Road, Victoria, BC, V9E 2E7, Canada 2Department of Astrophysical Sciences, Princeton University, Princeton, NJ 08544, USA
3Department of Astronomy, Peking University, Beijing 100871, China
4Kavli Institute for Astronomy and Astrophysics, Peking University, Beijing 100871, China
5Center for Astronomy and Astrophysics, Department of Physics and Astronomy, Shanghai Jiao Tong University, Shanghai 200240, China 6Instituto de Astrofísica, Pontificia Universidad Católica de Chile, Av. Vicuña Mackenna 4860, 7820436 Macul, Santiago, Chile
7AIM Paris Saclay, CNRS/INSU, CEA/Irfu, Université Paris Diderot, Orme des Merisiers, 91191 Gif sur Yvette Cedex, France 8GEPI, Observatoire de Paris, CNRS, 5 Place Jules Jannssen - 92195 Meudon, France
9Université Paris Denis Diderot, 75205, Paris Cedex 13, France
10Aix Marseille Université, CNRS, Laboratoire d’Astrophysique de Marseille UMR 7326, 13388, Marseille, France 11INAF Osservatorio Astr. di Teramo, via Maggini,-64100, Teramo, Italy
12INAF Osservatorio Astr. di Capodimonte, Salita Moiariello, 16, 80131 Napoli, Italy 13Department of Physics, Engineering Physics and Astronomy, Queen’s University, Kingston, ON, Canada 14Observatoire Astronomique, Université de Strasbourg & CNRS UMR 7550, 11 rue de l’Université, 67000 Strasbourg, France
15Department of Astronomy, Case Western Reserve University, Cleveland, OH, USA 16Department of Physics and Astronomy, University of Waterloo, Waterloo, ON N2L 3G1, Canada
17Department of Physics and Astronomy, Youngstown State University, Youngstown, OH, USA 18UCO/Lick Observatory, University of California, Santa Cruz, 1156 High Street, Santa Cruz, CA 95064, USA
19Department of Physics, Texas Tech University, Box 41051, Lubbock, TX, USA and 20National Astronomical Observatories, Chinese Academy of Sciences, Beijing 100012, China
For submission to ApJ.
ABSTRACT
We use deep optical photometry from the Next Generation Virgo Cluster Survey [NGVS] to investigate the color-magnitude diagram for the galaxies inhabiting the core of this cluster. The sensitivity of the NGVS imag-ing allows us to continuously probe galaxy colors over a factor of ∼ 2×10⁵in luminosity, from brightest cluster
galaxies to scales overlapping classical satellites of the Milky Way [Mg′ ∼–9; M∗∼106M⊙], within a single
environment. Remarkably, we find the first evidence that the RS flattens in all colors at the faint-magnitude end [starting between –14 ≤ Mg′ ≤–13, around M∗∼4 × 10⁷M⊙], with the slope decreasing to ∼60% or less
of its value at brighter magnitudes. This could indicate that the stellar populations of faint dwarfs in Virgo’s core share similar characteristics [e.g. constant mean age] over ∼3 mags in luminosity, suggesting that these galaxies were quenched coevally, likely via pre-processing in smaller hosts. We also compare our results to galaxy formation models, finding that the RS in model clusters have slopes at intermediate magnitudes that are too shallow, and in the case of semi-analytic models, do not reproduce the flattening seen at both extremes [bright/faint] of the Virgo RS. Deficiencies in the chemical evolution of model galaxies likely contribute to the model-data discrepancies at all masses, while overly efficient quenching may also be a factor at dwarf scales. Deep UV and near-IR photometry are required to unambiguously diagnose the cause of the faint-end flattening. Keywords:galaxies: clusters: individual (Virgo); galaxies: dwarf; galaxies: evolution; galaxies: nuclei;
galax-ies: star clusters: general; galaxgalax-ies: stellar content
1. INTRODUCTION
Despite the complexities of structure formation in a ΛCDM Universe, galaxies are well-regulated systems. Strong evi-dence supporting this statement are the many fundamental relations to which galaxies adhere: star formation rate ver-sus stellar mass or gas density (Daddi et al. 2007; Elbaz et al. 2007; Noeske et al. 2007; Kennicutt & Evans 2012), rota-tional velocity versus luminosity or baryonic mass for disks (Courteau et al. 2007; McGaugh 2012; Lelli et al. 2016), the fundamental plane for spheroids (Bernardi et al. 2003; Zarit-sky et al. 2012), and the mass of a central compact object ver-sus galaxy mass (Ferrarese et al. 2006; Wehner & Harris 2006;
Joel.Roediger@nrc-cnrc.gc.ca
Beifiori et al. 2012; Kormendy & Ho 2013), to name sev-eral. Moreover, many of these relations are preserved within galaxy groups and clusters, demonstrating that such regula-tion is maintained in all environments (e.g. Blanton & Mous-takas 2009). This paper focusses on the relationship between color and luminosity for quiescent [“quenched”] galaxies: the so-called red sequence [RS].
First identified by de Vaucouleurs (1961) and Visvanathan & Sandage (1977), the RS represents one side of the broader phenomenon of galaxy color bimodality (Strateva et al. 2001; Blanton et al. 2003; Baldry et al. 2004; Balogh et al. 2004; Driver et al. 2006; Cassata et al. 2008; Taylor et al. 2015), the other half being the blue cloud, with the green valley separat-ing them. Based on the idea of passively evolvseparat-ing stellar
ulations, color bimodality is widely interpreted as an evolu-tionary sequence where galaxies transform their cold gas into stars within the blue cloud and move to the RS after star for-mation ends (e.g. Faber et al. 2007). This evolution has been partly observed through the increase of mass density along the RS towards low redshift (Bell et al. 2004; Kriek et al. 2008; Pozzetti et al. 2010), although the underlying physics of quenching remains a matter of active research. The stan-dard view of color bimodality is a bit simplistic though insofar as the evolution does not strictly proceed in one direction; a fraction of galaxies in the RS or green valley have their stel-lar populations temporarily rejuvenated by replenishment of their cold gas reservoirs (Schawinski et al. 2014).
Crucial to our understanding of the RS is knowing when and how it formed. The downsizing phenomenon uncov-ered by spectroscopic analyses of nearby early-type galaxies (ETGs; Nelan et al. 2005; Thomas et al. 2005; Choi et al. 2014) implies that the RS was built over an extended period of time [∼5 Gyr], beginning with the most massive systems (e.g. Tanaka et al. 2005). These results support the common inter-pretation that the slope of the RS is caused by a decline in the metallicity [foremost] and age of the constituent stellar pop-ulations towards lower galaxy masses (Kodama & Arimoto 1997; Ferreras et al. 1999; Terlevich et al. 1999; Poggianti et al. 2001; De Lucia et al. 2007). Efforts to directly detect the formation of the RS have observed color bimodality to z ∼ 2 (Bell et al. 2004; Willmer et al. 2006; Cassata et al. 2008). More recently, legacy surveys such as GOODS, COSMOS, NEWFIRM, and UltraVISTA have shown that massive quies-cent galaxies [M∗& 3 × 10¹⁰M⊙] begin to appear as early as z= 4 (Fontana et al. 2009; Muzzin et al. 2013; Marchesini et al. 2014) and finish assembling by z = 1-2 (Ilbert et al. 2010; Brammer et al. 2011). Growth in the stellar mass density of quiescent galaxies since z = 1, on the other hand, has occured at mass scales of M∗and lower (Faber et al. 2007), consistent
with downsizing.
Owing to their richness, concentration, and uniform mem-ber distances, galaxy clusters are an advantageous environ-ment for studying the RS. Moreover, their characteristically high densities likely promote quenching and therefore hasten the transition of galaxies to the RS. In terms of formation, the RS has been identified in [proto-]clusters up to z ∼ 2 (Muzzin et al. 2009; Wilson et al. 2009; Gobat et al. 2011; Spitler et al. 2012; Stanford et al. 2012; Strazzullo et al. 2013; Cerulo et al. 2016). Much of the interest in z > 0 clusters has focussed on the growth of the faint end of the RS. Whereas scant evidence has been found for evolution of either the slope or scatter of the RS (Ellis et al. 1997; Gladders et al. 1998; Stanford et al. 1998; Blakeslee et al. 2003; Holden et al. 2004; Lidman et al. 2008; Mei et al. 2009; Papovich et al. 2010, but see Hao et al. 2009 and Hilton et al. 2009), several groups have claimed an elevated ratio of bright-to-faint RS galaxies in clusters up to z = 0.8, relative to local measurements (Smail et al. 1998; De Lucia et al. 2007; Stott et al. 2007; Gilbank et al. 2008; Hilton et al. 2009; Rudnick et al. 2009, see also Boselli & Gavazzi 2014 and references therein). The increase in this ra-tio with redshift indicates that low-mass galaxies populate the RS at later times than high-mass systems, meaning that the former, on average, take longer to quench and/or are depleted via mergers/stripping at early epochs. These results are not without controversy, however, with some arguing that the in-ferred evolution may be the result of selection bias, small sam-ples, or not enough redshift baseline (Crawford et al. 2009;
Lu et al. 2009; De Propris et al. 2013; Andreon et al. 2014; Romeo et al. 2015; Cerulo et al. 2016).
As a tracer of star formation activity and stellar populations, colors also are a key metric for testing galaxy formation mod-els. Until recently, only semi-analytic models [SAMs] had sufficient statistitcs to enable meaningful comparisons to data from large surveys. Initial efforts indicated that the fraction of red galaxies was too high in models, and thus quenching too efficient, which led to suggestions that re-accretion of SNe ejecta was necessary to maintain star formation in massive galaxies (Bower et al. 2006). Since then, a persistent issue facing SAMs has been that their RSs are shallower than ob-served (Menci et al. 2008; González et al. 2009; Guo et al. 2011). The common explanation for this is that the stellar metallicity-luminosity relation in the models is likewise too shallow. Font et al. (2008) demonstrated that an added cause of the excessively red colors of dwarf satellites is their being too easily quenched by strangulation, referring to the stripping of halo gas. While Font et al. (2008) increased the binding en-ergy of this gas as a remedy, Gonzalez-Perez et al. (2014) have shown that further improvements are still needed. Studies of other models have revealed similar mismatches with observa-tions (Romeo et al. 2008; Weinmann et al. 2011), indicating that the problem is widespread.
In this paper, we use multi-band photometry from the Next Generation Virgo Cluster Survey (NGVS; Ferrarese et al. 2012) to study galaxy colors in the core of a z = 0 cluster, an environment naturally weighted to the RS. The main nov-elty of this work is that NGVS photometry probes mass scales from brightest cluster galaxies to Milky Way satellites (Fer-rarese et al. 2016b, hereafter F16), allowing us to characterize the RS over an unprecedented factor of >105 in luminosity
[∼106 M
⊙ in stellar mass] and thus reach a largely
unex-plored part of the color-magnitude distribution [CMD]. Given the unique nature of our sample, we also take the opportunity to compare our data to galaxy formation models, which have received scant attention in the context of cluster cores.
Our work complements other NGVS studies of the galaxy population within Virgo’s core. Zhu et al. (2014) jointly modelled the dynamics of field stars and globular clusters [GCs] to measure the total mass distribution of M87 to a pro-jected radius of 180 kpc. Grossauer et al. (2015) combined dark matter simulations and the stellar mass function to ex-tend the stellar-to-halo mass relation down to Mh∼1010M⊙.
Sánchez-Janssen et al. (2016) statistically inferred the intrin-sic shapes of the faint dwarf population and compared the results to those for Local Group dwarfs and simulations of tidal stripping. Ferrarese et al. (2016a) present the deepest lu-minosity function to date for a rich, volume-limited sample of nearby galaxies. Lastly, Côté et al. (in preparation) and Sánchez-Janssen et al. (in preparation) study the galaxy and nuclear scaling relations, respectively, for the same sample.
In Section 2 we briefly discuss our dataset and preparations thereof. Our analysis of the RS is presented in Section 3, while Sections 4-6 focus on comparisons to previous work, compact stellar systems [CSS] and galaxy formation models. A discussion of our findings and conclusions are provided in Sections 7-8.
2. DATA
Our study of the RS in the core of Virgo is enabled by the NGVS (Ferrarese et al. 2012). Briefly, the NGVS is an optical imaging survey of the Virgo cluster performed with
CFHT/MegaCam. Imaging was obtained in the u∗g′ız′bands1
over a 104 deg2 footprint centered on sub-clusters A and B,
reaching out to their respective virial radii (1.55 and 0.96 Mpc, respectively, for an assumed distance of 16.5 Mpc; Mei et al. 2007; Blakeslee et al. 2009). The NGVS also obtained ˚--band imaging for an area of 3.71 deg2[0.3 Mpc2], roughly centered on M87, the galaxy at the dynamical center of sub-cluster A; we refer to this as the core region. NGVS im-ages have a uniform limiting surface brightness of ∼29 g′–
mag arcsec−2. Further details on the acquisition and
reduc-tion strategies for the NGVS are provided in Ferrarese et al. (2012).
This paper focuses on the core of the cluster, whose bound-aries are defined as,
12h26m20s ≤ RA (J2000) ≤ 12h34m10s 11◦30′22′′ ≤ Dec (J2000) ≤ 13◦26′45′′
and encompass four MegaCam pointings [see Figure 13 of F16]. A catalog of 404 galaxies for this area, of which 154 are new detections, is published in F16, spanning the range 8.9 ≤ g′≤23.7 and ≥50% complete to g′ ∼22. As demonstrated
there, the galaxy photometry has been thoroughly analysed and cluster membership extensively vetted for this region; be-low we provide a basic summary of these endeavors. A study of the CMD covering the entire survey volume will be pre-sented in a future contribution.
Faint [g′ > 16] extended sources in the core were
identi-fied using a dedicated pipeline based on ring-filtering of the MegaCam stacks. Ring-filtering replaces pixels contaminated by bright, point-like sources with the median of pixels located just beyond the seeing disk. This algorithm helps overcome situations of low surface brightness sources being segmented into several parts due to contamination. The list of candi-dates is then culled and assigned membership probabilities by analysing SExtractor and GALFIT (Peng et al. 2002) param-eters in the context of a size versus surface brightness dia-gram, colors and structural scaling relations, and photometric redshifts. A final visual inspection of the candidates and the stacks themselves is made to address issues of false-positives, pipeline failures, and missed detections. After this, the re-maining candidates are assigned a membership flag indicating their status as either certain, likely, or possible members.
As part of their photometric analysis, F16 measured sur-face brightness profiles and non-parametric structural quanti-ties in the u∗g′˚ız′ bands for the core galaxies with the IRAF
task ELLIPSE. These data products are complemented with similar metrics from Sérsic fits to both the light profiles and image cutouts for each source [the latter achieved with GAL-FIT]. Our work is based on the growth curves deduced by applying their [non-parametric] g′–band isophotal solutions
to all other bands while using a common master mask. This allows us to investigate changes in the RS as a function of galactocentric radius, rather than rely on a single aperture. Driver et al. (2006) adopted a similar approach for their CMD analysis, finding that bimodality was more pronounced using core versus global colors; our results support this point [see Fig. 4]. We extract from the growth curves all ten colors cov-ered by the NGVS, integrated within elliptical apertures hav-ing semi-major axes of a × Re,g′ [Re,g′ = g′–band effective
1Note that the filters used in the NGVS are not identical to those of the Sloan Digital Sky Survey (SDSS; York et al. 2000), with the u∗–band being the most different. Unless otherwise stated, magnitudes are expressed in the MegaCam system throughout this paper.
radius], where a = 0.5, 1.0, 2.0, 3.0; we also examine colors corresponding to the total light of these galaxies. Errors are estimated following Chen et al. (2010), using the magnitude differences between F16’s growth curve and Sérsic analyses, and scaling values for each set of apertures by the fraction of light enclosed. These estimates should probably be regarded as lower limits, since they do not capture all sources of sys-tematic uncertainty.
Absolute magnitudes are computed assuming a uniform distance of 16.5 Mpc (Mei et al. 2007; Blakeslee et al. 2009) for all galaxies and corrected for reddening using the York Ex-tinction Solver2 (McCall 2004), adopting the Schlegel et al.
(1998) dust maps, Fitzpatrick (1999) extinction law, and RV = 3.07. To help gauge the intrinsic scatter along the RS, we use recovered magnitudes for ∼40k artificial galaxies injected into the image stacks [F16] to establish statistical errors in our total light measurements. A more focussed discussion of un-certainties in the NGVS galaxy photometry may be found in Ferrarese et al. (2016a) and F16.
We note that, although the NGVS is well-suited for their detection, ultra-compact dwarfs [UCDs] are excluded from our galaxy sample for two reasons. First, they have largely been omitted from previous analyses of the RS. Second, the nature of these objects is unsettled. While many are likely the remnants of tidally-stripped galaxies (e.g. Bekki et al. 2003; Drinkwater et al. 2003; Pfeffer & Baumgardt 2013; Seth et al. 2014), the contribution of large GCs to this population re-mains unclear. Readers interested in the photometric proper-ties of the UCD population uncovered by the NGVS are re-ferred to Liu et al. (2015) for those found in the core region; still, we include UCDs in our comparisions of the colors of RS galaxies and CSS in Section 5.
3. THE RED SEQUENCE IN THE CORE OF VIRGO
Figure 1a plots the (u∗–˚) colors, integrated within 1.0 R
e,g′,
of all 404 galaxies in the core of Virgo as a function of their total g′–band magnitudes. One of the most striking features
in this plot is the depth to which we probe galaxy colors: at its 50%-completeness limit [Mg′ ∼–9], the NGVS
lumi-nosity function reaches levels that have only been previously achieved in the Local Group [i.e. comparable to the Carina dSph, and only slightly brighter than Draco; Ferrarese et al. 2016a]. This is significant as integrated colors for dwarf galaxies at these scales have, until now, been highly biased to the local volume [D ≤ 4 Mpc], incomplete, and noisy (e.g. Johnson et al. 2013). The NGVS CMD therefore represents the most extensive one to date based on homogeneous pho-tometry, spanning a factor of 2 × 10⁵in luminosity.
Also interesting about Fig. 1a is the dearth of blue galax-ies in the core of Virgo. This is more apparent in Figure 1b, where we plot histograms of (u∗–˚) in four bins of
luminos-ity. Three of the four samples are well described as unimodal populations rather than the bimodal color distributions typi-cally found in large galaxy surveys (e.g. Baldry et al. 2004). The absence of a strong color bimodality in Virgo’s core is not surprising though (Balogh et al. 2004; Boselli et al. 2014) and suggests that most of these galaxies have been cluster mem-bers long enough to be quenched by the environment3. The
2http://www4.cadc-ccda.hia-iha.nrc-cnrc.gc.ca/community/YorkExtinctionSolver/ 3 The timescale associated with environmental quenching appears con-tentious, with some groups favoring shorter values (<2 Gyr; Boselli & Gavazzi 2014, and references therein; Haines et al. 2015) and others longer (several Gyr; e.g. Balogh et al. 2000; De Lucia et al. 2012; Taranu et al. 2014).
−
21
−19
−17
−15
−13
−11
−9
M
g
′(mag)
0.5
1.0
1.5
2.0
2.5
3.0
u
∗
−
r
′
quenched star-forming comp. < 50% contam. images stripped10
510
610
710
810
910
1010
11L
g
′(
L
⊙
)
(a) 1 2 3 45 6 5 10 15 20 25 30 5 10 15 20 25 30 35 0.5 1.0 1.5 2.0 2.5 3.0u
∗
− r
′
10 20 30 40N
−17 < Mg′ ≤ −15 −15 < Mg′ ≤ −13 −13 < Mg′ ≤ −11 −11 < Mg′ ≤ −9 (b)Figure 1. (a) (u∗–˚) color versus absolute g′–band magnitude for the 404 galaxies in the core of Virgo. Colored points are purged from our sample of RS candidates due to obvious star formation activity [blue], our completeness limits [grey], significant image contamination [green], or suspected tidal stripping [red]. The vertical lines indicate bins of magnitude referenced in the right-hand panel, with representative errors plotted in each. (b) Color distributions within the four magnitude bins marked at left. The NGVS photometry enables a deep study of the galaxy CMD and we verify that the core of Virgo is highly deficient in star-forming galaxies.
minority of blue galaxies we find may be members that are currently making their first pericentric passage or are non-core members projected along the line-of-sight. Since our interest lies in the RS, we have inspected three-color images for every galaxy and exclude from further analysis 24 that are clearly star-forming [blue points in Fig. 1a]. Also ex-cluded are the 56 galaxies that fall below our completeness limit [grey points], 16 whose imaging suffers from significant contamination [e.g. scattered light from bright stars; green points], and 4 that are candidate remnants of tidal stripping [red points]. While we cannot rule out a contribution by red-dening to the colors of the remaining galaxies, their three-color images do not indicate a significant frequency of dust lanes.
Figure 2 plots all ten CMDs for quiescent galaxy candidates in Virgo’s core, where the colors again correspond to 1.0 Re,g′.
Having culled the star-forming galaxies, we can straightfor-wardly study the shape of the RS as a function of wavelength. In each panel of Fig. 2 we observe a clear trend, whereby for Mg′ . –14, colors become bluer towards fainter magnitudes.
To help trace this, we have run the Locally Weighted Scat-terplot Smoothing algorithm (LOWESS; Cleveland 1979) on each CMD; these fits are represented by the red lines in the figure. The observed trends are notable given that optical col-ors are marginally sensitive to the metallicities of composite stellar populations with Z & 0.1Z⊙. Simple comparisons of
our LOWESS curves to stellar population models suggests that, for Mg′ . –14, metallicity increases with luminosity
Galaxy mass and possible delay times likely factor into this disagreement.
along the RS [see Fig. 9]; age trends are harder to discern with the colors available to us. A metallicity-luminosity rela-tion for RS galaxies agrees with previous work on the stellar populations of ETGs throughout Virgo (Roediger et al. 2011b) and the quiescent galaxy population at large (e.g. Choi et al. 2014). Our suggestion though is based on fairly restrictive as-sumptions about the star formation histories of these galaxies [i.e. exponentially-declining, starting ≥8 Gyr ago]; more ro-bust results on age and metallicity variations along the RS in Virgo’s core from a joint UV-optical-NIR analysis will be the subject of future work.
A flattening at the bright end of the RS for Virgo ETGs was first identified by Ferrarese et al. (2006) and later confirmed in several colors by Janz & Lisker (2009, hereafter JL09). This seems to be a ubiquitous feature of the quiescent galaxy pop-ulation, based on CMD analyses for nearby galaxies (Baldry et al. 2004; Driver et al. 2006). This flattening may also be present in our data, beginning at Mg′ ∼–19, but the small
number of bright galaxies in the core makes it difficult to tell. Also, this feature does not appear in colors involving the z′–
band, but this could be explained by a plausible error in this measurement for M87 [e.g. 0.1 mag], the brightest galaxy in our sample.
The flattening seen at bright magnitudes implies that the RS is non-linear. A key insight revealed by the LOWESS fits in Fig. 2 is that the linearity of the RS also breaks down at faint magnitudes, in all colors. The sense of this non-linearity is that, for Mg′ & –14, the local slope is shallower than at
brighter magnitudes, even flat in some cases [e.g. u∗–g′; see
sug-0.8
1.0
1.2
1.4
1.6
u
∗−
g
′0.5
0.6
0.7
0.8
0.9
1.0
1.1
g
′−
i
′1.2
1.4
1.6
1.8
2.0
2.2
2.4
u
∗−
r
′0.4
0.6
0.8
1.0
1.2
1.4
g
′−
z
′1.4
1.6
1.8
2.0
2.2
2.4
2.6
2.8
u
∗−
i
′0.1
0.2
0.3
0.4
0.5
r
′−
i
′1.5
2.0
2.5
3.0
u
∗−
z
′0.1
0.2
0.3
0.4
0.5
0.6
0.7
0.8
r
′−
z
′−22 −20 −18 −16 −14 −12 −10
0.4
0.5
0.6
0.7
g
′−
r
′−22 −20 −18 −16 −14 −12 −10
0.0
0.1
0.2
0.3
0.4
0.5
i
′−
z
′M
g
′(mag)
Figure 2.CMDs for quiescent galaxies in Virgo’s core, in all ten colors measured by the NGVS. Fluxes have been measured consistently in all five bands within apertures corresponding to 1.0 Re,g′isophote of each galaxy. Black points represent individual galaxies while red lines show non-parametric fits to the data. The
RS defines a color-magnitude relation in all colors that flattens at faint magnitudes, which could be explained by a constant mean age and metallicity for the lowest-mass galaxies in this region [albeit with significant scatter; but see Fig. 3]. Representative errors for the same magnitude bins as in Fig. 1 are shown in each panel.
0.6
0.8
1.0
1.2
1.4
1.6
u
∗−
g
′0.4
0.6
0.8
1.0
g
′−
i
′1.0
1.2
1.4
1.6
1.8
2.0
2.2
2.4
u
∗−
r
′0.2
0.4
0.6
0.8
1.0
1.2
1.4
g
′−
z
′1.5
2.0
2.5
u
∗−
i
′−0.1
0.0
0.1
0.2
0.3
0.4
0.5
r
′−
i
′1.5
2.0
2.5
3.0
u
∗−
z
′−0.2
0.0
0.2
0.4
0.6
0.8
1.0
r
′−
z
′−22 −20 −18 −16 −14 −12 −10
0.2
0.3
0.4
0.5
0.6
0.7
g
′−
r
′−22 −20 −18 −16 −14 −12 −10
−0.4
−0.2
0.0
0.2
0.4
0.6
0.8
i
′−
z
′M
g
′(mag)
Figure 3.Comparison of the observed scatter [dashed lines] about the RS [solid lines] to photometric errors [dotted lines] established from artificial galaxy tests. The comparision is limited to Mg′ & –15 since our tests did not probe brighter magnitudes. The scatter and errors, averaged within three bins of luminosity,
gest that the behavior at the faint end of the RS may be even more complex, but the scale of such variations is well below the photometric errors [see Fig. 3]. JL09 found that the color-magnitude relation [CMR] of ETGs also changes slope in a similar manner, but at a brighter magnitude than us [Mg′ ∼
–16.5]; we address this discrepancy in Section 4.
An implication of the faint-end flattening of the RS is that the low-mass dwarfs in Virgo’s core tend to be more alike in color than galaxies of higher mass. This raises the question of whether the scatter at the faint-end of the RS reflects intrin-sic color variations or just observational errors. We address this issue in Figure 3 by comparing the observed scatter in the totalcolors to error estimates based on the artificial galaxies mentioned in Section 2. Shown there are LOWESS fits to the data and the rms scatter about them [solid and dashed lines, respectively], and the scatter expected from photometric er-rors [dotted lines]. Both types of scatter have been averaged within three bins of magnitude: –15 < Mg′ ≤ –13, –13 <
Mg′ ≤–11, and –11 < Mg′ ≤–9; the comparison does not
probe higher luminosities because our artificial galaxy catalog was limited to g′> 16, by design. We generally find that the
scatter and errors both increase towards faint magnitudes and that the two quantities match well, except in the brightest bin, where the scatter mildly exceeds the errors. For the other bins however, the intrinsic scatter must be small, strengthening the assertion that the faintest galaxies possess uniform colors [to within .0.05 mag] and, possibly, stellar populations. Deeper imaging will be needed to improve the constraints on genuine color variations at these luminosities.
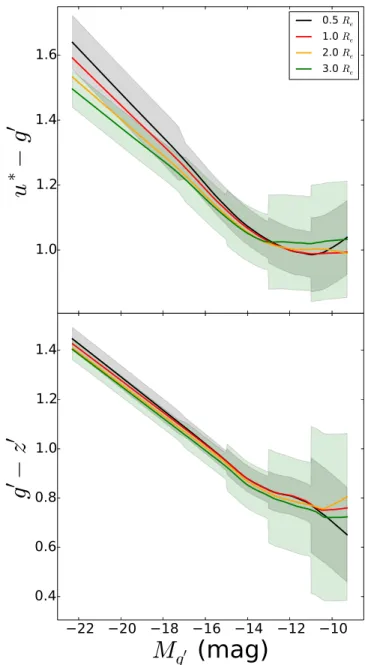
The last topic examined in this section is the effect of aper-ture size on galaxy color. Our most important result, the flat-tening of the RS at faint magnitudes, is based on galaxy colors integrated within their half-light radii. Aperture effects could be significant in the presence of radial color gradients, as sug-gested by Driver et al. (2006), and therefore bias our infer-ences on the shape of the RS. In Figure 4 we show LOWESS fits to the u∗–g′and g′–z′RSs for colors measured within 0.5 Re,g′, 1.0 Re,g′, 2.0 Re,g′, and 3.0 Re,g′. These particular colors
are chosen because, in the absence of deep UV and NIR pho-tometry4, they provide the only leverage on stellar populations
for the full NGVS dataset. We also include measurements of the scatter about these fits for the 0.5 Re,g′ and 3.0 Re,g′
aper-tures, represented by the shaded envelopes.
The top panel of Fig. 4 shows that u∗–g′ changes by at
most 0.04-0.06 mag at Mg′ ≤–17 between consecutive
aper-ture pairs. Two-sample t−tests of linear fits to the data in-dicate that these differences are significant at the P = 0.01 level. Conversely, hardly any variation is seen between aper-tures for galaxies with Mg′> –16. The bottom panel of Fig. 4
demonstrates that g′–z′ changes little with radius in most of
our galaxies. Slight exceptions are the 0.5 Re,g′ colors for
galaxies with Mg′ ≤–16, which differ from the 2.0 and 3.0
Re,g′ colors by .0.04 mag. The 1.0 Re,g′ colors bridge this
gap, following the 0.5 Re,g′ sequence at Mg′& –17 and
mov-ing towards the other sequences for brighter magnitudes. The changes in the RS with galactocentric radius imply the existence of negative color gradients within specific regions of select galaxies. The strongest gradients are found for u∗– g′within bright galaxies, inside 2.0 R
e,g′, while galaxies with
Mg′ > –15 have little-to-none in either color. Mild negative
4UV and deep NIR imaging of the Virgo cluster exist (Boselli et al. 2011; Muñoz et al. 2014) but can only aid us for brighter galaxies and select fields, respectively.
1.0
1.2
1.4
1.6
u
∗
−
g
′
0.5
Re1.0
Re2.0
Re3.0
Re22 20 18 16 14 12 10
M
g
′(mag)
0.4
0.6
0.8
1.0
1.2
1.4
g
′
−
z
′
Figure 4. RS in (u∗–g′) and (g′–z′), for different sizes of aperture used to measure galaxy colors. All four curves consider the same sample of galaxies. The choice of aperture has an impact on the slope of the RS at Mg′ . –16
mag for (u∗–g′), with smaller apertures yielding steeper slopes, while the RS is more stable in (g′–z′). The shaded envelopes represent the scatter about the RS for the 0.5 Re,g′and 3.0 Re,g′apertures.
gradients are seen in g′–z′between 0.5 and 1.0 R
e,g′for
galax-ies with Mg′ < –17, consistent with previous work on the
spatially-resolved colors of galaxies throughout Virgo (Roedi-ger et al. 2011a). The most important insight though from Fig. 4 is that the flattening of the RS at faint magnitudes does not apply to a specific aperture. The implications of those gradients we do detect in our galaxies, in terms of stellar pop-ulations and comparisons with galaxy formation models, will be addressed in Section 7.
4. COMPARISON TO PREVIOUS WORK
Before discussing the implications of our results, over the next two sections we compare our RS to earlier/ongoing work on the colors of Virgo galaxies and CSS, starting with the former. Of the several studies of the galaxy CMD in Virgo
0.4
0.6
0.8
1.0
1.2
1.4
1.6
JL09
NGVS
22 20 18 16 14 12 10
0.4
0.6
0.8
1.0
1.2
1.4
1.6
u
∗
−
g
′
M
g
′(mag)
Figure 5. (top) Comparison of the u∗–g′CMD from JL09 for Virgo ETGs [black circles] to that measured here [red dots]. The full sample is plotted for each dataset and LOWESS fits for both are overlaid [solid lines]. Represen-tative errors for the NGVS are included along the bottom. (bottom) As above but restricted to the galaxies common to both samples; measurement pairs are joined with lines. The NGVS extends the CMD for this cluster faintward by ∼5 mag, with much improved photometric errors. We also find that JL09’s CMR is steeper than our own at intermediate magnitudes, likely due to their inclusion of systems having recent star formation and possible errors in their sky subtraction.
(Bower et al. 1992; Ferrarese et al. 2006; Chen et al. 2010; Roediger et al. 2011a; Kim et al. 2010), that of JL09 is the most appropriate for our purposes. JL09 measured colors for 468 ETGs from the Virgo Cluster Catalog (Binggeli et al. 1985), based on ugriz imaging from SDSS DR5 (Adelman-McCarthy et al. 2007). Their sample is spread throughout the cluster and has B < 18.0. Most interestingly, they showed that these galaxies trace a non-linear relation in all optical CMDs, not unlike what we find for faint members inhabiting the cen-tralmost regions.
In Figure 5 we overlay the u∗–g′ CMD from JL09 against
our own, measured within 1.0 Re,g′; the comparison is
ap-propriate since JL09 measured colors within their galaxies’ r–band half-light radii. We have transformed JL09’s photom-etry to the CFHT/MegaCam system following Equation 4 in Ferrarese et al. (2012). The top panel shows all objects from both samples, along with respective LOWESS fits, while the bottom is restricted to the 62 galaxies in common to both. We focus on the u∗–g′ color because of its importance to stellar
population analyses; indeed, this is a reason why accurate u∗–
band photometry was a high priority for the NGVS.
The most notable feature in the top panel of Fig. 5 is the superior depth of the NGVS relative to the SDSS, an exten-sion of ∼5 mag. There is a clear difference in scatter be-tween the two samples, with that for JL09 increasing rapidly for Mg′ > –18, whereas the increase for the NGVS occurs
much more gradually5 [cf. Fig. 3; see Fig. 1 of Ferrarese et
al. 2016a as well]. Furthermore, the JL09 CMR has a lower zeropoint [by ∼0.06] and a shallower slope than the NGVS RS for Mg′ . –19, which two-sample t−tests verify as
sig-nificant [P = 0.01]. The JL09 data also exhibit a flattening of the CMR in the dwarf regime, but at a brighter magnitude than that seen in ours [Mg′ ∼–16.5]. The shallower slopes
found by JL09 at both ends of their CMR are seen for other colors and so cannot be explained by limitations/biases in the SDSS u–band imaging. The shallower slope at bright magni-tudes substantiates what was hinted at in Fig. 2 and is more obvious in JL09 since their sample covers the full cluster6; the
existence of this feature is also well-known from SDSS stud-ies of the wider galaxy population (e.g. Baldry et al. 2004). The lower zeropoint of the JL09 CMR is seen in other colors too, hinting that calibration differences between SDSS DR5 and DR7 are responsible, where the NGVS is anchored to the latter (Ferrarese et al. 2012).
Lastly, the LOWESS fits in Fig. 5 indicate that, between – 19 . Mg′. –16.5, the JL09 CMR has a steeper slope than the
NGVS RS. This difference is significant [P = 0.01] and holds for other u∗–band colors as well. This steeper slope forms
part of JL09’s claim that the ETG CMR flattens at Mg′ & –
16.5, a feature not seen in our data. Since JL09 selected their sample based on morphology, recent star formation in dwarf galaxies could help create their steeper slope. For one, the colors of many galaxies in the JL09 sample overlap with those flagged in our sample as star-forming. Also, Kim et al. (2010) find that dS0s in Virgo follow a steeper UV CMR than dEs and have bluer UV-optical colors at a given magnitude. We therefore are unsurprised to have not observed the flattening detected by JL09.
Recent star formation cannot solely explain why JL09 find a steeper slope at intermediate magnitudes though. The bot-tom panel of Fig. 5 shows that, for the same galaxies, JL09 measure systematically bluer u∗–g′ colors; moreover, this
difference grows to fainter magnitudes, creating a steeper CMR. Comparisons of other colors [e.g. g′–˚] and the
agree-ment found therein proves that this issue only concerns JL09’s u–band magnitudes. The stated trend in the color discrep-ancy appears inconsistent with possible errors in our SDSS-MegaCam transformations. Aperture effects can also be ruled out since the differences in size scatter about zero and never
5While the scatter in the JL09 data is likely dominated by the shallower depth of the SDSS imaging, a contribution by distance uncertainties cannot be ruled out, since the Virgo Cluster Catalog spans several sub-groups whose relative distances can exceed 10 Mpc (Mei et al. 2007).
6Virgo comprises two large sub-clusters and several massive groups, such that its bright galaxies are spread throughout the cluster.
exceed 25% for any one object; besides, Fig. 4 demonstrates that color gradients in u∗–g′are minimal at faint magnitudes.
A possible culprit may be under-subtracted backgrounds in JL09’s u–band images since they performed their own sky subtraction. Therefore, we suggest that the differences be-tween the JL09 CMR and NGVS RS for Mg′ > –19 can be
explained by: (i) a drop in the red fraction amongst Virgo ETGs between –19 . Mg′ . –16.5, and (ii) JL09’s
measure-ment of systematically brighter u–band magnitudes. Despite this disagreement, these comparisons highlight two exciting aspects about the NGVS RS [and the photometry overall]: (i) it extends several magnitudes deeper than the SDSS, and (ii) the photometric errors are well-controlled up to the survey limits.
5. COMPARISON TO COMPACT STELLAR SYSTEMS
The NGVS is unique in that it provides photometry for complete samples of stellar systems within a single global environment, including galaxies, GCs, galactic nuclei, and UCDs. These systems are often compared to one another through their relative luminosities and sizes (e.g. Burstein et al. 1997; Misgeld & Hilker 2011; Brodie et al. 2011), whereas their relative stellar contents, based on homogeneous datasets, are poorly known. Given the depth of the NGVS RS, we have a unique opportunity to begin filling this gap by examining the colors of faint dwarfs and CSS at fixed lumuniosity.
Our samples of GCs, nuclei, and UCDs are drawn from the catalogs of Peng et al. (in preparation), F16, and Zhang et al. (2015), respectively; complete details on the selection functions for these samples may be found in those papers. Briefly though, GCs and UCDs were both identified via mag-nitude cuts and the u∗ıK diagram (Muñoz et al. 2014), and
separated from each other through size constraints [rh≥11 pc for UCDs]. The validity of candidate GCs are assessed probabilistically and we use only those having a probability > 50%. All UCDs in the Zhang et al. (2015) catalog are spectroscopically-confirmed cluster members. Lastly, galac-tic nuclei were identified by visual inspection of the image cutouts for each galaxy and modelled in the 1D surface bright-ness profiles with Sérsic functions. For our purposes, we only consider those objects classified as unambiguous or possible nuclei in the F16 catalog.
In Figure 6 we plot the CMDs of galaxies and CSS in Virgo’s core [left-hand side] and the color distributions for ob-jects with g′ > 18 [right-hand side]; u∗–g′ colors are shown
in the upper row and g′–ı in the lower. Note that we have
truncated the CSS samples to 18 < g′ < 22 so that our
com-parisons focus on a common luminosity range.
An obvious difference between the distributions for galax-ies and CSS at faint luminositgalax-ies is the latter’s extension to very red colors, whereas the former is consistent with a sin-gle color [Fig. 3]. This is interesting given that CSS have a higher surface density than the faint dwarfs in Virgo’s core, suggesting that, at fixed luminosity, diffuse systems are forced to be blue while concentrated systems can have a wide range of colors. The nature of red CSS is likely explained by a higher metal content, since metallicity more strongly affects the colors of quiescent systems than age [see Fig. 9]. Also, the Spearman rank test suggests that nuclei follow CMRs in both u∗–g′[ρ = –0.57; p = 4 × 10⁻⁵] and g′–ı [ρ ∼ –0.5; p =
6 × 10⁻⁴], hinting at a possible mass-metallicity relation for
this population. A contribution of density to the colors of CSS is not obvious though given that many [if not most] of them were produced in the vicinity of higher-mass galaxies, and so
may owe their enrichment to their local environments. The as-yet uncertain nature of UCDs as either the massive tail of the GC population or the bare nuclei of stripped galaxies also raises ambiguity on what governs their stellar contents, be it due to internal or external factors [i.e. self-enrichment versus enriched natal gas clouds].
While it is possible for CSS to be quite red for their lu-minosities, the majority of them have bluer colors, in both u∗–g′and g′–ı, that agree better with those of faint RS
galax-ies. Closer inspection of the right-half of Fig. 6 reveals some tensions between the populations though. KS tests indicate that the null hypothesis of a common parent distribution for galaxies and GCs is strongly disfavored for u∗–g′ and g′–
ı [p < 10−10], whereas conclusions vary for UCDs and nuclei
depending on the color under consideration [pu∗–g′∼0.09 and
pg′–ı< 10−4 for UCDs; pu∗–g′ ∼0.007 and pg′–ı∼0.07 for
nuclei]. The tails in the distributions for the CSS play an im-portant role in these tests, but their removal only brings about consistency for the nuclei. For instance, clipping objects with u∗–g′
≥1.2 increases the associated p–values to 0.18, 0.17, and 0.04 for UCDs, nuclei, and GCs, respectively, while p changes to ∼ 10−4, 0.65, and < 10−4 by removing objects
with g′–ı ≥ 0.85. We have also fit skewed normal
distribu-tions to each dataset, finding consistent mean values between galaxies and CSS [except GCs, which have a larger value in g′–ı], while the standard deviations for galaxies is typically
larger than those for CSS. The evidence for common spectral shapes between the majority of CSS and faint galaxies in the core of Virgo is therefore conflicting. An initial assessment of the relative stellar contents within these systems, and po-tential trends with surface density and/or local environment, via a joint UV-optical-NIR analysis is desirable to pursue this subject further (e.g. Spengler et al., in preparation).
6. COMPARISON TO GALAXY FORMATION MODELS
As stated earlier, colors allow us to test our understand-ing of the star formation histories and chemical evolution of galaxies; scaling relations therein; and ultimately the physics governing these processes. Here we explore whether current galaxy formation models plausibly explain these subjects by reproducing the RS in the core of Virgo. The main novelty of this comparison lies in its focus on the oldest and densest part of a z ∼ 0 cluster, where members have been exposed to ex-treme external forces, on average, for several Gyr (Oman et al. 2013). The nature of our sample dictates that this comparison is best suited for galaxies of intermediate-to-low masses, al-though we still include high-mass systems for completeness. Unless otherwise stated, when discussing the slope of the RS, we are referring to the interval –19 . Mg′ . –15, where its
behavior is more or less linear.
We compare our results to three recent models of galaxy formation: one SAM (Henriques et al. 2015, hereafter H15) and two hydrodynamic (Illustris and EAGLE; Vogelsberger et al. 2014; Schaye et al. 2015). H15 significantly revised the L-Galaxies SAM, centered on: (i) increased efficiency of radio-mode AGN feedback; (ii) delayed reincoporation of galactic winds [scaling inversely with halo mass]; (iii) reduced den-sity threshold for star formation; (iv) AGN heating within satellites; and (v) no ram pressure stripping of hot halo gas in low-mass groups. H15 built their model on the Millenium I and II cosmological N-body simulations (Springel et al. 2005; Boylan-Kolchin et al. 2009), enabling them to produce galax-ies over a mass range of 107< M
revi-0.6
0.8
1.0
1.2
1.4
1.6
1.8
u
∗
−
g
′
Galaxies UCDs Nuclei GCsGalaxies
UCDs
Nuclei
GCs
10 12 14 16 18 20 22
g
′
(mag)
0.4
0.6
0.8
1.0
1.2
g
′
−
i
′
Figure 6. (top row) u∗–g′CMD and color distributions for galaxies [circles], GCs [dots], UCDs [squares], and galactic nuclei [diamonds] within the core of Virgo. Since our intent is to compare these stellar systems within a common magnitude range, only those CSS having 18 < g′< 22 are plotted. Representative errors for each population at faint magnitudes are included at bottom-left. (bottom row) As above but for the g′–ı color. At faint magnitudes, comparitively red objects are only found amongst the CSS populations; their colors are likely caused by a higher metal content than those for galaxies of the same luminosity.
sions helped temper the persistent issues of SAMs having too large a blue and red fraction at high and low galaxy masses, respectively (Guo et al. 2011; Henriques et al. 2013).
Illustris consists of eight cosmological N–body hydro sim-ulations, each spanning a volume of ∼1003Mpc3, using the
moving-mesh code AREPO. This model includes prescrip-tions for gas cooling; stochastic star formation; stellar evolu-tion; gas recycling; chemical enrichment; [kinetic] SNe feed-back; supermassive black hole [SMBH] seeding, accretion and mergers; and AGN feedback. The simulations differ in terms of the resolution and/or particle types/interactions con-sidered; we use the one having the highest resolution and a full physics treatment. EAGLE comprises six simulations with a similar nature to Illustris but run with a modified
ver-sion of the SPH code GADGET 3 instead. The simulations differ in terms of resolution, sub-grid physics, or AGN param-eterization, where the latter variations produce a better match to the z ∼ 0 stellar mass function and high-mass galaxy ob-servables, respectively. The fiducial model [which we adopt] includes radiative cooling; star formation; stellar mass loss; feedback from star formation and AGN; and accretion onto and mergers of SMBHs. Modifications were made to the im-plementations of stellar feedback [formerly kinetic, now ther-mal], gas accretion by SMBHs [angular momentum now in-cluded], and the star formation law [metallicity dependence now included]. The galaxy populations from Illustris and EA-GLE both span a range of M∗& 108.5M⊙.
0.8
1.0
1.2
1.4
1.6
u
∗−
g
′0.5
0.6
0.7
0.8
0.9
1.0
1.1
g
′−
i
′NGVS
H15
EAGLE
Illustris
1.2
1.4
1.6
1.8
2.0
2.2
2.4
u
∗−
r
′0.4
0.6
0.8
1.0
1.2
1.4
g
′−
z
′1.4
1.6
1.8
2.0
2.2
2.4
2.6
2.8
u
∗−
i
′0.1
0.2
0.3
0.4
r
′−
i
′1.5
2.0
2.5
3.0
u
∗−
z
′0.1
0.2
0.3
0.4
0.5
0.6
0.7
0.8
r
′−
z
′22 20 18 16 14 12 10
0.4
0.5
0.6
0.7
g
′−
r
′22 20 18 16 14 12 10
0.0
0.1
0.2
0.3
0.4
i
′−
z
′M
g
′(mag)
Figure 7. Comparison of the NGVS RS to those from galaxy formation models, with gray circles marking the positions of the observed galaxies. The shaded region surrounding each model curve indicates the 1-σ scatter, measured in five bins of luminosity. Curves for Illustris do not appear in panels showing u∗–band colors since their subhalo catalogs lack those magnitudes. In every color, models uniformly predict a shallower slope for the RS than is observed in cluster cores.
that inhabit massive halos [Mh > 1014 M⊙], have non-zero
stellar masses, are quenched [sSFR < 10−11yr−1] and
bulge-dominated [B/T > 0.5, by mass]; the last constraint aims to weed out highly-reddened spirals. We query the catalogs for both the Millenium I and II simulations, where the latter fills in the low-mass end of the galaxy mass function, making this sample of model galaxies the best match to the luminos-ity/mass range of our dataset. Similar selection criteria were used to obtain our samples of Illustris and EAGLE galaxies, except that involving B/T since bulge parameters are not in-cluded with either simulation’s catalogs. We also imposed a resolution cut on Illustris such that each galaxy is popu-lated by ≥240 star particles [minimum particle mass = 1.5 × 10⁴ M
⊙]. A similar cut is implicit in our EAGLE selection
as SEDs are only available for galaxies having M∗ & 108.5
M⊙. Interestingly, most of the brightest cluster galaxies in
EAGLE are not quenched, such that we make a second se-lection to incorporate them in our sample; no such issue is found with Illustris. Broadband magnitudes in the SDSS fil-ters were obtained from all three models and transformed to the CFHT/MegaCam system [see Section 4]. We note that these magnitudes and the associated colors correspond to the totallight of these galaxies.
A final note about this comparison is that we stack clusters from each model before analysing its RS. The high densities of cluster cores make them difficult to resolve within cosmo-logical volumes, particularly for hydro simulations, leading to small samples for individual clusters. Stacking is therefore needed to enable a meaningful analysis of the model CMD for quenched cluster-core galaxies. H15, Illustris, and EAGLE respectively yield ∼15k, 144, and 157 galaxies lying within 300 kpc of their host halos’ centers, which is roughly equiv-alent to the projected size of Virgo’s core [as we define it]. Note that the much larger size of the H15 sample is explained by the greater spatial volume it models and the fainter lumi-nosities reached by SAMs [Mg′ ≤–12, compared to Mg′ .
–15 for hydro models].
In Figure 7 we compare the RS from Fig. 2 [black] to those from H15 [red], Illustris [green], and EAGLE [blue], where the curves for the latter were obtained in identical fashion to those for the NGVS. The shaded regions about each model RS convey the 1σ scatter within five bins of luminosity. The Illustris RS does not appear in the panels showing u∗–band
colors since their catalogs lack SDSS u–band magnitudes. The clear impression from Fig. 7 is that no model repro-duces the RS in Virgo’s core, with model slopes being uni-formly shallower than observed. Two-sample t−tests of linear fits to the data and models show that these differences are sig-nificant at the P = 0.01 level, except for the case of the EAGLE models and g′–˚color [P = 0.09]. Further, the H15 RS exhibits
no sign of the flattening we observe at faint magnitudes; the hydro models unfortunately lack the dynamic range needed to evaluate them in this regard.
The model RSs also differ from one another to varying de-grees. First, H15 favors a shallower slope than the hydro mod-els. Second, the color of the H15 RS monotonically reddens towards bright magnitudes whereas the hydro RSs turnover sharply at Mg′ . –19. EAGLE and Illustris agree well
ex-cept for the ubiquitos upturn at faint magnitudes in the latter’s RS [marked with dashed lines]. These upturns are created by the resolution criterion we impose on the Illustris catalog and should be disregarded. Underlying this behavior is the fact that lines of constant M∗trace out an approximate
anti-20 40 60 80 100 20 40 60 80 100 z = 0.03 z = 0.08 20 40 60 80 100 z = 0.03 z = 0.07 −0.07 −0.06 −0.05 −0.04 −0.03 −0.02 −0.01
RS Slope
20 40 60 80 100 z = 0.0 z = 0.1Pr
ob
ab
ili
ty
WINGS H15 Illustris EAGLEFigure 8. Comparison of RS slopes in real (top panel) and model clusters (other panels). The model slopes are measured from those snapshots which most closely bracket the redshift range of the WINGS clusters [0.03 ≤ z ≤ 0.07]. In all cases the typical slope within model clusters is shallower than observed. The dashed line indicates the RS in Virgo’s core.
correlation in color-magnitude space (Roediger & Courteau 2015), a pattern clearly seen when working with richer sam-ples from this model [e.g. galaxies from all cluster-centric radii]. Third, the scatter in H15 is typically the smallest and approximately constant with magnitude, whereas those of the hydro models are larger and increase towards faint magni-tudes, more so for Illustris. Given that we find little intrinsic scatter in the NGVS RS at Mg′> –15 [Fig. 3], H15 appears to
outperform the hydro models in this regard, although we can only trace the latter’s scatter to Mg′ ∼–15. Other differences
between Illustris and EAGLE appear for the colors g′–ı, ˚--ı,
and ı–z′, in terms of turnovers, slopes and/or zeropoints, all of
which are significant [P = 0.01]. It is worth noting that while Fig. 7 references colors measured within 1.0 Re,g′ for NGVS
galaxies [to maximize their numbers], the agreement is not much improved if we use colors from larger apertures.
The conflicting shapes on the RS from data and models could be viewed in one of two ways: (i) the core of Virgo is somehow special, or (ii) models fail to reproduce the evo-lution of cluster-core galaxies. To help demonstrate that the latter is more probable, we compare the same models against a separate dataset for nearby clusters. WINGS (Fasano et al. 2002, 2006) is an all-sky survey of a complete, X–ray selected sample of 77 galaxy clusters spread over a narrow redshift range [z = 0.04 – 0.07]. Valentinuzzi et al. (2011) measured the slope of the RS for 72 WINGS clusters using BV photom-etry for galaxies in the range –21.5 ≤ MV ≤–18. We have done likewise for each well-populated [N > 100] model clus-ter, using the Blanton & Roweis (2007) filter transformations to obtain BV photometry from SDSS gr–band magnitudes.
Figure 8 compares the distribution of RS slopes from WINGS and galaxy formation models, with the dashed line in the top panel indicating the value in Virgo’s core, which fits comfortably within the former. Each model distribution is shown for the two closest snapshots to the redshift limits of the WINGS sample. In the case of H15 and Illustris, these
snapshots bracket the WINGS range quite well, whereas the redshift sampling of EAGLE is notably coarser. The latter fact may be important to explaining the difference between the two distributions for this model, since z = 0.1 corresponds to a look-back time of ∼1.3 Gyr. On the other hand, H15 and Illustris suggest that the RS slope does not evolve between z= 0.07/0.08 and 0.03. We have not tried to link model clus-ters across redshifts as parsing merger trees lies beyond the scope of this work. Observations though support the idea of a static slope in clusters over the range z = 0 – 1 (Gladders et al. 1998; Stanford et al. 1998; Blakeslee et al. 2003; Ascaso et al. 2008).
Fig. 8 demonstrates that the distributions for the WINGS and model clusters are clearly incompatible, with the models, on average, preferring a shallower slope for the RS. The sense of this discrepancy is the same as that seen in Fig. 7 between the core of Virgo and the models. A caveat with the com-parisons to WINGS though is that the model slopes have all been measured in the respective rest-frames of the clusters. In other words, the model slopes could be biased by differ-ential redshifting of galaxy colors as a function of magnitude [e.g. fainter galaxies reddened more than brighter ones]. To address this, we have simulated the effect of k−corrections us-ing the median of the EAGLE distribution at z = 0.1, findus-ing it would steepen this cluster’s RS by –0.01. While significant, we recall that the redshift range for the WINGS sample is z = 0.04 – 0.07, such that the mean k−correction to the model slopes is likely smaller than this value and would therefore not bring about better agreement.
Given the value of the above comparisons for testing galaxy formation models, we provide in the Appendix parametric fits to the NGVS RS in every color [measured at 1 Re,g′]. These
fits reproduce our LOWESS curves well and enable the wider community to perform their own comparisons.
7. DISCUSSION
Figure 1 indicates that >90% of the galaxy population within the innermost ∼300 kpc of the Virgo cluster has likely been quenched of star formation. This makes the population ideal for studying the characteristics of the RS, such as its shape and intrinsic scatter. Our analysis demonstrates that, in all optical colors, the RS is (a) non-linear and (b) strongly flattens in the domain of faint dwarfs. The former behavior had already been uncovered in Virgo, albeit at the bright end (Ferrarese et al. 2006; JL09), while the latter, which is new, begins at –14 < Mg′ < –13 [see Appendix], well above the
completeness limit of the NGVS. No correlation is observed between color and surface brightness, in bins of luminosity, for Mg′> –15, implying that the faint-end flattening is not the
result of bias or selection effect.
The RS follows the same general shape at Mg′ < –14 in
each color, which may have implications for trends in the stellar populations of these galaxies. Assuming that bluer [e.g. u∗–g′] and redder [e.g. g′–z′] colors preferentially trace
mean age and metallicity (Roediger et al. 2011b), respec-tively, the decrease in color towards faint magnitudes over the range –19 . Mg′ ≤ –14 hints that the populations
be-come younger and less enriched (consistent with downsiz-ing; Nelan et al. 2005), with two exceptions. The flatten-ing at bright magnitudes, seen better in samples that span the full cluster (JL09) and the global galaxy population (Baldry et al. 2004), signals either a recent burst of star formation within these galaxies or an upper limit to galactic chemical enrichment. The latter seems more likely given that the stellar
mass-metallicity relation for galaxies plateaus at M∗& 1011.5
M⊙(Gallazzi et al. 2005). The other exception concerns the
flattening at the faint-end of the RS.
7.1. What Causes the Faint-End Flattening of the RS? If colors reasonably trace stellar population parameters [see next sub-section], then arguably the most exciting interpreta-tion suggested by the data is that the faint dwarfs in Virgo’s core have a near-uniform age and metallicity, over a range of ∼3–4 magnitudes. This would imply that the known stellar population scaling relations for quiescent galaxies of intermediate-to-high mass (e.g. Choi et al. 2014) break down at low masses [below ∼4 × 10⁷M
⊙; see Appendix] and, more
fundamentally, that the physics governing the star formation histories and chemical enrichment of galaxies decouples from mass at these scales.
Given the nature of our sample, the above scenario begs the questions of whether the faint-end flattening of the RS is caused by the environment, and if so, when and where the quenching occurs. While Geha et al. (2012) make the case that dwarfs with M∗< 109 M⊙must essentially be satellites
in order to quench (also see Slater & Bell 2014; Phillips et al. 2015; Davies et al. 2016), we know little of the efficiency and timescale of quenching at low satellite masses and as a func-tion of host halo mass. Using Illustris, Mistani et al. (2016) showed that, on average, the time to quench in low-mass clus-ters decreases towards low satellite masses, from ∼5.5 Gyr to ∼3 Gyr, over the range 8.5 . log M∗ . 10. Slater & Bell
(2014) combine measurements of Local Group dwarfs with N-body simulations to suggest that, in such groups, galax-ies of M∗ . 107 M⊙ quench within 1-2 Gyr of their first
pericenter passage. However, Weisz et al. (2015) compared HST/WFPC2 star formation histories to predicted infall times based on Via Lactea II (Diemand et al. 2008), finding that many dwarfs in the Local Group likely quenched prior to in-fall.
In addition to reionization, pre-processing within smaller host halos may play a key role in explaining why many Lo-cal Group dwarfs ceased forming stars before their accretion. Likewise, pre-processing must also be considered when trying to understand issues pertaining to quenching of cluster galax-ies (e.g. McGee et al. 2009; De Lucia et al. 2012; Wetzel et al. 2013; Hou et al. 2014; Taranu et al. 2014), such as the cause of Virgo’s flattened RS at faint magnitudes. Wetzel et al. (2013) deduced where satellites of z = 0 groups/clusters were when they quenched their star formation, by modelling SDSS obser-vations of quiescent fractions with mock catalogs. They found that for host halo masses of 1014−15M
⊙the fraction of
satel-lites that quenched via pre-processing increases towards lower satellite masses, down to their completeness limit of M∗ ∼7
×109M⊙, largely at the expense of quenching in-situ.
Ex-trapolating this trend to lower satellite masses suggests that the majority of the quiescent, low-mass dwarfs in Virgo were quenched elsewhere. This suggestion is consistent with abun-dance matching results for our sample (Grossauer et al. 2015), which indicate that only half of the core galaxies with M∗=
106−7M
⊙were accreted by z ∼ 1 (see also Oman et al. 2013).
Assuming that the flattening of the RS reflects an approxi-mate homogeneity in stellar contents [i.e. constant mean age] and isolated low-mass dwarfs have constant star formation histories (e.g. Weisz et al. 2014), then the low-mass dwarfs in Virgo’s core must have quenched their star formation co-evally. Moreover, when coupled with a significant


![Figure 3. Comparison of the observed scatter [dashed lines] about the RS [solid lines] to photometric errors [dotted lines] established from artificial galaxy tests.](https://thumb-eu.123doks.com/thumbv2/123doknet/14071890.462502/7.918.79.840.97.1019/figure-comparison-observed-scatter-dashed-photometric-established-artificial.webp)
![Figure 5. (top) Comparison of the u ∗ –g ′ CMD from JL09 for Virgo ETGs [black circles] to that measured here [red dots]](https://thumb-eu.123doks.com/thumbv2/123doknet/14071890.462502/9.918.81.442.87.749/figure-comparison-cmd-virgo-etgs-black-circles-measured.webp)
![Figure 6. (top row) u ∗ –g ′ CMD and color distributions for galaxies [circles], GCs [dots], UCDs [squares], and galactic nuclei [diamonds] within the core of Virgo](https://thumb-eu.123doks.com/thumbv2/123doknet/14071890.462502/11.918.86.852.96.784/figure-distributions-galaxies-circles-squares-galactic-nuclei-diamonds.webp)


![Figure 10. Parameteric fits [green lines] to the RS in Virgo’s core, corresponding to the 1.0 R e,g ′ -colors of NGVS galaxies](https://thumb-eu.123doks.com/thumbv2/123doknet/14071890.462502/17.918.82.843.110.1041/figure-parameteric-green-lines-virgo-corresponding-colors-galaxies.webp)
