Applying Video Magnification Techniques to the ARCHNEI
Visualization of Blood Flow
by
Amy (Xiaoyu) Zhao
MASSACHUSETTS tNSTlTUTE OF fECHNOLOLGY
JUL 0
7 2015
LIBRARIES
Submitted to the Department of Electrical Engineering and Computer
Science
in partial fulfillment of the requirements for the degree of
Master of Science in Electrical Engineering and Computer Science
at the
MASSACHUSETTS INSTITUTE OF TECHNOLOGY
June 2015
© Massachusetts Institute of Technology 2015. All rights reserved.
.
Signature redacted
Author...
~.Department of
El~ring
and Computer Science
•
May 20, 2015
.
Signature redacted
Certified by . .
. ... .
, / ~ ~
/ .
John V. Guttag
Dugald C. Jackson Professor
(,/
S .
t
redacted
Thesis Supervisor
Certified by....
IQna Ure
... .
~
Fredo Durand
Professor
_
Thesis Supervisor
Accepted by ...
Signature redacted ... .
- I
P~sor
Leslie A. Kolodziejski
Applying Video Magnification Techniques to the Visualization
of Blood Flow
by
Amy (Xiaoyu) Zhao
Submitted to the Department of Electrical Engineering and Computer Science on May 20, 2015, in partial fulfillment of the
requirements for the degree of
Master of Science in Electrical Engineering and Computer Science
Abstract
In this thesis, we investigate the use of video magnification for the visualization and assessment of blood flow. We address the challenge of low signal-to-noise ratios in video magnification by modeling the problem and developing an algorithm for measuring the SNR in the context of video magnification. We demonstrate that the algorithm can be used to estimate the SNR of a real video and predict the SNR in the magnified video. We use several techniques based on video magnification to visualize the blood flow in a healthy hand and a hand with an occluded artery, and show that these visualizations highlight differences between the hands that might be indicative of important physiological differences.
Thesis Supervisor: John V. Guttag Title: Dugald C. Jackson Professor
Thesis Supervisor: Fr6do Durand Title: Professor
Acknowledgments
I would like to express my sincere gratitude to the individuals who made this work possible:
Prof. John V. Guttag, my research advisor and thesis supervisor, for spending many hours in the proofreading of this document, but also for constantly en-couraging me to improve in all aspects of my work.
Prof. Fredo Durand, my thesis supervisor, for his insightful technical analyses of my work, but also for pushing me to challenge myself and to "do good research" above all else.
Prof. Collin M. Stultz, for his considerable medical expertise, but also for teach-ing me to question everythteach-ing.
I would like to thank the students of the Data Driven Inference Group and the stu-dents of the Computation Biophysics Group for generously lending me their feedback and encouragement over the years.
As always, I am grateful to my mother, Rachel; my father, Qihua; and my sister, Linda for their unwavering love and support.
I would like to thank the members of my household: Robert, Mocha, and Mochi, for giving me the best home that I could ask for.
I am grateful to Dr. Irwin Jacobs, Mrs. Joan Jacobs, and Quanta Computer for their support.
Contents
1 Introduction
1.1 Clinical motivation . . . . 1.1.1 Arterial blood flow . . . .
1.1.2 Causes and symptoms of PAD . . . .
1.1.3 Diagnostic tools for PAD . . . .
1.2 Video-based techniques for measuring blood flow .
1.3 Video magnification for visualizing blood flow . .
2 Signal and noise in video magnification 2.1 Definitions . . . . 2.2 Related work . . . . 2.2.1 Noise in images and image sequences 2.2.2 SNR estimation . . . . 2.3 Signal and noise model . . . . 2.3.1 General case . . . . 2.3.2 Visualizing blood flow . . . . 2.4 SNR estimation algorithms . . . . 2.4.1 Noise estimation . . . . 2.4.2 Signal amplitude estimation . . . . . 2.5 SNR estimation in a simulated video . . . . 2.5.1 Spectral subtraction results . . . . . 2.5.2 Spatial averaging results . . . .
2.5.3 Comparison of signal estimation algorithms
15 16 16 18 19 24 25 29 . . . . 3 0 . . . . 3 3 . . . . 3 3 . . . . 3 5 . . . . 3 7 . . . . 3 8 . . . . 3 9 . . . . 4 0 . . . . 4 0 . . . . 4 2 . . . . 4 8 . . . . 5 0 . . . . 5 2 55
2.6 Applications to visualizing blood flow . . . . 56
2.6.1 M ethod . . . . 56
2.6.2 Noise level estimation . . . . 57
2.6.3 Signal amplitude estimation . . . . 60
2.6.4 Input SNR . . . . 62
2.6.5 Denoising in Eulerian linear video magnification . . . . 64
2.6.6 Output SNR . . . . 66
2.7 Summary . . . . 67
3 Visualizations of blood flow 69 3.1 Vasculature of the hands . . . . 69
3.2 Color change as the signal of interest . . . . 70
3.3 Application of Eulerian linear video magnification . . . . 72
3.3.1 Linear video magnification algorithm for visualizing blood flow in the hand ... ... ... 73
3.3.2 R esults . . . . 74
3.4 Visualization of the time delay of blood flow . . . . 77
3.4.1 Cross-correlation for determining time delay . . . . 78
3.4.2 Cross-correlation in magnified videos . . . . 78
3.4.3 R esults . . . . 79
3.5 Summary . . . . 80
List of Figures
1-1 Arteries carry blood from the heart to the tissues of the body. As
ar-teries near the organs, they branch into arterioles and then capillaries, through which the exchange of oxygen and nutrients occur. Venules and veins carry the deoxygenated blood back to the heart. Figure
reproduced from f14]. . . . . 17
1-2 The aorta and the arteries of the body experience different blood
pres-sures during systole and diastole. This pulsatile flow is dampened by the arterial walls; blood flow is mostly non-pulsatile by the time it
enters the smaller vessels. Figure reproduced from [171. . . . . 17
1-3 The ABI is computed by measuring the systolic blood pressure the
dorsalis pedis (DP) and posterial tibila (PT) arteries in each ankle, and the pressure in each arm. These measurements are usually made using blood pressure cuffs and a Doppler ultrasound device. The ABI is computed by dividing the higher ankle pressure in each leg by the
higher arm pressure. An ABI > 1.3 suggests that vessels are calcified,
and that additional vascular studies such as toe-brachial indices or pulse volume recordings should be conducted [22]. Figure reproduced from [23]. . . . . 20
2-1 Video magnification algorithms visualize the phenomenon of interest
by magnifying specific changes in the captured video. Blood flow is
an example of a phenomenon that causes two types of changes in the video scene. In our work, we only want to visualize the color change
in the skin. . . . . 30
2-2 The types of temporal variations that occur in a video. . . . . 31
2-3 The green channel NLF of a Panasonic Lumix DMC-G2, computed
by measuring the standard deviation of the green channel intensity of
each pixel in a Macbeth Color Checker Card over 600 frames. .... 41
2-4 Summary of the spatial averaging algorithm. We first estimate the fit
of Vart[Im(x, t)] (the total variance) against u (the inverse filter area, not shown to scale in the figure). The slope of the fit estimates the noise variance (the component of the total variance that is affected by spatial averaging). The intercept estimates the signal variance (the component of the total variance that is unaffected by spatial averaging). 49
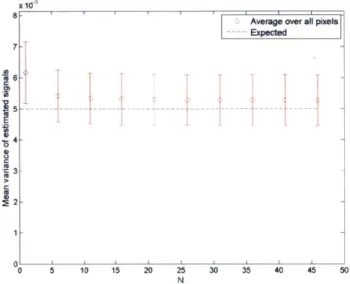
2-5 The estimated signal power, -2, produced by applying our spectral
subtraction algorithm to a video with a,, = 0.1, A, = 0.1. The error
bars represent the standard deviation in the values of s2 over all of the
pixels in the signal region. g2 appears to become more accurate as N
increases; howver, it appears to converges upon 5.4 x 10-' rather than
the true signal power a = 5.0 x 10⁻³. . . . . 51
2-6 Input pixel intensities (left) and estimated signal (right) for the
simu-lated video with A. = 0.1, a-, = 0.1. . . . . 52
2-7 Estimated fits of Vart[Im(x, t)] against u for the simulated video in
which A, = 0.1, on = 0.1. The slope of the fit is an estimate of og, and
2-8 Estimated signal power at each pixel in the signal region (left) and noise
region (right), for the simulated video in which or, = 0.1, A, = 0.1.
The average estimated signal power in the signal region is 5.02 x 10-;
the average estimated signal power in the noise region is 3.62 x 10⁻⁷
which is small relative to the estimate from the signal region and can be considered to be close to the true value of 0. The covariance in the
estimates of spatially adjacent pixels was measured to be negligible. . 54
2-9 A healthy female's hand next to a color calibration target. . . . . 56
2-10 Using the color calibration target, we measured the noise standard deviation in the green channel. We also used our spatial averaging al-gorithm to estimate the noise standard deviation in the green channel. The average NLF (right) was computed by binning the noise levels into 20 bins based on mean intensity and then taking the mean noise level within each bin. . . . . 58
2-11 Estimated noise standard deviation at each pixel. The estimated noise standard deviation from the spatial averaging algorithm (left) fall into the same grid pattern as the measured noise standard deviation (right). 58 2-12 The estimated noise standard deviation is higher in the signal region
than in the noise region. Pixels with negative estimated noise
vari-ance1were excluded. . . . . 59
2-13 The estimated signal amplitude in the pixels of the hand are generally
larger than those in the color calibration target. . . . . 60
2-14 Distribution of estimated signal amplitudes in the pixels of the hand. 61
2-15 Estimated signal power. . . . . 61 2-16 Estimated SNR (dB) in the input video, produced by applying the
spatial averaging algorithm to the video. . . . . 63
2-17 Using the temporal and spatial filters described earlier, we estimate
that we can obtain high output SNRs in the hand. We predicted that
these filters increase the SNR from an mean of -12.1 dB in the input
3-1 Vasculature of the hand, viewed from the palmar side. Figure repro-duced from [80]. . . . . 70 3-2 Arterial pressure in the aorta (PA0), femoral artery (Pfemoral) and
ra-dial artery (Para-dial) of a female pig, in the time domain and frequency domain. Figure adapted from [82]. . . . . 71 3-3 Experiment setup with a healthy female subject. The Doppler probe
was placed on the radial artery in the wrist. . . . . 73 3-4 In the magnified video of a healthy hand, we see that the hand
uni-formly exhibits a green to red color change at the heart rate frequency. 75 3-5 The intensity in the magnified green channel (each curve represents the
signal at a single pixel) appears to align with the peaks in the audio produced by the Doppler device. In the time segment highlighted in red, however, the magnified intensity does not exhibit the same beat-to-beat variations in heart rate that are shown in the audio signal. . . 76 3-6 In the magnified video of a hand with an occluded ulnar artery, we see
that the hand does not exhibit uniform color changes at the heart rate frequency. . . . . 77 3-7 Cross-correlation algorithm for computing the time delay between two
signals. The input signals y1(t) and Y2(t) may be filtered to produce y'(t) and y'(t). Figure adapted from [86] .. . . . . 78 3-8 The estimated time delay of the magnified green channel intensity
List of Tables
1.1 Fontaine's Stages for the classification of PAD. Patients are classified as asymptomatic if they do not exhibit typical claudication symptoms. Claudication refers to the reproducible muscle discomfort that pro-duced by exercise and relieved by resting for 10 minutes [20]. Ischemic rest pain refers to pain at rest that is caused by insufficient blood supply [19]. While this classification method is not used in clinical practice, it is commonly used for research purposes. Table reproduced from 120]. . . . . 18 1.2 Comparison of diagnosis and imaging tools for PAD. These tools are
listed in order from least expensive (ABI) to most expensive (CA). Many of these tools are also useful for monitoring patients after
ther-apeutic interventions such as revascularization. Information adapted from [4, 22, 201. . . . . 23 2.1 Summary of the noise terms present in raw images captured by CCD
or CMOS digital cameras. Information adapted from [43, 44].
....
34
2.2 Estimates of the signal power computed by the spectral subtraction algorithm and spatial averaging algorithm for the simulated video in which a-, = 0.1, A, = 0.1. . . . . 55 2.3 Estimates of the signal power computed by the spectral subtraction
algorithm and spatial averaging algorithm for the simulated video in which o-, = 0.1, A, = 0.01. The spectral subtraction algorithm is not able to estimate the true signal power from individual pixels. . . . . . 55
Chapter 1
Introduction
Video magnification technology allows us to visualize small variations in videos that are difficult or impossible to see with the naked eye. These techniques can be used to investigate a wide range of physical phenomena. For instance, Eulerian linear video magnification has been used to visualize the subtle motion in the chest of a breathing
baby [1]. Recently, new phase-based algorithms have been used to visualize the
vibration of mechanical structures [2, 31.
In addition to magnifying motion, the Eulerian linear video magnification algo-rithm magnifies color changes. It has been used to produce visualizations of the subtle green to red variations that occur at the heart rate as blood perfuses the human face
[1]. Blood flow measures play a large role in the evaluation of peripheral vascular
dis-eases [4]. This thesis investigates the use of video magnification for the visualization and assessment of blood flow, and its potential applications in evaluating vascular disease. In this work, we examine the accuracy of the visualizations produced by video magnification. We demonstrate that video magnification techniques can pro-duce visualizations that exhibit noticeable differences between a healthy subject and a subject affected by an arterial occlusion.
In this chapter, we discuss the clinical motivation for visualizing blood flow. We also explore previous work in obtaining measures of blood flow.
-1.1
Clinical motivation
In 2010, approximately 8 million adults in the US and 202 million people globally were affected by peripheral arterial disease (PAD) [5, 61. PAD is a cardiovascular condition that is characterized by insufficient blood flow in the organs and limbs resulting from a narrowing of the peripheral arteries. PAD can affect any of the arteries outside of the coronary arteries, including vessels in the brain, upper extremities and kidneys
[7], but most commonly affects the lower extremities [8]. While the majority of PAD
cases are asymptomatic, asymptomatic and symptomatic PAD are both associated with increased risk of adverse vascular events and increased mortality [9, 101. Patients with symptomatic PAD experience decreased quality of life due to symptoms such as claudication (reproducible muscle pain related to physical activity), pain at rest, non-healing wounds and ulcerations. Treatments for severe symptoms of PAD such as critical limb ischemia are typically invasive, such as revascularization or amputation
[11]. PAD is a growing problem in the US and other countries with aging populations,
since the prevalence of PAD is age-related [12]. Other major risk factors for PAD include smoking, diabetes and hypertension [4].
1.1.1
Arterial blood flow
Before we delve any further into PAD, let us briefly review human vascular anatomy. In the human systemic circulation system, arteries are the blood vessels that carry blood away from the heart. These vessels branch into a network of successively smaller vessels. As an artery enters the organ that it is supplying, it branches into arterioles, which in turn branch into a network of capillaries, the smallest class of vessels. These capillaries rejoin to become venules and then veins that carry blood away from the organ and back into the heart [13].
The heart contracts rhythmically in a pattern called the cardiac cycle, which consists of two main phases: systole and diastole. During systole, the heart contracts; during diastole, the heart refills with blood. This process causes blood to be ejected in a pulsatile manner. The arterial wall is elastic and responds to propagated pulse
TO Fr Arter
Inner layer \ ue ae
Arler'oles
Figure 1-1: Arteries carry blood from the heart to the tissues of the body. As arteries near the organs, they branch into arterioles and then capillaries, through which the exchange of oxygen and nutrients occur. Venules and veins carry the deoxygenated blood back to the heart. Figure reproduced from
1141.
of blood by increasing in diameter [151. This dampens the pulsatile energy of the blood as it approaches the organs. In the arterioles and capillaries, the flow of blood is largely non-pulsatile [161. 120 z100 E 5 80 60 40 0 0 20 0 / //
Figure 1-2: The aorta and the arteries of the body experience different blood pressures during systole and diastole. This pulsatile flow is dampened by the arterial walls; blood flow is mostly non-pulsatile by the time it enters the smaller vessels. Figure reproduced from [171.
The pulsatile quality of arterial flow serves as the basis for many measures of
W
ft
Tissues
products, sud
vascular health. For instance, the shape of the blood velocity waveform measured by Doppler ultrasonography (which we will discuss in section 1.1.3) can indicate the presence of an arterial obstruction.
1.1.2
Causes and symptoms of PAD
PAD is most commonly caused by atherosclerosis
[4],
a pathologic process in which the arteries become narrower due to the accumulation of lipid and fibrous materials in the vessel walls [181. Other causes of PAD include arterial aneurysms, thrombosis,arterial injury, etc. [19].
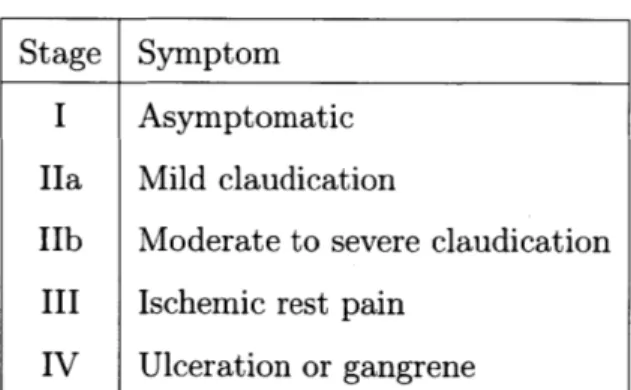
The severity of the symptoms experienced by an individual with PAD depends on the degree of stenosis (that is, arterial narrowing), the number of affected arteries, and the patient's physical activity level. Many patients with PAD do not experience any symptoms. Patients with more advanced PAD experience symptoms ranging from intermittent claudication (pain during exercise) to non-healing ulcers and gangrene
[19].
Stage Symptom
I Asymptomatic
Ha Mild claudication
IIb Moderate to severe claudication III Ischemic rest pain
IV Ulceration or gangrene
Table 1.1: Fontaine's Stages for the classification of PAD. Patients are classified as asymptomatic if they do not exhibit typical claudication symptoms. Claudication refers to the reproducible muscle discomfort that produced by exercise and relieved by resting for 10 minutes [20]. Ischemic rest pain refers to pain at rest that is caused by insufficient blood supply [19]. While this classification method is not used in clinical practice, it is commonly used for research purposes. Table reproduced from
[20].
It is estimated there there are 2 to 5 times as many asymptomatic individuals with PAD as symptomatic individuals. Individuals are designated as asymptomatic
if they have no symptoms, or if they do not exhibit any typical claudication symp-toms. However, asymptomatic individuals may have more subtle impairments of leg function [4]. Furthermore, asymptomatic PAD and symptomatic PAD alike are
as-sociated with increased risk of mortality and cardiovascular events [9]. There has
been increasing interest in detecting PAD in asymptomatic patients through routine screening procedures. We will discuss this further in the next section, where we review
existing tools for the assessment and treatment of PAD.
1.1.3
Diagnostic tools for PAD
There are many tools that are currently used for diagnosing PAD. These tools range from inexpensive and easy-to-obtain blood pressure ratios, to blood flow measures that require specialized equipment in a vascular laboratory, to vascular imaging tech-niques that require intravenously injected contrast agents. Video magnification holds the potential to be less expensive and more informative than many of existing phys-iologic tests. In this section, we review the existing techniques and their associated challenges.
Non-invasive vascular measures
There are several non-invasive examinations that can be used to diagnose PAD, and to determine the location and severity of stenoses. The ankle-brachial index (ABI) is a common test that is inexpensive and easy to perform. The ABI serves as the standard
for diagnosing lower extremity PAD in office practice
[4].
It is also recommended asa screening device for asymptomatic patients who are at risk for PAD [20, 21]. It is computed by measuring the systolic blood pressure from the brachial artery (in the upper arm) of both arms, and the dorsalis pedis (DO) and posterior tibial (PT) arteries (in the lower calf). The ABI is defined as the ratio of the higher of the two pressures from the ankle to the higher of the pressures from the two arms. Similar measures include the wrist-brachial index and toe-brachial index, which are computed in a similar fashion to the ABI. The wrist-brachial index is used to diagnose upper
extremity PAD, and the toe-brachial index is more useful than the ABI in certain patient populations with lower extremity PAD
[221.
Right-arm systolic pressure Right-ankle systolic pressure sy DP DP Interpretation of ABI > 3 Non1o.0preulble 0.91-1.30 Normal 0.41-0.90 Mibf- dr PriPhr arwiildiss" 4.00-0.40 S&ver*PW**8ears riW dim"*e Left-arm stolic pressure Left-ankle systolic pressure Figure pedis (
1-3: The ABI is computed by measuring the systolic blood pressure the dorsalis DP) and posterial tibila (PT) arteries in each ankle, and the pressure in each* arm. These measurements are usually made using blood pressure cuffs and a Doppler ultrasound device. The ABI is computed by dividing the higher ankle pressure in each leg by the higher arm pressure. An ABI > 1.3 suggests that vessels are calcified, and that additional vascular studies such as toe-brachial indices or pulse volume recordings should be conducted [22]. Figure reproduced from [231.
A diagnosis made by the ABI is often considered accurate enough that verifica-tion with further diagnostic techniques is not required. However, the ABI produces inaccurate results in some patient populations; since the process of measuring blood pressure requires using a blood pressure cuff to abolish systolic blood flow, the ABI is falsely elevated when the patient has calcified vessels that do not compress normally. This occurs in a small fraction of diabetic or elderly individuals. In these
popula-Higher right-ankle pressure Right ABI igher arm prssur
Higher left-ankle pressure
Left ABI
tions, other diagnostic measures such as the toe-brachial index (which is useful since the small vessels in the toes are frequently spared from calcification) or pulse volume recordings (which we will discuss below) may provide more reliable information [22].
Once a diagnosis of PAD is made using the ABI, further studies are often required
to determine the location and severity of the disease. Segmental pressure
exami-nations and pulse volume recordings (PVR) use specialized equipment in a vascular laboratory to measure blood pressure and limb volume respectively at successive loca-tions in an extremity [22]. Continuous-wave Doppler ultrasound can similarly be used to identify the location, severity and progression of PAD. A continuous-wave Doppler ultrasound device works by continuously emitting sound waves and measuring the reflected waves in order to compute the real-time blood flow velocity [24, 211. This device is commonly used to aid in the measurement of the ABI. Qualitative and quan-titative measures of the continuous-wave Doppler ultrasound waveform also provide information about the severity of PAD [21]. Similar to the ABI, segmental pressure examinations and continuous-wave Doppler ultrasound measurements have limited accuracy in certain patient populations, including patients with highly calcified and
incompressible arteries
[4].
Vascular imaging
Vascular imaging studies are sometimes needed to further assess PAD anatomy, partic-ularly in patients who are candidates for invasive treatments [4]. Cather angiography, or contrast angiography (CA) is the gold standard for vascular imaging. It is capable of producing high-resolution images of vascular anatomy. It requires the use of an injected contrast agent in conjunction with imaging technology. The contrast agent is administered via a percutaneous catheter inserted near the target vessel to be imaged.
CA is an invasive procedure and incurs risks associated with percutaneous arterial
access, catheter manipulation, contrast agents and radiation exposure. It is also the most costly imaging technique in use for PAD [25]. There are several non-invasive alternatives to CA. Duplex ultrasound is a relatively low-cost and widely used imag-ing technique [26]. It combines continuous-wave Doppler ultrasound with B-mode
ultrasound, which uses reflected sound waves to produce grayscale images of tissue structures. Duplex ultrasound can be used to visualize the flow of blood in
vascu-lar structures
[221.
Magnetic resonance angiography (MRA) is another non-invasiveimaging technique, and studies suggest that it is more accurate than duplex ultra-sound [26]. MRA uses magnetic resonance imaging technology, often coupled with intravenously injected contrast-enhancing agents, to rapidly produce two-dimensional and three-dimensional images of arterial structures. Computed tomographic angiog-raphy (CTA) is a relatively new non-invasive imaging technique, and has been shown in several early studies to perform well compared to existing techniques for detecting occlusions [261. CTA uses an intravenously injected contrast agent in conjunction with X-ray imaging. Like MRA, CTA is capable of rapidly acquiring images to produce three-dimensional images of arterial structures.
Dianosic ool Provides
Diagnostic tool .information about Advantages and disadvantages
Ankle-brachial / Fast, easy to perform
W index (ABI)
X
May be inaccurate for non-compressible arteriesSegmental
pressure Severity, location X May be inaccurate for non-compressible arteries
examination
a
Pulse volume . Useful for non-compressible arteriesr (Severity, location
W recording (PVR)
X Less accurate than other noninvasive localization tests
/Useful for non-compressible arteries
Continuous-wave
Doppler Severity, location X May report normal waveform downstream of severe stenoses
ultrasound X Limited accuracy in overlapping or densely calcified segments
Duplex 2D vascular / Inexpensive compared to CA
ultrasound structure Low-risk
Magnetic / Fast
resonance 3D vascular / Inexpensive compared to CA
e
angiography structure(MRA) X Cannot be used in patients with stents, pacemakers, and
certain implants / Fast
Computed
3D vascular / Inexpensive compared to CA
tomography structure in
.- angiography volumetric slices X Risks associated with contrast agents
S(CTA) X Relatively new, requires more studies of accuracy and
;> effectiveness
/ Established technique with well-studied accuracy and effectiveness
Contrast 2D vascular
angiography structure in limited X Expensive
(CA) orientations
X
InvasiveX Risks associated with contrast agents
Table 1.2: Comparison of diagnosis and imaging tools for PAD. These tools are listed in order from least expensive (ABI) to most expensive (CA). Many of these tools are also useful for monitoring patients after therapeutic interventions such as
The diagnostic tools that are currently used for PAD are summarized in Table 1.2. We hypothesize that video magnification technologies have the potential to visualize blood flow in a way that can identify the severity and location of PAD. These visual-izations are likely to be easier and less expensive to obtain than segemental pressure examinations, PVRs, and even the ABI. Furthermore, video magnification may be able to visualize the flow in vessels that are too small for existing vascular imaging techniques to capture. We will explain this in the following section, where we review some existing video-based techniques for assessing blood flow, and in particular, some existing video magnification algorithms.
1.2
Video-based techniques for measuring blood flow
The idea of obtaining measures of blood flow from videos is not new. In the past several decades, there has been considerable interest in simple and low-cost methods for obtaining measures of cardiac health; video-based methods have been particu-larly sought-after as they are inexpensive and non-invasive. Recently, Verkruysse et
al. demonstrated that is possible to obtain measurements of blood flow from videos
taken with a consumer grade digital camera
[27].
Their method is based onpho-toplethysmography (PPG), a simple and inexpensive optical technique in which the skin is illuminated with light of specific wavelengths (typically red or infrared), and a photodetector is used to measure changes in the reflected light that are associated with changes in blood volume. PPG utilizes the principle that light is attenuated by its interactions with biological tissue; the amount of light received by the photodetec-tor is dependent on facphotodetec-tors such as the blood volume in the tissue, the movement of
the blood vessel walls, and the oxygenation of blood 1281. In their work, Verkruysse
et al. took a video of a person's face under ambient lighting. From the video, they
measured the average intensity of a user-defined region of interest containing the face. After applying spatial averaging and temporal filtering to improve the signal-to-noise ratio, they were able to obtain accurate measures of the heart rate, as well as
obtained measures of the average heart rate from videos of stationary human faces. Their approach examined the mean intensity of an automatically determined region of interest in a video of a person's face, and applied blind source separation algorithms to obtain the signal corresponding to the flow of blood in the skin. Balakrishnan et al. showed that it is also possible to obtain a signal related to blood flow by examining the motion of the head [301. Their approach works by examining the horizontal and vertical trajectories of multiple tracked points in the face. Blind source separation techniques are then applied to produce a signal that coincides withe the flow of blood in the head, as verified by an electrocardiogram.
1.3
Video magnification for visualizing blood flow
We can view video magnification algorithms as a special class of video-based tech-niques. In general, the goal of video magnification is to magnify small changes in videos that are not visible to the naked eye. When applied to the task of examining blood flow, video magnification produces visualizations rather than measurements of the variations corresponding to the flow of blood.
Early work in video magnification took a Lagrangian approach, in which motions are explicitly computed and video frames are warped according to the magnified motion vectors [31, 32]. These techniques are useful for magnifying small motions, but are computationally expensive and often produced noticeable artifacts [2]. In recent years, several Eulerian approaches were proposed, in which the variations at specific pixel locations are amplified [1, 2, 31. These approaches are computationally inexpensive, and have been shown to be particularly adept at visualizing repetitive motions. The linear Eulerian video magnification algorithm (which we will refer to as linear video magnification) amplifies the intensity changes of pixels over time. This algorithm is useful for magnifying color changes as well as motion; for instance, it has been used to visualize the flow of blood in a human face [1]. However, the algorithm also magnifies some of the noise in the input video [2]. Eulerian phase-based motion magnification algorithms amplify the changes in spatial phase of pixels over time
[2, 3]. The algorithms are capable of producing videos with convincing and relatively
noise-free magnified motions. For instance, they have been used to visualize the
movement of a digital camera during the closing of the shutter [21, and the vibration of mechanical structures after being subjected to an impact [33]. In this work, we focus primarily on linear video magnification and its ability to visualize the color changes that occur as a result of blood perfusion in tissues.
The linear video magnification algorithm is capable of amplifying color changes and motion in videos taken with consumer grade cameras, using software running on a consumer grade computer. From an input video, it isolates the changes of interest by applying a spatial low-pass filter and a temporal bandpass filter. The application of the spatial lowpass filter is equivalent to performing spatial averaging on each frame, and serves the purpose of reducing the noise level and improving the signal-to-noise ratio (we will discuss this further in the next chapter). The temporal bandpass filter is used to isolate the frequencies close to the human heart rate. These changes are then multiplied by some constant factor and recombined with the input video to create an output video in which the isolated color changes and motions are amplified. Using this algorithm, Wu et al. were able to visualize the repetitive green to red variations
that occur when blood perfuses the face [34].
These results indicate that Eulerian linear video magnification may be useful for assessing blood perfusion in tissues. We believe that Eulerian linear video magnifica-tion can contribute to the diagnosis of PAD in two ways:
Cost Video magnification can quickly and cheaply produce visualizations that can aid in identifying the location and severity of PAD. Such a tool may be used as a low-cost alternative for the existing non-invasive vascular measures used in diagnosis of PAD, such as the ABI or PVRs.
Aggregate flow information
We believe that Eulerian linear video magnification can provide informa-tion about the blood flow patterns in blood vessels that are too small to be captured by existing imaging techniques. Eulerian linear video
magni-fication produces visualizations of the color changes that occur near the surface of the skin; these color changes reflect the blood volume changes in the small blood vessels' close to the surface [27, 281. Existing vascular imaging techniques are adept at visualizing the structure of large blood vessels, but are not suitable for imaging small vessels. For instance, high-resolution MRA is estimated to have a spatial high-resolution of 0.8mm x 0.8mm
[371; for comparison, the average diameter of capillaries in the human hand
is estimated to be 10pim [38]. The blood flow visualizations produced by video magnification might be used to supplement the information obtained
by vascular imaging techniques.
While Eulerian linear video magnification holds promise, at present, it also faces some challenges. Eulerian video magnification sometimes produces videos in which the signal-to-noise ratio (SNR) that is too low for the visualizations to be accurate or reliable. A low output SNR is caused by two main factors. The first factor is low signal amplitudes in the input video. Video magnification techniques produce the most interesting results when applied to small variations that are not discernible
by the naked eye. Thus, the signal of interest almost always has a small amplitude
compared to the image content. The second factor is the presence of noise that is difficult to remove. Photoplethysmographic measurements are susceptible to motion-related signal corruption [39]; these unwanted variations often fall within the same temporal frequency band as the physiological signal of interest [291. For instance, we may be interested in visualizing the rate at which blood perfuses the head, but as shown in [301, the flow of blood in the head is associated with a "bobbing" motion that is likely to obscure the more subtle variations caused by perfusion. Such unwanted variations cannot be removed using temporal filtering alone. Another noise term that is difficult to remove is the acquisition noise that is introduced by the video capture device, typically a digital camera. As we will discuss later, noise in digital cameras is generally assumed to be white Gaussian noise. This can be attenuated through spatial
'While the flow of blood in small blood vessels (or, the microvasculature) is generally assumed to be steady, studies have shown that the flow in some human vessels of inner diameter ~ 20pm still have pulsatile qualities [35, 36].
and temporal filtering but is difficult to remove completely. In video magnification algorithms, noise that is not removed by the filtering steps will be magnified in the output video. The combination of noise in the output and low signal amplitudes may result in an SNR that is too low for video magnification to produce meaningful results. To our knowledge, no studies thus far have attempted to measure the SNR in the context of video magnification.
In the following chapters, we present a a framework for determining the SNR of an input video that is intended for video magnification. We discuss a model of the signal and noise suitable for video magnification in general, as well a model for the specific use of video magnification for visualizing blood flow. We also present two algorithms for measuring the SNR of an input video, and compare the algorithms using a simulated image sequence.
Chapter 2
Signal and noise in video
magnification
In applications of video magnification, the visual changes of interest are often small relative to the noise level. This low signal-to-noise ratio (SNR) raises the following question: how accurate are the visualizations produced by video magnification al-gorithms? In particular, what is the SNR in visualizations of blood flow? In this chapter, we address this question by investigating the following sub-problems:
1. Model the signal and noise in a video intended for video magnification. This
model will allow us to develop algorithms for the next two steps.
2. Measure the signal amplitude and noise level in the input video. Compute the SNR of the input video (which we refer to as the input SNR).
3. Given the input SNR, predict the output SNR that can be achieved by the
Eulerian linear video magnification algorithm.
To our knowledge, no studies thus far have attempted to measure the SNR of the videos used in video magnification. While this work is tailored to the application of visualizing blood flow, the framework and algorithms that we present are useful in other applications of video magnification as well.
2.1
Definitions
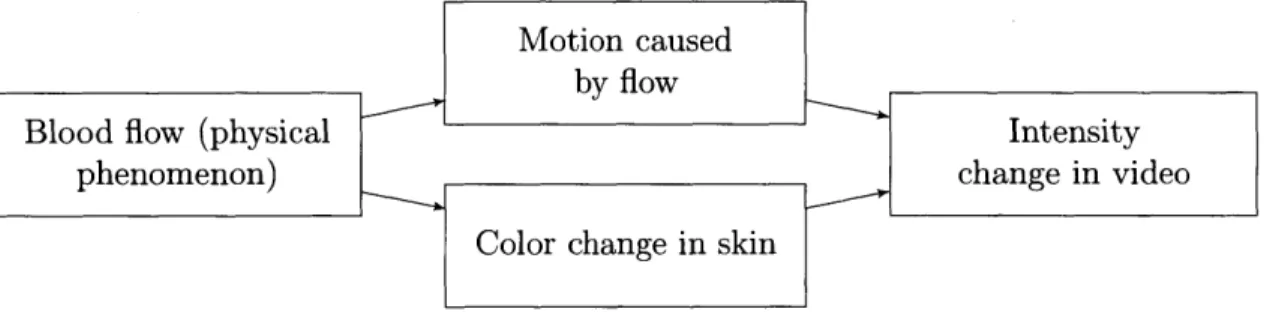
Video magnification is useful for visualizing small temporal variations in videos that would otherwise not be discernible. Variations in pixel intensity can originate from processes in the acquisition device such as analog-to-digital conversion (which intro-duces quantization noise to each pixel), or physical variations in the video scene such as color changes, lighting intensity changes or motion. Usually, one is interested in only magnifying changes in the video scene that are produced by some physical phe-nomenon of interest. Examples of interesting phenomena include subjecting a metal beam to an impact, or the flow of blood in the face.
Motion caused
Blood flow (physical bflwIntensity
phenomenon) change in video
Color change in skin
Figure 2-1: Video magnification algorithms visualize the phenomenon of interest by magnifying specific changes in the captured video. Blood flow is an example of a phenomenon that causes two types of changes in the video scene. In our work, we only want to visualize the color change in the skin.
We use the term source of interest to refer to the physical phenomenon pro-ducing the visual changes that one wishes to visualize. As described in Fig. 2-1, this phenomenon can produce multiple types of changes in the video scene. We define the intensity variations caused by the changes that we wish to visualize as the signal of interest (which we shall henceforth refer to as just the signal), and intensity variations caused by the the changes that we do not wish to visualize as ancillary signal. In addition to the source of interest, the scene might contain other sources of visual changes. These visual changes are also captured by the acquisition device as intensity changes in the video. The intensity variations in a video fall into three cate-gories: noise caused by the camera's image acquisition process (acquisition noise), variations caused by the phenomenon of interest, and variations caused by other
phenomena (artifactual noise). These terms are summarized in Fig. 2-2 below.
Noise caused by camera
(acquisition noise)
Figure 2-2: The types of temporal variations that occur in a video.
Acquisition noise
All digital cameras introduce noise during the image acquisition process.
The characteristics of this type of noise have been well studied, and there are many methods for removing or attenuating it.
interest
Video magnification differs from traditional image and video processing in that the signal of interest is not the uncorrupted image or image sequence, but rather the temporal variations in the image sequence that are caused by some physical phenomenon. This signal has a small amplitude relative to the possible range of pixel intensities, and relative to the total noise level. This makes the input SNR lower than what is typically seen in the image processing literature. In some applications, such as the visualization of blood flow, the signal of interest occupies a narrow range of temporal frequencies. Temporal variations in acquired video Visual changes in scene caused by source of interest Variations caused by other sources (artifactual noise) "Interesting" vari-ations caused by source of interest (signal of interest)
Other variations caused
by source of interest (ancillary signal)
Ancillary signal
In some cases, the source of interest introduces additional variations that we do not wish to magnify. For example, when examining blood flow in the human hand, we might be interested in the color changes resulting from the amount of blood in the skin, but not in the motions that are caused by the mechanical effects of the blood flow. This signal can be difficult to separate from the signal of interest because it has similar temporal signatures.
Artifactual noise
Other sources in the video scene may introduce variations to the video. For example, when examining blood flow in the human head, we may be interested in the motion caused by the flow of blood into the head, but not in the blinking motion of the eyes.
The goal of video magnification is to magnify as much of the signal and as little of the noise as possible. In other words, video magnification aims to attain the highest possible signal-to-noise ratio (SNR) in the magnified video. There are two main challenges in achieving this goal:
1. Ancillary signal and artifactual noise can be difficult to model, and cannot be removed or attenuated by existing video denoising algorithms that focus on removing acquisition noise.
2. The signal amplitude is often significantly lower than the acquisition noise level. Existing video magnification algorithms use temporal and spatial filtering to reduce the total noise level prior to magnifying the video. When the input SNR is very low, the existing denoising processes used in video magnification may be insufficient for generating an acceptable output SNR.
Later in this chapter, we shall see that in the context of visualizing blood flow, many types of ancillary signal and artifactual noise can be minimized by making fairly simple adjustments in the video capture stage or in the data processing stage. In the
next section, we discuss the problem of acquisition noise and how to measure it for the purpose of computing the input SNR.
2.2
Related work
2.2.1
Noise in images and image sequences
Modern images and image sequences are typically impaired by noise introduced by
the acquisition process, the compression process, or other factors such as motion [40].
Digital cameras introduce noise at several stages in the image acquisition process.
All modern digital cameras use an imaging sensor, most commonly a charge-coupled
device (CCD) sensor or a complementary-metal-oxide semiconductor (CMOS) sensor to produce voltages based on the photons incident upon the sensor. The number of photons at a collection site fluctuates randomly as a result of the quantum nature of light; this introduces shot noise, which is proportional to the square root of the number of incoming photons [41]. The sensor itself introduces several types of noise including dark current noise (caused by the free electrons generated by thermal energy in the sensor [41]), readout noise (introduced by the on-chip circuit that transforms the charge at each site on the sensor to a measurable voltage [41]) and pattern noise (a
systemic distortion caused by imperfections in the sensor
1421).
An analog-to-digitalconverter is used to sample the voltages from the sensor into digital signals, adding quantization noise [431. The intensity of a pixel in this raw image can be described as follows (see Table 2.1 for definitions):
Iraw = L + nshot(V7K) + L -nPRNU + ndark + nread + nFP + nq
where L is the incident light power
143,
45].Many digital cameras apply post-capture processing such as demosaicing, color correction and gamma correction. These processes can amplify, attenuate or distort
the noise in the raw image
[42].
Demosaicing is a color interpolation algorithm thatTable 2.1: Summary of
CMOS digital cameras.
the noise terms present in raw images captured by CCD or
Information adapted from [43, 44].
channels. It typically has the effect of attenuating spatial and temporal noise variance
[43], but introduces spatial correlations
[46].
Gamma correction is a nonlinearencod-ing that is used primarily to reduce the visual artifacts introduced by quantization
[471. The process can be described with a function g(.) that modifies an intensity u
according to g(u) = u'. In digital cameras, we often see 0 < -y < 1 [451; this has
the effect of increasing the noise in dark regions and decreasing the noise in bright regions, which we will see later in this chapter.
When the digital image is written to the camera's memory device, it may be
compressed, which introduces compression artifacts 142]. While most digital cameras
may be configured to output a RAW image file (that is, the image without any post-capture processing effects), this option is often not available for videos.
In the video denoising and image denoising literatures, the noise caused by the acquisition step is commonly assumed to be additive zero-mean white Gaussian noise, even though some noise effects may actually be multiplicative or spatially correlated
[43, 48, 491. Furthermore, all imaging sensors are affected by shot noise, which is
Noise type Term Origin Manifestation
9 Shot noise nshot Physical nature of Additive temporal and spatial variance
photons Photo-response
non-uniformity (a Imperfections in
nPRNU Multiplicative spatial variance
type of pattern sensor
noise)
Free electrons
Dark current generated by
noise
ndark
thermal energy in Additive temporal and spatial variancesensor
Noise in circuit that
Readout noise
nrea
transforms charge Additive temporal and spatial variancefrom sensor into voltage
Fixed-pattern
noise (a type of
nFP
Ier Additive spatial variancesensor pattern noise)
Quantization Analog-to-digital
strongly dependent on the amount of incident light. CCD noise models typically assume that the noise is independent between pixels, but is signal dependent in that the noise level at any given pixel depends on the uncorrupted pixel intensity [45].
CMOS image sensors have also been shown to introduce noise with levels that are
dependent on the incoming photocurrent [501. The relationship between the noise level and mean pixel intensity is described by a noise level function (NLF), which is dependent on the natural behavior of photons, the properties of the camera and some
recording parameters
134,
51].2.2.2
SNR estimation
We examine the individual problems of noise and signal estimation. Noise estimation is useful in many computer vision algorithms such as denoising and motion estimation
[34].
The general principle of noise estimation is to measure the deviations in intensity over structure-free areas (that is, areas in the image where the signal is known to be homogenous and all variations are caused by noise rather than textures or lighting in the image scene) [521, or over multiple images of the same scene [41]. When one has a multiple images of a static scene containing a wide range of pixel intensities, such as in a video of a stationary color calibration target, the NLF may be estimated by simply measuring the standard deviation over time of the pixels at every mean pixel intensity [41, 51]. Noise estimation from a single image or from videos of non-stationary scenes is more difficult. Noise estimation from a single image tends to work in two ways:by filtering the image to reduce structure and then measuring the noise level from
the filtered image [34, 52], or by classifying certain image regions as homogenous and measuring the noise level in those regions [53, 52].
The signal in most traditional image processing literature is defined as the original image before it has been corrupted by noise. The analog to our signal estimation problem in traditional image processing is the problem of image and video denoising, which aims to recover the uncorrupted image from a noisy image. A large class of image denoising techniques rely on the concept of averaging to reduce noise levels. In magnetic resonance imaging, for example, the signal is commonly approximated
using the mean intensity of some user-defined regions of interest [54, 55j. One of the simplest automatic image denoising methods is the Gaussian smoothing approach, in which the the corrupted image is convolved with a Gaussian kernel to reduce the level of Gaussian noise [56]. A more complex local filtering method is anisotropic filtering, which reduces the unwanted blurring effects of the Gaussian kernel by preserving sharp edges [57]. There are many other techniques that use local filtering, frequency domain filtering or non-local filtering [561. Video denoising techniques use similar techniques to image denoising, but also utilize the temporal dimension to achieve better results. Many video denoising algorithms also apply motion compensation
methods in order to preserve temporal coherence
[45].
Several key differences make it difficult to directly apply traditional denoising techniques to signal estimation and denoising in video magnification. Firstly, video magnification is affected by ancillary signal and artifactual noise, which may be harder to model than acquisition noise. Many state-of-the art video denoising techniques are capable of removing the types of noise commonly introduced by imaging devices such as additive, multiplicative or structural noise [58, 48], but may not be applicable
to more complex noise models. Secondly, video magnification provides the most
useful results when applied to videos with low input signal levels. Most existing denoising algorithms focus on applications with relatively high input SNR's, and may not be accurate enough to estimate a low amplitude signal. For example, many video denoising algorithms are evaluated on image sequences with peak signal-to-noise ratio (PSNR) values in the 10-30 dB range, and obtain improvements in PSNR on the order of 0-10 dB [59, 60]. In contrast, in order to visualize blood flow in the human face using Eulerian video magnification, a magnification factor of 100 has been reported
[1]; this indicates that the amplitude of the color variation in the input video is low
relative to the image intensity, and that the SNR is frequently much lower than 10 dB.
We also consider existing techniques for one-dimensional signals. The problem of speech enhancement bears promising similarities to the problems in video magnifi-cation. Speech enhancement aims to produce an uncorrupted speech signal from an
audio segment containing noisy speech. The noise in speech recordings is typically assumed to be additive and signal-independent [61]. Practical speech enhancement algorithms are expected to be effective in real-world environments with low SNR values, e.g., -5dB to 15dB [62]. Speech enhancement differs from most problems in video magnification in that the desired speech signal occupies a wide frequency range
(speech signals are often band-limited at 0 - 4 kHz [63]). Furthermore, human
per-ception of speech is affected by many spectral features such as the low-pass shape of the speech spectrum, and spectral peaks [62, 64]. As such, most speech enhance-ment algorithms are concerned with estimating the noise spectrum and recovering the spectrum of the clean speech signal [62]. Speech enhancement algorithms fall into several categories. Spectral subtractive algorithms involve estimating the noise spec-trum (typically in the Fourier domain) from a speech-free segment of a recording, and then subtracting the noise spectrum from noisy speech in order to obtain an estimate of the uncorrupted speech signal [62, 65]. Spectral subtractive algorithms are simple to implement. Subspace algorithms use matrix factorization techniques such as sin-gular value decomposition to decompose the speech recording into a subspace that primarily contains the uncorrupted signal and a subspace that primarily contains the noise [62]. Another class of speech enhancement algorithms use statistical models of speech to estimate parameters of the uncorrupted speech signal and noise [66, 62].
In the following sections, we provide definitions of signal and noise suitable for video magnification. We then investigate two algorithms for estimating the signal and noise level of each pixel in a video sequence.
2.3
Signal and noise model
In this section, we define a model to describe the signal and noise in the context of video magnification. This model will allow us to develop algorithms for computing the input SNR.
2.3.1
General case
In Fig. 2-2, we defined the signal of interest to be the variations caused by the "interesting" changes in the video effected by some source of interest. This signal is corrupted by ancillary signal, artifactual noise and acquisition noise. In the Eulerian video magnification work, Wu textitet al. present a model for a video in which the signal is the variations in the video that are caused by rigid motion in the video scene. The rigid motion is effected by sources such as the flow of blood in a human's head, or the opening and closing of a camera shutter [1]. Here, we present a similar model that includes a more general definition of signal, as well the aforementioned noise terms.
Let I(x, t) denote the image intensity at the 2D location x and time t. The average frame of the image sequence is Io(x). We assume that the temporal variations in the video are small relative to the intensity of the mean frame.
We use the term ng(x, t) to describe acquisition noise, and assume that it may be modeled by additive white Gaussian noise with pixel-dependent variance. We use the term
#(x,
t, Io) to describe variations caused by the source of interest, whichencompasses the signal of interest and the ancillary signal. We describe variations caused by all other sources, or artifactual noise (see Fig. 2-2), using n" (x, t, Io). We
model the image sequence as follows:
I(x, t)
=Io(x)
+
(x,
t, Io) + na(x, t, Io) + ng (x, t)
(2.1)
For now, let us assume that the source of interest only produces one type of change (e.g., a color change with no motion) in the scene. Ideally, video magnification should produce the following:
Imag(X, t)
=
Io(x) + (1 +
a)#(x,
t, Io)
(2.2)
also amplified:
Imag(X, t) = Io(x) + (1 + a)( (x, tIo) + ana (X, t, Io) + gng (x, t))
where a and g represent some noise reduction factors that may be achieved through
a variety of techniques including image stabilization, spatial filtering, and temporal filtering.
2.3.2
Visualizing blood flow
In the specific application of visualizing blood flow, we make additional assumptions that allow us to simplify the model presented in the previous section.
We define the signal to be the intensity variations caused by the color changes in
the skin that occur as a result of pulsatile blood flow. In [30], Balakrishnan textitet al.
showed that the flow of blood in the head also appears to produce a mechanical effect that causes the head to move, which can be visualized using video magnification. In our work, we define any intensity variations that occur as a result of the mechanical effect of blood flow (e.g. rigid motions of the limb, or pulsating motions visible on the surface of the skin) to be ancillary signal. Equation 2.1 becomes:
I(x, t) = Io(x) + 0coior (X, t, Io) + Omotion(X, t, Io) + #a (X, t, Io) + ng(x, t) (2.3)
For now, we assume that the bmotion term is negligible after mechanically and/or
computationally stabilizing the video subject and image sequence respectively. We will discuss this assumption later. Equation 2.3 simplifies to:
I(x, t) = Io(x) + #coior (X, t, Io) + ng (x, t) (2.4)
We assume that colo,(x, t) has zero mean. Furthermore, we assume that the


![Figure 2-4: Summary of the spatial averaging algorithm. We first estimate the fit of Vart[Im(x, t)] (the total variance) against u (the inverse filter area, not shown to scale in the figure)](https://thumb-eu.123doks.com/thumbv2/123doknet/14060459.461291/49.918.218.684.130.390/figure-summary-spatial-averaging-algorithm-estimate-variance-inverse.webp)