arXiv:1006.0618v3 [hep-ex] 13 Oct 2010
Measurement of the normalized
Z/γ
∗→ µ
+µ
−transverse momentum distribution in
p ¯
p collisions at
√
s = 1.96 TeV
V.M. Abazov,35 B. Abbott,73 M. Abolins,62 B.S. Acharya,29 M. Adams,48 T. Adams,46 G.D. Alexeev,35 G. Alkhazov,39A. Altona,61G. Alverson,60 G.A. Alves,2 L.S. Ancu,34 M. Aoki,47 Y. Arnoud,14 M. Arov,57 A. Askew,46 B. ˚Asman,40 O. Atramentov,65C. Avila,8 J. BackusMayes,80F. Badaud,13L. Bagby,47B. Baldin,47
D.V. Bandurin,46 S. Banerjee,29 E. Barberis,60 A.-F. Barfuss,15 P. Baringer,55 J. Barreto,2 J.F. Bartlett,47 U. Bassler,18S. Beale,6 A. Bean,55 M. Begalli,3 M. Begel,71 C. Belanger-Champagne,40 L. Bellantoni,47 J.A. Benitez,62 S.B. Beri,27 G. Bernardi,17 R. Bernhard,22 I. Bertram,41 M. Besan¸con,18 R. Beuselinck,42
V.A. Bezzubov,38 P.C. Bhat,47 V. Bhatnagar,27 G. Blazey,49 S. Blessing,46 K. Bloom,64 A. Boehnlein,47 D. Boline,70 T.A. Bolton,56 E.E. Boos,37 G. Borissov,41T. Bose,59 A. Brandt,76 O. Brandt,23 R. Brock,62 G. Brooijmans,68A. Bross,47D. Brown,19X.B. Bu,7D. Buchholz,50 M. Buehler,79 V. Buescher,24 V. Bunichev,37
S. Burdinb,41 T.H. Burnett,80 C.P. Buszello,42 P. Calfayan,25 B. Calpas,15 S. Calvet,16 E. Camacho-P´erez,32 J. Cammin,69 M.A. Carrasco-Lizarraga,32E. Carrera,46B.C.K. Casey,47 H. Castilla-Valdez,32S. Chakrabarti,70
D. Chakraborty,49K.M. Chan,53 A. Chandra,78G. Chen,55 S. Chevalier-Th´ery,18D.K. Cho,75 S.W. Cho,31 S. Choi,31B. Choudhary,28 T. Christoudias,42 S. Cihangir,47 D. Claes,64 J. Clutter,55 M. Cooke,47 W.E. Cooper,47
M. Corcoran,78F. Couderc,18M.-C. Cousinou,15 A. Croc,18 D. Cutts,75 M. ´Cwiok,30 A. Das,44 G. Davies,42 K. De,76 S.J. de Jong,34 E. De La Cruz-Burelo,32F. D´eliot,18 M. Demarteau,47R. Demina,69 D. Denisov,47 S.P. Denisov,38 S. Desai,47 K. DeVaughan,64 H.T. Diehl,47 M. Diesburg,47 A. Dominguez,64 T. Dorland,80 A. Dubey,28 L.V. Dudko,37 D. Duggan,65 A. Duperrin,15 S. Dutt,27 A. Dyshkant,49M. Eads,64D. Edmunds,62 J. Ellison,45V.D. Elvira,47 Y. Enari,17S. Eno,58 H. Evans,51A. Evdokimov,71V.N. Evdokimov,38G. Facini,60 A.V. Ferapontov,75T. Ferbel,58, 69 F. Fiedler,24 F. Filthaut,34 W. Fisher,62H.E. Fisk,47 M. Fortner,49H. Fox,41 S. Fuess,47 T. Gadfort,71 A. Garcia-Bellido,69V. Gavrilov,36 P. Gay,13W. Geist,19 W. Geng,15, 62 D. Gerbaudo,66
C.E. Gerber,48Y. Gershtein,65 D. Gillberg,6 G. Ginther,47, 69 G. Golovanov,35 A. Goussiou,80P.D. Grannis,70 S. Greder,19 H. Greenlee,47 Z.D. Greenwood,57E.M. Gregores,4 G. Grenier,20 Ph. Gris,13 J.-F. Grivaz,16 A. Grohsjean,18 S. Gr¨unendahl,47 M.W. Gr¨unewald,30F. Guo,70 J. Guo,70 G. Gutierrez,47 P. Gutierrez,73 A. Haasc,68 P. Haefner,25S. Hagopian,46 J. Haley,60L. Han,7 K. Harder,43A. Harel,69J.M. Hauptman,54 J. Hays,42
T. Hebbeker,21 D. Hedin,49 A.P. Heinson,45 U. Heintz,75 C. Hensel,23 I. Heredia-De La Cruz,32 K. Herner,61 G. Hesketh,60 M.D. Hildreth,53 R. Hirosky,79 T. Hoang,46 J.D. Hobbs,70 B. Hoeneisen,12 M. Hohlfeld,24
S. Hossain,73 Y. Hu,70 Z. Hubacek,10 N. Huske,17 V. Hynek,10 I. Iashvili,67 R. Illingworth,47 A.S. Ito,47 S. Jabeen,75 M. Jaffr´e,16 S. Jain,67 D. Jamin,15 R. Jesik,42 K. Johns,44 M. Johnson,47 D. Johnston,64
A. Jonckheere,47 P. Jonsson,42 J. Joshi,27 A. Justed,47 K. Kaadze,56 E. Kajfasz,15 D. Karmanov,37 P.A. Kasper,47I. Katsanos,64R. Kehoe,77 S. Kermiche,15 N. Khalatyan,47A. Khanov,74 A. Kharchilava,67
Y.N. Kharzheev,35 D. Khatidze,75 M.H. Kirby,50M. Kirsch,21 J.M. Kohli,27 A.V. Kozelov,38J. Kraus,62 A. Kumar,67 A. Kupco,11 T. Kurˇca,20 V.A. Kuzmin,37 J. Kvita,9 S. Lammers,51 G. Landsberg,75 P. Lebrun,20 H.S. Lee,31 W.M. Lee,47 J. Lellouch,17L. Li,45Q.Z. Li,47 S.M. Lietti,5 J.K. Lim,31 D. Lincoln,47J. Linnemann,62
V.V. Lipaev,38 R. Lipton,47 Y. Liu,7 Z. Liu,6 A. Lobodenko,39M. Lokajicek,11 P. Love,41 H.J. Lubatti,80 R. Luna-Garciae,32 A.L. Lyon,47 A.K.A. Maciel,2 D. Mackin,78R. Madar,18 R. Maga˜na-Villalba,32 S. Malik,64
V.L. Malyshev,35Y. Maravin,56 J. Mart´ınez-Ortega,32 R. McCarthy,70 C.L. McGivern,55 M.M. Meijer,34 A. Melnitchouk,63 D. Menezes,49 P.G. Mercadante,4 M. Merkin,37 A. Meyer,21J. Meyer,23 N.K. Mondal,29 T. Moulik,55G.S. Muanza,15 M. Mulhearn,79 E. Nagy,15M. Naimuddin,28 M. Narain,75R. Nayyar,28H.A. Neal,61
J.P. Negret,8 P. Neustroev,39 H. Nilsen,22 S.F. Novaes,5 T. Nunnemann,25 G. Obrant,39 D. Onoprienko,56 J. Orduna,32 N. Osman,42 J. Osta,53 G.J. Otero y Garz´on,1 M. Owen,43 M. Padilla,45 M. Pangilinan,75 N. Parashar,52V. Parihar,75S.K. Park,31 J. Parsons,68R. Partridgec,75 N. Parua,51A. Patwa,71B. Penning,47
M. Perfilov,37K. Peters,43 Y. Peters,43G. Petrillo,69 P. P´etroff,16 R. Piegaia,1 J. Piper,62 M.-A. Pleier,71 P.L.M. Podesta-Lermaf,32 V.M. Podstavkov,47M.-E. Pol,2P. Polozov,36 A.V. Popov,38M. Prewitt,78D. Price,51 S. Protopopescu,71J. Qian,61A. Quadt,23 B. Quinn,63M.S. Rangel,16 K. Ranjan,28 P.N. Ratoff,41I. Razumov,38
P. Renkel,77 P. Rich,43 M. Rijssenbeek,70 I. Ripp-Baudot,19 F. Rizatdinova,74 M. Rominsky,47 C. Royon,18 P. Rubinov,47 R. Ruchti,53 G. Safronov,36 G. Sajot,14 A. S´anchez-Hern´andez,32 M.P. Sanders,25 B. Sanghi,47
A.S. Santos,5 G. Savage,47 L. Sawyer,57 T. Scanlon,42 D. Schaile,25 R.D. Schamberger,70Y. Scheglov,39 H. Schellman,50 T. Schliephake,26 S. Schlobohm,80 C. Schwanenberger,43R. Schwienhorst,62 J. Sekaric,55 H. Severini,73E. Shabalina,23 V. Shary,18 A.A. Shchukin,38 R.K. Shivpuri,28 V. Simak,10 V. Sirotenko,47 P. Skubic,73 P. Slattery,69 D. Smirnov,53 G.R. Snow,64 J. Snow,72 S. Snyder,71 S. S¨oldner-Rembold,43 L. Sonnenschein,21 A. Sopczak,41 M. Sosebee,76 K. Soustruznik,9 B. Spurlock,76 J. Stark,14 V. Stolin,36 D.A. Stoyanova,38E. Strauss,70 M. Strauss,73R. Str¨ohmer,25 D. Strom,48 L. Stutte,47P. Svoisky,34M. Takahashi,43 A. Tanasijczuk,1 W. Taylor,6B. Tiller,25 M. Titov,18V.V. Tokmenin,35 D. Tsybychev,70 B. Tuchming,18 C. Tully,66
P.M. Tuts,68 R. Unalan,62 L. Uvarov,39S. Uvarov,39 S. Uzunyan,49 R. Van Kooten,51 W.M. van Leeuwen,33 N. Varelas,48 E.W. Varnes,44 I.A. Vasilyev,38 P. Verdier,20 L.S. Vertogradov,35M. Verzocchi,47M. Vesterinen,43
D. Vilanova,18 P. Vint,42 P. Vokac,10 H.D. Wahl,46 M.H.L.S. Wang,69 J. Warchol,53G. Watts,80 M. Wayne,53 G. Weber,24 M. Weberg,47 M. Wetstein,58 A. White,76 D. Wicke,24 M.R.J. Williams,41 G.W. Wilson,55 S.J. Wimpenny,45 M. Wobisch,57 D.R. Wood,60 T.R. Wyatt,43 Y. Xie,47 C. Xu,61 S. Yacoob,50 R. Yamada,47
W.-C. Yang,43 T. Yasuda,47Y.A. Yatsunenko,35 Z. Ye,47 H. Yin,7 K. Yip,71 H.D. Yoo,75 S.W. Youn,47 J. Yu,76 S. Zelitch,79 T. Zhao,80 B. Zhou,61 J. Zhu,70 M. Zielinski,69 D. Zieminska,51 and L. Zivkovic68
(The D0 Collaboration∗)
1Universidad de Buenos Aires, Buenos Aires, Argentina
2LAFEX, Centro Brasileiro de Pesquisas F´ısicas, Rio de Janeiro, Brazil
3Universidade do Estado do Rio de Janeiro, Rio de Janeiro, Brazil
4Universidade Federal do ABC, Santo Andr´e, Brazil
5Instituto de F´ısica Te´orica, Universidade Estadual Paulista, S˜ao Paulo, Brazil
6Simon Fraser University, Vancouver, British Columbia, and York University, Toronto, Ontario, Canada
7University of Science and Technology of China, Hefei, People’s Republic of China
8Universidad de los Andes, Bogot´a, Colombia
9Charles University, Faculty of Mathematics and Physics,
Center for Particle Physics, Prague, Czech Republic
10Czech Technical University in Prague, Prague, Czech Republic
11Center for Particle Physics, Institute of Physics,
Academy of Sciences of the Czech Republic, Prague, Czech Republic
12Universidad San Francisco de Quito, Quito, Ecuador
13LPC, Universit´e Blaise Pascal, CNRS/IN2P3, Clermont, France
14LPSC, Universit´e Joseph Fourier Grenoble 1, CNRS/IN2P3,
Institut National Polytechnique de Grenoble, Grenoble, France
15CPPM, Aix-Marseille Universit´e, CNRS/IN2P3, Marseille, France
16LAL, Universit´e Paris-Sud, CNRS/IN2P3, Orsay, France
17LPNHE, Universit´es Paris VI and VII, CNRS/IN2P3, Paris, France
18CEA, Irfu, SPP, Saclay, France
19IPHC, Universit´e de Strasbourg, CNRS/IN2P3, Strasbourg, France
20IPNL, Universit´e Lyon 1, CNRS/IN2P3, Villeurbanne, France and Universit´e de Lyon, Lyon, France
21III. Physikalisches Institut A, RWTH Aachen University, Aachen, Germany
22Physikalisches Institut, Universit¨at Freiburg, Freiburg, Germany
23II. Physikalisches Institut, Georg-August-Universit¨at G¨ottingen, G¨ottingen, Germany
24Institut f¨ur Physik, Universit¨at Mainz, Mainz, Germany
25Ludwig-Maximilians-Universit¨at M¨unchen, M¨unchen, Germany
26Fachbereich Physik, Bergische Universit¨at Wuppertal, Wuppertal, Germany
27Panjab University, Chandigarh, India
28Delhi University, Delhi, India
29Tata Institute of Fundamental Research, Mumbai, India
30University College Dublin, Dublin, Ireland
31Korea Detector Laboratory, Korea University, Seoul, Korea
32CINVESTAV, Mexico City, Mexico
33FOM-Institute NIKHEF and University of Amsterdam/NIKHEF, Amsterdam, The Netherlands
34Radboud University Nijmegen/NIKHEF, Nijmegen, The Netherlands
35Joint Institute for Nuclear Research, Dubna, Russia
36Institute for Theoretical and Experimental Physics, Moscow, Russia
37Moscow State University, Moscow, Russia
38Institute for High Energy Physics, Protvino, Russia
39Petersburg Nuclear Physics Institute, St. Petersburg, Russia
40Stockholm University, Stockholm and Uppsala University, Uppsala, Sweden
41Lancaster University, Lancaster LA1 4YB, United Kingdom
43The University of Manchester, Manchester M13 9PL, United Kingdom
44University of Arizona, Tucson, Arizona 85721, USA
45University of California Riverside, Riverside, California 92521, USA
46Florida State University, Tallahassee, Florida 32306, USA
47Fermi National Accelerator Laboratory, Batavia, Illinois 60510, USA
48University of Illinois at Chicago, Chicago, Illinois 60607, USA
49Northern Illinois University, DeKalb, Illinois 60115, USA
50Northwestern University, Evanston, Illinois 60208, USA
51Indiana University, Bloomington, Indiana 47405, USA
52Purdue University Calumet, Hammond, Indiana 46323, USA
53University of Notre Dame, Notre Dame, Indiana 46556, USA
54Iowa State University, Ames, Iowa 50011, USA
55University of Kansas, Lawrence, Kansas 66045, USA
56Kansas State University, Manhattan, Kansas 66506, USA
57Louisiana Tech University, Ruston, Louisiana 71272, USA
58University of Maryland, College Park, Maryland 20742, USA
59Boston University, Boston, Massachusetts 02215, USA
60Northeastern University, Boston, Massachusetts 02115, USA
61University of Michigan, Ann Arbor, Michigan 48109, USA
62Michigan State University, East Lansing, Michigan 48824, USA
63University of Mississippi, University, Mississippi 38677, USA
64University of Nebraska, Lincoln, Nebraska 68588, USA
65Rutgers University, Piscataway, New Jersey 08855, USA
66Princeton University, Princeton, New Jersey 08544, USA
67State University of New York, Buffalo, New York 14260, USA
68Columbia University, New York, New York 10027, USA
69University of Rochester, Rochester, New York 14627, USA
70State University of New York, Stony Brook, New York 11794, USA
71Brookhaven National Laboratory, Upton, New York 11973, USA
72Langston University, Langston, Oklahoma 73050, USA
73University of Oklahoma, Norman, Oklahoma 73019, USA
74Oklahoma State University, Stillwater, Oklahoma 74078, USA
75Brown University, Providence, Rhode Island 02912, USA
76University of Texas, Arlington, Texas 76019, USA
77Southern Methodist University, Dallas, Texas 75275, USA
78Rice University, Houston, Texas 77005, USA
79University of Virginia, Charlottesville, Virginia 22901, USA
80University of Washington, Seattle, Washington 98195, USA
(Dated: June 3rd, 2010)
We present a new measurement of the Z/γ∗ transverse momentum distribution in the range 0
– 330 GeV, in proton-antiproton collisions at√s = 1.96 TeV. The measurement uses 0.97 fb−1 of
integrated luminosity recorded by the D0 experiment and is the first using the Z/γ∗→ µ+
µ−+X
channel at this center-of-mass energy. This is also the first measurement of the Z/γ∗ transverse
momentum distribution that presents the result at the level of particles entering the detector,
min-imizing dependence on theoretical models. As any momentum of the Z/γ∗in the plane transverse
to the incoming beams must be balanced by some recoiling system, primarily the result of QCD radiation in the initial state, this variable is an excellent probe of the underlying process. Tests of the predictions of QCD calculations and current event generators show they have varied success in describing the data. Using this measurement as an input to theoretical predictions will allow for a better description of hadron collider data and hence it will increase experimental sensitivity to rare signals.
PACS numbers: 12.38.Qk, 13.85.Qk
∗with visitors from aAugustana College, Sioux Falls, SD, USA, bThe University of Liverpool, Liverpool, UK,cSLAC, Menlo Park,
CA, USA,dICREA/IFAE, Barcelona, Spain,eCentro de
Investiga-cion en ComputaInvestiga-cion - IPN, Mexico City, Mexico,fECFM,
Uni-versidad Autonoma de Sinaloa, Culiac´an, Mexico, andgUniversit¨at
In the complex environment of a hadron collider, such as the Fermilab Tevatron Collider or the CERN Large Hadron Collider, the Z/γ∗→ e+e− and Z/γ∗→ µ+µ− processes are experimentally simple to identify and have little background. Further, reconstruction of the Z/γ∗ kinematics provides an unambiguous, colorless probe of the underlying collision process. Momentum conserva-tion requires that any momentum component of the Z/γ∗ in the direction transverse to the incoming hadron beams (pT) must be balanced by a recoiling system (X), typ-ically the result of QCD radiation in the initial state. The Z/γ∗ p
T is therefore sensitive to the nature of this radiation across a wide momentum range, making it a compelling variable and an excellent testing ground for theoretical predictions.
Several tools have been developed which give a predic-tion of the Z/γ∗p
T distribution, from fixed order pertur-bative QCD (pQCD) calculations valid at high pT, such as mcfm [1], fewz [2] and dynnlo [3], to predictions based on gluon resummation valid at low pT [4], such as resbos [5]. Various complete event generators are also available, including pythia [6], herwig [7], alpgen [8], and sherpa [9], which cover both high and low pT regions by interfacing tree-level matrix element calculations to a parton shower resummation model. Comparisons be-tween these generators show that they differ significantly in the predicted kinematics of boson and boson+jet pro-duction, and that these predictions have a strong depen-dence on various adjustable internal generator parame-ters [10]. Measurements of the Z/γ∗ p
T and other kine-matic quantities in Z/γ∗ production are therefore an es-sential input to improve these models, which are also used to predict the properties of rare signals like the Higgs bo-son and its main backgrounds: W +jets, Z/γ∗+jets and diboson production. Such improvements will result in increased experimental sensitivity to these rare signals.
Previous measurements at the Tevatron have stud-ied the Z/γ∗ p
T and rapidity distributions both inclu-sively [11–14] and in events with at least one jet [15]. Other measurements have focused on the kinematics of the jets in Z/γ∗ or W boson events [15–19], of the an-gular correlations between the Z/γ∗and leading jet [20], and of the production of Z/γ∗ or W boson in associ-ation with heavy flavor quarks [21–24]. In this Letter, we describe a new measurement of the normalized inclu-sive Z/γ∗→ µ+µ− pT distribution, the first such mea-surement using the dimuon channel in the Tevatron run beginning 2001 (“Run II”). The differential dimuon+X cross section is measured as a function of the dimuon pT (pZ
T), then normalized to the measured inclusive dimuon cross section, canceling many systematic uncertainties. The shape of the Z/γ∗ p
T distribution has previously been measured in Run II with the Z/γ∗→ e+e− chan-nel [13], using a comparable integrated luminosity. In that result, a resummation prediction was found to be consistent with the data in the pT < 30 GeV region,
but pQCD predictions were found to be 25% below the data in the region pT > 30 GeV. Compared to that re-sult, the muon channel uses a statistically independent dataset, has a different detector acceptance, and differ-ent sources of systematic uncertainty; it therefore adds important information on the Z/γ∗ p
T distribution and any disagreements between the data and theory predic-tions. Due to the different response of the detector to electrons and muons, there is also different sensitivity to QED final state radiation (FSR) in the dielectron and dimuon systems [25].
An important development in this analysis is the def-inition of the final observable: for the first time in a measurement of the Z/γ∗ p
T, the results are presented at the level of particles entering the detector. Previous measurements have applied theoretical factors to go from these particles to the (non-observable) Z/γ∗ by correct-ing for any undetected FSR, and from the measured lep-ton acceptance to full 4π coverage, correcting for unde-tected leptons. These factors rely upon models of FSR and the correlation between boson rapidity and pT. Here, we avoid such factors and present the data in terms of an observable: the pT of the dimuon system, for muons within the detector acceptance. This approach minimizes dependence on theoretical models, and the result can be used as an unbiased test of such models. This is also the same definition of the dimuon final state as previ-ous D0 measurements of Z/γ∗(→ µ+µ−)+jet+X pro-duction [15, 20], and the relationship between pZ
T and the production of jets in the final state makes this mea-surement complementary to those results.
The analysis uses a dataset of p¯p collisions at √
s = 1.96 TeV, corresponding to an integrated luminos-ity of 0.97 ± 0.06 fb−1 [26] recorded by the D0 detec-tor between April 2002 and February 2006. A full de-scription of the D0 detector is available elsewhere [27], and only a brief description of the components most rel-evant for this analysis is given here. The p¯p interaction region is surrounded by two tracking detectors: a sili-con microstrip tracker and a scintillating fiber tracker, both housed inside a solenoidal magnet providing a field of approximately 2 T. These trackers provide a momen-tum measurement for charged particles and are used to reconstruct the primary interaction point in each colli-sion. Outside the solenoid is a liquid-argon and uranium calorimeter which is split into three sections: a central section covering |η| < 1.1 [28] and two forward sections covering 1.4 < |η| < 4.2. Outside the calorimeter there are three layers of muon detectors, made of a combina-tion of scintillacombina-tion counters and drift chambers covering |η| < 1, and scintillation counters and drift tubes extend-ing the coverage to |η| < 2. A 1.8 T iron toroidal magnet is located between the first and second layer, providing an independent momentum measurement for muons.
Events used in this analysis are selected by at least one of a suite of single-muon triggers. These triggers
used a fast readout from muon system, or a combination of the fiber tracker and muon system, to identify muon candidates. Then information from the full tracking and muon systems is incorporated to provide further rejec-tion. Additional requirements are then applied to the events selected by the trigger to obtain a sample of Z/γ∗ candidates. Using the full information from the muon detectors and the tracking system, two muons of oppo-site charge and pT> 15 GeV are required, with a dimuon mass in the range 65 < Mµµ< 115 GeV. To reject cosmic rays and poorly reconstructed muons, the muon tracks are required to be consistent with the reconstructed pri-mary interaction point both along the beam direction and in the transverse plane. The two muon tracks are also re-quired not to be colinear, and to be consistent with the p¯p bunch crossing time using timing information from the muon system scintillators. Further selections are applied to limit the measurement to regions with high detection efficiency: the muons are required to have |η| < 1.7, and the primary vertex must lie within 50 cm of the center of the detector in the coordinate along the direction of the beam. In total, 59,336 dimuon candidate events pass all selection requirements.
The main background in this analysis is dijet tion with two semi-leptonic decays, or W +jets produc-tion in which one muon comes from the W and the other from a semi-leptonic decay in a jet. These events are reduced to a negligible level by two isolation require-ments. First, we reject overlaps between muons and jets with pT> 15 GeV, by requiring angular separation p(∆φ)2+ (∆η)2> 0.5, where φ is the azimuthal angle. Then, we require the product of the isolation variables for the two muons to be < 0.05, where each isolation variable is calculated by taking the sum of track pT and calorime-ter energy in a cone around each muon (excluding the muon track and calorimeter energy associated with the muon itself), and dividing by the muon pT.
The remaining contribution from these backgrounds is estimated from data by studying the product of the iso-lation variables for muons failing isoiso-lation requirements. Extrapolating into the selected region shows this back-ground to be < 0.5% of the final sample. The remain-ing backgrounds (from t¯t, W W , W Z, and Z/γ∗→ τ+τ− production), as well as the Z/γ∗→ µ+µ−+X sig-nal, are modeled with pythia v6.409. A separate Z/γ∗→ µ+µ−+X sample is generated using alpgen v2.11 with pythia v6.409 for parton showering. All simulated signal and background samples are normal-ized to higher order theoretical predictions [29, 30] and passed through a geant [31] simulation of the D0 detec-tor. The total background from all sources is found to be below 2% everywhere and less than 1% in the region pZ
T< 50 GeV. The estimated background contribution is subtracted from data and a 10% systematic uncertainty is assigned to each background normalization to cover all sources of uncertainty.
To extract the shape of the pZ
T distribution, the mea-sured dimuon candidates must be corrected for detector resolution and efficiency, both of which are derived di-rectly from data. The detector resolution is extracted from the shape and position of the Z/γ∗resonance peak in dimuon data, which is dominated by detector resolu-tion rather than the natural width of the Z boson. The resolution is well described by a double-Gaussian func-tion form in 1/pT, with the majority (98%) of muons having a 1/pTresolution of approximately 0.0018 GeV−1, and the remaining 2% (chosen at random) a 1/pT reso-lution of approximately 0.012 GeV−1.
The detector efficiencies are derived using the “tag and probe” method on dimuon candidate pairs. The “tag” muon is selected, and must pass all selection require-ments, which may be adjusted as needed to remove back-grounds. The “probe” muon is then selected with one ex-plicit reconstruction requirement removed; the fraction of probe muons which also meet this requirement gives an measurement of the efficiency. In this way, the efficiency of reconstruction, trigger and isolation requirements are measured individually, and parameterized in terms of the geometry of the detector. The method is repeated on simulated events, where results typically agree with data to within 3%, and factors are applied to the simulated events to correct for any such discrepancies. However, the muon trigger is not simulated; instead the trigger ef-ficiency measured in data, with an average efef-ficiency of approximately 88%, is applied on an event-by-event basis to the simulated events.
The binning used for the data is selected based on a combination of detector resolution and data statistics considerations. Detector effects on the resulting pZ
T dis-tribution are assessed by comparing the pZ
T defined in terms of particles entering the detector to the pZ
T recon-structed by the detector. First, we define the dimuon sys-tem at the particle level in a way that can be implemented in any simulation. We consider all particles with lifetimes > 10 ps to have reached the detector. From this list of particles, all muons with pT > 15 GeV and |η| < 1.7 are selected (regardless of their source in the generator event record), matching the detector acceptance. By construc-tion, the muons are considered after QED FSR, as would be measured in the tracking detector. Then, all possible opposite charge muon pairs are formed, and any which lie within the required mass range of 65–115 GeV are kept. In the rare cases (< 0.5%) of events with more than one selected pair, the pair with mass closest to the Z bo-son mass is used. The requirement of non-colinearity of muon tracks applied at detector level is found to reject less than 0.2% of particle level candidates, so is not ap-plied at the particle level. Similarly, the muon isolation and vertex requirements are treated as a detector level selection which is corrected for, and are not implemented at the particle level.
We next correct the measured pZ
parti-cle level, using the alpgen+pythia Z/γ∗→ µ+µ−+X sample. There are three possible scenarios for any given event, resulting in a three step process. In the first sce-nario, a dimuon pair may pass all detector level selec-tions, but fail one or more particle level selections. This class of events is dominated by migrations into the se-lected mass or muon |η| regions due to detector resolu-tion. In the simulated events, this class makes up approx-imately 2% of the final sample with negligible dependence on pZ
T, and this predicted contribution is subtracted from the measured data. In the second scenario, the dimuon pair passes both the particle and detector level selections. For these simulated events, the particle level pZ
T is plot-ted against the detector level pZ
T to assess the impact of detector resolution (see Fig.1). The data distribution af-ter the subtraction described in the first step is then cor-rected using a regularized inversion of this resolution ma-trix [32]. The regularization imposes the condition that second derivatives be small, which produces a smooth distribution; this smoothing is accounted for when deriv-ing the uncertainties. In the third scenario, the particle level dimuon pair may pass selections, but the detector level pair fail selections. This effect is also assessed using simulated events and is dominated by inefficiency in the trigger or reconstruction and by gaps in detector cover-age within the muon acceptance. The data distribution resulting from the second step is corrected for these in-efficiencies, parametrized as a function of (particle level) pZ
T, giving the Z/γ∗+X differential cross section.
(GeV) Z T Measured p 1 10 102 (GeV) Z T Particle level p 1 10 2 10 ∅ D simulation − µ + µ → * γ Z/
FIG. 1: The resolution matrix for pZ
T from simulated events,
used in correcting the measured data to particle level. The box area represents the number of events in a given particle
level pZ
T bin that are in a given bin of measured (detector
level) pZ
T.
Ensemble testing is used to determine the uncertainty
on the differential cross section and any biases in the correction process. The pythia Z/γ∗→ µ+µ−+X sam-ple is used to build pseudo-datasets, after first being adjusted to describe the data by applying the ratio of the fully corrected data pZ
T to the particle level pZT in this pythia sample. Three hundred pseudo-datasets are drawn, with events chosen at random for each dataset with a probability set so the average dataset size matches the measured dataset. Each pseudo-dataset is then treated exactly as data, and the detector level distribution corrected using the three step process described above. The resulting corrected distribution is compared to the true particle level pZ
T in that pseudo-dataset, and the fractional difference (ri) is calculated for each pZ
T bin. This process is repeated for all 300 pseudo-datasets. In a given pZ
T bin, the 300 ri form a Gaussian distribution and any shift of the mean of this distribution away from zero indicates a bias in the cor-rection process. The data are corrected for such biases, which are all at or below the 1% level, and the uncer-tainty on the Gaussian mean is assigned as a system-atic uncertainty. The RMS of the ri distribution re-sults from comparing the corrected distribution for each pseudo-dataset, which is smoothed by the regularization in the matrix inversion step, to the true particle level for that pseudo-dataset, which contains statistical fluctua-tions. This RMS is therefore assigned to the data points as the statistical uncertainty. It is comparable to, but al-ways larger than, 1/√Ndata, where Ndata is the number of detector level data events in a given bin.
Finally, further systematic uncertainties are assessed. Several sources are considered, including the muon mo-mentum resolution and the absolute momo-mentum scale, and various detector efficiencies for muons. Each source is shifted individually up and down by one standard de-viation in the alpgen+pythia sample used to derive the correction factors, and left unchanged in the pseudo-datasets. The full ensemble testing process is repeated. Statistical uncertainties are unaffected by these tests, but any change in the correction bias is assigned as a system-atic uncertainty. All systemsystem-atic uncertainties are com-bined in quadrature, with the muon 1/pT resolution be-ing the largest source at low pZ
T. At high pZT, detector efficiency effects are the largest systematic source, but the statistical uncertainties dominate.
Finally the differential cross section is normalized to the total dimuon production cross section (with the same muon |η|, pT and dimuon mass requirements) measured in the data, determined by integrating over all pZ
T. The dominant systematic uncertainties on the total cross sec-tion arise from the absolute determinasec-tions of the lumi-nosity and muon trigger efficiency. Neither of these has a dependence on pZ
T, and therefore they do not contribute to the uncertainty on the normalized distribution.
Table I lists the normalized differential cross section, (1/σ) × (dσ/dpZ
sys-tematic uncertainties. We note that, due to the smooth-ing introduced by the regularization condition imposed during the second step of the data corrections, statistical fluctuations in the measured cross section in each pZ
T bin have been suppressed; however the statistical uncertain-ties still accurately reflect the possible spread in each bin which could be caused by such fluctuations. As a result, care must be taken when using the data in any fits as this suppression of fluctuations may lead to an artificially low χ2 for any fit which describes the central values of the data well. Table I also lists four multiplicative correction factors for each bin, which can be applied to compare this result to previous measurements: the factor labeled pµT corrects for the effect of the muon pT> 15 GeV require-ment; the factor labeled FSR corrects for QED FSR; the factor labeled A then corrects from the measured lepton acceptance to full 4π acceptance; and finally the factor labeled M corrects from the measured mass window to the larger mass window used in the D0 electron channel measurement [13] (40–200 GeV). Applying only the pµT factor results in the same dimuon definition as previous Z/γ∗+jets measurements [15, 20]; unlike pZ
T, the vari-ables studied in these previous measurements had mini-mal dependence on the muon pT requirement, so a cor-rection was applied by default. All factors are derived using resbos interfaced to photos [33], as described in the following text, and we provide only the central val-ues without assessing possible systematic uncertainties. However, deriving the same factors from the different the-oretical calculations described in the following text indi-cates that model dependence limits the accuracy of these factors, particularly A for pZ
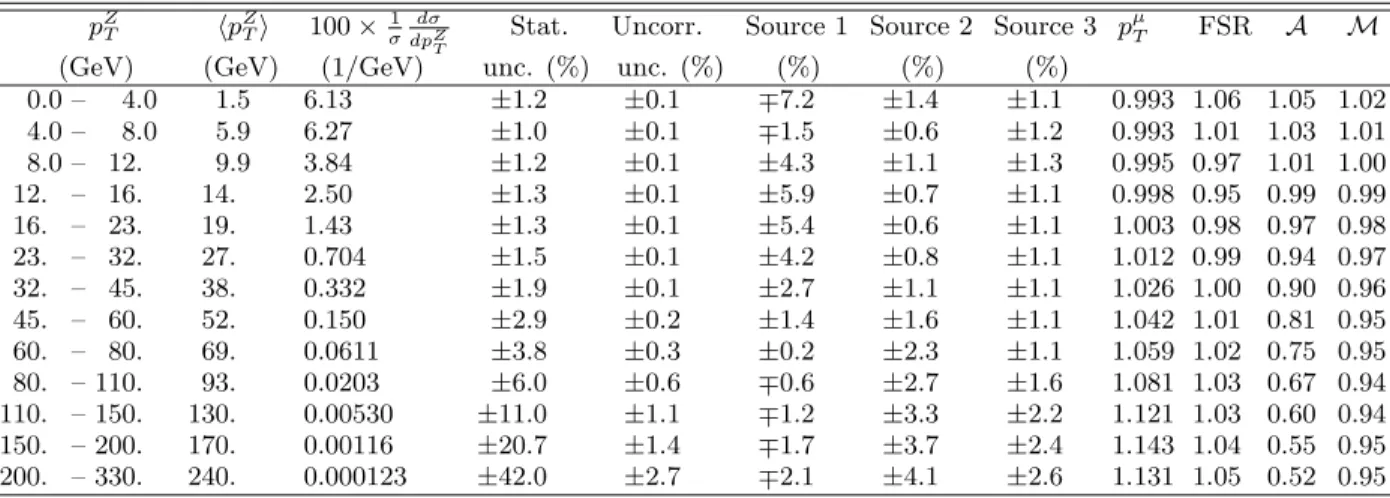
T > 20 GeV, to the level of a few percent. Applying all factors to the data allows a comparison to the D0 electron channel measurement, as shown in Fig. 2. Within the limitations of this compari-son, the agreement is reasonable. For direct comparisons with theory, these correction factors are not applied to the dimuon data.
To compare to the data, predictions for the pZ T dis-tribution are obtained from several theoretical calcula-tions. Predictions from pQCD are obtained with mcfm, by evaluating both the differential distribution and to-tal cross section at either leading order (LO) or next-to-leading order (NLO):
f (pT) ≡ 1 σZ/γ∗ (N)LO × dσdpZ/γ∗ T (N)LO
where the first term is of order O(α0
s) at LO and O(α1s) at NLO, while the second term is O(α1
s) at LO and O(α2
s) at NLO. This approach differs from the treat-ment of the pQCD calculation in the D0 electron chan-nel measurement. There, both the total cross section and differential distribution were calculated to the same power of the strong coupling constant, O(α2
S), yield-ing a NNLO total Z/γ∗ cross section (and was labeled
(GeV) Z T p 1 10 102 (1/GeV) T /dpZ σ d × Z σ 1/ -7 10 -6 10 -5 10 -4 10 -3 10 -2 10 -1 10 -e + e → * γ Z/ + corrections -µ + µ → * γ Z/ -1 , L=1 fb ∅ D
FIG. 2: Measurements of the normalized differential cross
section in bins of pZ
T for the dielectron [13] and dimuon
chan-nels. Both results are shown with combined statistical and systematic uncertainties.
“NNLO”), but a NLO differential distribution. The pre-scription used here, calculating both the total and differ-ential cross section to the same number of contributing terms in the perturbative expansion, results in a reduced scale dependence and improved convergence of the per-turbative series [37]. The total cross section is evalu-ated using the inclusive p¯p → Z/γ∗+ X process at LO and NLO, and the differential distribution evaluated us-ing the p¯p → Z/γ∗+ jet+X process again at LO and NLO, with no limit on the jet rapidity but requiring jet pT > 2.5 GeV to remove the divergence as pT → 0. The same requirements are placed on the muons as for the data analysis, and the differential Z/γ∗ p
T distribution close to the jet pT cutoff is excluded. The MSTW2008 LO and NLO PDFs [38] are used throughout in calcu-lating the LO and NLO processes respectively. In all cases, renormalization and factorization scales are set to the sum in quadrature of the mass and pT of the Z/γ∗in each event, and the dependence on this choice is assessed by varying both scales simultaneously up and down by a factor of 2, both for the differential distribution and the inclusive Z/γ∗cross section used in normalization. PDF uncertainties are assessed using the MSTW2008 68% er-ror sets, again taking into account the effect on the dif-ferential distribution and the inclusive Z/γ∗cross section used in normalization. These are found to be approxi-mately a factor of two smaller than the scale uncertainties at NLO, and negligible compared to the scale uncertain-ties at LO. The prediction from mcfm must then be cor-rected for the effects of QED FSR from the muons. These corrections are derived from the resbos+photos sample
described below, by comparing the distribution obtained by constructing the dimuon state using the muons before and after QED FSR, and are the inverse of the per-bin FSR corrections listed in Table I. We note that apply-ing the pQCD prescription from the D0 electron channel measurement here would change the LO prediction to LO/NLO, and the NLO prediction to NLO/NNLO. Dif-fering only in the total cross section used to normalize, this change would lower the current predictions by 28% and 4% respectively across all Z/γ∗p
T, and increase the scale uncertainties by ∼ 10% (a ≤ 1% absolute increase in the uncertainty).
A prediction for (1/σ) × (dσ/dpZ
T) is also obtained from resbos, using the CTEQ6.6 parton distribution functions (PDF) [34]. At low pZ
T, resbos performs a next-to-next-to-leading logarithm (NNLL) resummation calculation, using the BLNY parametrization [35], with the default settings taken here. At higher pZ
T (pZT ≥ 20 GeV), resbos transitions to an O(αs) pQCD calcula-tion. Across the entire pZ
T range, k-factors are applied in bins of Z/γ∗ p
T and rapidity to normalize to an O(α2s) pQCD calculation [36]. The renormalization and factor-ization scales for the pQCD calculation are set to the mass of the Z/γ∗in each event. resbos is interfaced to photosfor the simulation of QED FSR.
Predictions for (1/σ)×(dσ/dpZ
T) are also obtained from four event generators. Previous measurements [15, 19, 20] indicate that the best description of boson+jets fi-nal states is currently provided by LO 2 → N matrix element calculations with matched parton showers, as implemented in sherpa and alpgen, so we focus on these. We use the same PDF set for all event genera-tors: CTEQ6L1 [39]. First, a sample of events is gener-ated with sherpa, which uses the comix matrix element generator [40] interfaced to a Catani-Seymour subtrac-tion based parton shower [41]. Here, up to three partons are included in the matrix element calculation, and the threshold for matching to the parton shower is set to the default value of 30 GeV. In sherpa, the scales are deter-mined dynamically during the matching process [42]. A sample of events is then generated with alpgen, again with up to three partons in the matrix element calcula-tion. The factorization scale is set to the sum in quadra-ture of the mass and pT of the Z/γ∗ in each event, and the renormalization scale set according to the CKKW prescription [43]. Parton jets from the matrix element calculation are required to have pT> 13 GeV, ∆R(jet, jet) > 0.4, and are limited to |η| < 2.5. These events are hadronized in three ways: first, using herwig (using an angular ordered parton shower) with jimmy [44] for multiple parton interactions, then using pythia with un-derlying event tune D6 [45] (using the virtuality-ordered shower), and finally using pythia with tune Perugia 6 [46] (using the pT-ordered shower [47]). This results in three different alpgen predictions. In each case the de-fault matching procedure is applied after hadronization,
requiring a ∆R(jet, jet) < 0.4 match between parton jets and particle jets with pT > 18 GeV. To determine the impact of the matching to the alpgen matrix elements calculation, herwig and pythia are also tested directly in the same configurations described above: herwig with jimmy for multiple parton interactions, pythia with tune D6, and pythia with the Perugia 6 tune. In these configurations, all final state partons are generated by the parton shower. The renormalization and factoriza-tion scales for the hard scatter are set to the mass of the Z/γ∗in each event, and are determined dynamically for the initial and final state showers. For the resbos, sherpa, alpgen, pythia and herwig calculations, the particle level quantities are extracted as defined earlier and each differential cross section prediction is normal-ized to the prediction of the dimuon cross section (with the same muon pT, |η| and dimuon mass requirements) from that same model.
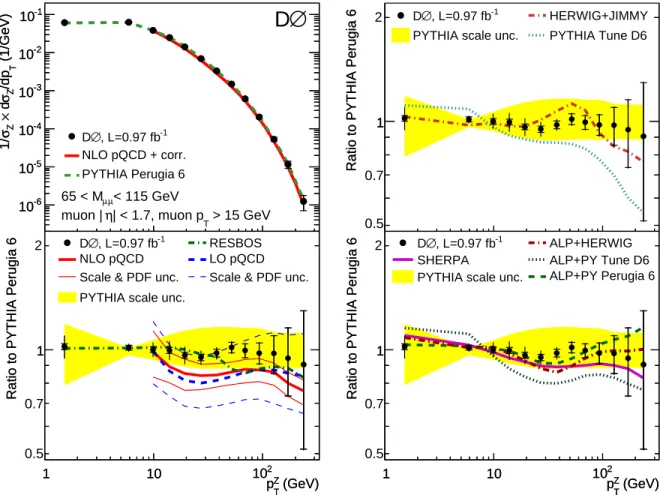
The normalized differential cross section is presented in Fig. 3. The data points are placed at the bin av-erage, defined as the point where the differential cross section within the bin, taken from pythia reweighted to match the shape in data, is equal to the measured value in the bin [48]. For clarity, only the predictions of NLO pQCD and pythia Perugia 6 are shown with the data in Fig. 3(a). In the other parts of Fig. 3, ratios are shown. To avoid repeating the data uncertainties and statistical fluctuations several times, we do not use data as the de-nominator in these ratios. Instead, we choose pythia Perugia 6, as this provides the best overall description of the data, simplifying the determination of trends in other theoretical predictions relative to the data. As an exam-ple of the scale uncertainty in an event generator, two further pythia Perugia 6 samples are generated, with the scale for initial state QCD radiation varied up and down by a factor of 2. The effect of this change is shown as a shaded band around unity, and shifts the distribu-tion in opposite direcdistribu-tions at low and high pZ
T, with the transition point at approximately 6 GeV. Further, even though pythia is based on LO matrix elements, the scale uncertainty obtained is comparable to that on the NLO pQCD calculation, suggesting a cancellation of some of this scale variation in pythia through a detailed balance between the matrix element for Z/γ∗production and the Sudakov form factors from the parton shower. However, this small uncertainty is somewhat deceptive, as pythia does not include a full NLO calculation.
Comparisons to the data indicate two regions: pZ T < 30 GeV, where the resummation calculation provides a good description of the data, and pZ
T > 30 GeV, where the fixed order calculation provides the best description. In this higher pZ
T region, the NLO pQCD calculation is a significant improvement in uncertainty over LO, however an overall normalization difference relative to the data is observed. For 30 < pZ
T < 100 GeV, this difference is be-tween 1–2 standard deviations of the combined data and
(1/GeV) T /dpZ σ d × Z σ 1/ -6 10 -5 10 -4 10 -3 10 -2 10 -1 10 -1 , L=0.97 fb ∅ D NLO pQCD + corr. PYTHIA Perugia 6 < 115 GeV µ µ 65 < M > 15 GeV T | < 1.7, muon p η muon |
∅
D
(1/GeV) T /dpZ σ d × Z σ 1/ -6 10 -5 10 -4 10 -3 10 -2 10 -1 10Ratio to PYTHIA Perugia 6
1
-1 , L=0.97 fb
∅
D
PYTHIA scale unc.
HERWIG+JIMMY PYTHIA Tune D6 2
0.7
0.5
Ratio to PYTHIA Perugia 6
1 (GeV) Z T p 1 10 102
Ratio to PYTHIA Perugia 6
1 -1 , L=0.97 fb ∅ D NLO pQCD Scale & PDF unc.
RESBOS LO pQCD Scale & PDF unc. PYTHIA scale unc.
2 0.7 0.5 (GeV) Z T p 1 10 102
Ratio to PYTHIA Perugia 6
1 (GeV) Z T p 1 10 102
Ratio to PYTHIA Perugia 6
1 -1 , L=0.97 fb ∅ D SHERPA
PYTHIA scale unc.
ALP+HERWIG ALP+PY Tune D6 ALP+PY Perugia 6 2 0.7 0.5 (GeV) Z T p 1 10 102
Ratio to PYTHIA Perugia 6
1
FIG. 3: The normalized differential cross section in bins of pZ
T for Z/γ∗(→ µµ) + X events. The data are shown with statistical
uncertainties (horizontal bar) and combined statistical and systematic uncertainties (full bar). The distribution is shown in (a) and compared to fixed order and resummation calculations in (b), parton shower generators in (c), and the matrix element + parton shower generators in (d). All ratios in (b), (c), and (d) are shown relative to pythia Perugia 6.
theory uncertainties, with the theory scale uncertainty dominating and the choice of a lower scale bringing the pQCD calculation into better agreement with the data. For pZ
T > 100 GeV, the data statistical uncertainty dom-inates, and the theory remains below the data but is con-sistent within this uncertainty. This disagreement with pQCD predictions is in the same direction as observed in the D0 electron channel measurement, but significantly smaller. However, the detector acceptance for the elec-tron channel was larger than for the muon channel, and attempting to extrapolate between these acceptances re-vealed a dependence on the theoretical models used, com-plicating direct comparisons of the two results. These two measurements in fact provide different information on the pZ
T distribution in different Z/γ∗ rapidity ranges, and future measurements which further probe the cor-relations between the Z/γ∗ p
T and rapidity are clearly of interest and may further illuminate the disagreements seen when comparing pQCD to data.
Of the event generators, pythia Perugia 6 provides the best description of the data over the full pZ
T range,
and we note that the D0 electron channel measure-ment was used as an input in deriving this tune. All other event generators agree within the combined the-ory and data uncertainties, except the pythia D6 and alpgen+pythia D6 predictions. Interfacing pythia and herwig with alpgen clearly affects the region domi-nated by the alpgen matrix elements, though the agree-ment with data is equally good. While the sherpa pre-diction agrees with the data within uncertainties, it gen-erally follows the shape of the pythia Perugia 6 predic-tion with a higher scale choice suggesting that, as for the pQCD calculation, a lower scale choice in sherpa may yield an even better description of the data.
In summary, we have presented a new measurement of the normalized Z/γ∗(→ µµ)+X cross section, differential in the dimuon pT. This is the first such measurement at the level of particles entering the detector, allowing un-biased tests of theoretical predictions. The measurement was made using a sample corresponding to 0.97 fb−1 of integrated luminosity recorded by the D0 experiment in p¯p collisions at √s = 1.96 TeV. The current best
pre-dictions for vector boson production at hadron colliders were tested, and these predictions have varied success in describing the data. In particular, the disagreement with pQCD seen in the electron channel measurement at high Z/γ∗ p
T is smaller within the kinematic acceptance of this measurement, and the use of a lower scale within the calculation further reduces the disagreement. An ac-curate description of both the low and high pZ
T regions is also essential in predicting the production rates and kinematics of jets in association with the Z/γ∗, and this result is an important input for the tuning of theoretical predictions. Improving the modeling of this process will lead to increased sensitivity of searches for rare and new physics.
We thank Zhao Li, Mike Seymour, Frank Siegert, Pe-ter Skands and Chien-Peng Yuan for very useful dis-cussions on the theoretical calculations. We thank the staffs at Fermilab and collaborating institutions, and ac-knowledge support from the DOE and NSF (USA); CEA and CNRS/IN2P3 (France); FASI, Rosatom and RFBR (Russia); CNPq, FAPERJ, FAPESP and FUNDUNESP (Brazil); DAE and DST (India); Colciencias (Colombia); CONACyT (Mexico); KRF and KOSEF (Korea); CON-ICET and UBACyT (Argentina); FOM (The Nether-lands); STFC and the Royal Society (United Kingdom); MSMT and GACR (Czech Republic); CRC Program and NSERC (Canada); BMBF and DFG (Germany); SFI (Ireland); The Swedish Research Council (Sweden); and CAS and CNSF (China).
[1] J. Campbell and R. K. Ellis, Phys. Rev. D 65, 113007 (2002). mcfm v5.6 is used.
[2] K. Melnikov and F. Petriello, Phys. Rev. D 74 114017 (2006).
[3] S. Catani et al., Phys. Rev. Lett. 103 082001 (2009). [4] G. A. Ladinsky and C. P. Yuan, Phys. Rev. D 50 4239,
1994.
[5] C. Balazs and C. P. Yuan, Phys. Rev. D 56, 5558 (1997).
resbos-cpis used.
[6] T. Sj¨ostrand, S. Mrenna, and P. Skands, JHEP 05, 026
(2006). pythia v6.421 is used unless stated otherwise. [7] G. Corcella et al., JHEP 0101, 010 (2001). herwig
v6.510 is used.
[8] M. L. Mangano et al., JHEP 0307, 001 (2003). alpgen v2.13 is used unless stated otherwise.
[9] T. Gleisberg et al., JHEP 0902, 007, (2009). sherpa v1.2.1 is used.
[10] S. Hoeche et al., arXiv:hep-ph/0602031 (2006).
[11] CDF Collaboration. T. Affolder et al., Phys. Rev. Lett.
84, 845 (2000).
[12] D0 Collaboration, B. Abbott et al., Phys. Rev. Lett. 84 2792 (2000).
[13] D0 Collaboration, V. M. Abazov et al., Phys. Rev. Lett.
100, 102002 (2008).
[14] D0 Collaboration, V. M. Abazov et al., Phys. Rev. D 76,
012003 (2007).
[15] D0 Collaboration, V. M. Abazov et al., Phys. Lett. B
669, 278 (2008).
[16] D0 Collaboration, V. M. Abazov et al., Phys. Lett. B
658, 112 (2008).
[17] CDF Collaboration, T. Aaltonen et al., Phys. Rev. Lett.
100, 102001 (2008).
[18] CDF Collaboration, T. Aaltonen et al., Phys. Rev. D 77, 011108(R) (2008)
[19] D0 Collaboration, V. M. Abazov et al., Phys. Lett. B
678, 45 (2009).
[20] D0 Collaboration, V. M. Abazov et al., Phys. Lett. B
682, 370 (2010).
[21] D0 Collaboration, V. M. Abazov et al., Phys. Rev. Lett.
94, 161801 (2005).
[22] CDF Collaboration, T. Aaltonen et al., Phys. Rev. D 74, 032008 (2006).
[23] D0 Collaboration, V. M. Abazov et al., Phys. Lett. B
666, 23 (2008).
[24] CDF Collaboration, T. Aaltonen et al., Phys. Rev. Lett.
100, 091803 (2008).
[25] J. M. Butterworth et al., arXiv:1003.1643 [hep-ph] (2010). A detailed discussion is given in Sect. 14. [26] T. Andeen et al., FERMILAB-TM-2365 (2007).
[27] D0 Collaboration, V. M. Abazov et al., Nucl. Instrum. Methods Phys. Res. A 565, 463 (2006).
[28] η = − ln[tan(θ/2)], where θ is the polar angle, defined with respect to the proton beam direction.
[29] R. Hamberg, W. L. van Neerven and W. B. Kilgore, Nucl. Phys. B 359, 343 (1991). Erratum ibid. 644, 403 (2002). [30] M. Cacciari et al., JHEP 0404, 068 (2004).
[31] R. Brun and F. Carminati, CERN Program Library Long Writeup W5013, 1993 (unpublished).
[32] A. H¨ocker and V. Kartvelishvili, Nucl. Instrum. Meth. A
372469, 1996.
[33] E. Barberio and Z. Was, Comput. Phys. Commun. 79, 291 (1994). photos v2.0 is used.
[34] P. M. Nadolsky et al., Phys. Rev. D 78, 013004 (2008). [35] F. Landry et al., Phys. Rev. D 67, 073016 (2003). [36] P. B. Arnold and M. H. Reno, Nucl. Phys. B 319, 37
(1989). Erratum ibid. 330, 284 (1990).
[37] M. H. Seymour, Nucl. Phys. B 513 (1998). A detailed discussion is given in Sect. 3.1. And M. H. Seymour, pri-vate communications.
[38] A. D. Martin, W. J. Stirling, R. S. Thorne, and G. Watt, Eur. Phys. J. C 63 189, (2009).
[39] J. Pumplin et al., JHEP 0207, 012 (2002).
[40] T. Gleisberg and S. Hoche, JHEP 0812, 039 (2008). [41] S. Schumann and F. Krauss, JHEP 0803, 038 (2008).
[42] S. H¨oche et al., JHEP 0905, 053 (2009).
[43] S. Catani et al., JHEP 0111, 063 (2001); F. Krauss, JHEP 0208, 015 (2002); F. Krauss et al., Phys. Rev. D 70, 114009 (2004).
[44] J. M. Butterworth, J. R. Forshaw, and M. H. Seymour, Z. Phys. C 72, 637 (1996). jimmy v4.31 is used.
[45] M. G. Albrow et al., arXiv:hep-ph/0610012 (2006). [46] P. Skands, arXiv:0905.3418 [hep-ph] (2009).
[47] T. Sj¨ostrand and P. Skands, Eur. Phys. J. C 39, 129
(2005).
[48] G. D. Lafferty and T. R. Wyatt, Nucl. Instrum. Methods Phys. Res. A 355, 541 (1995).
TABLE I: The measured normalized cross section in bins of dimuon pT (pZT) for Z/γ∗→ µ +
µ−+X events. For each bin,
we present the bin boundaries, the bin average (hpZ
Ti, defined in the text), the normalized differential cross section, and the
uncertainties. Uncertainties are split into statistical, systematic with no correlations between bins (“uncorr. unc.”), and sources
of systematic uncertainty that are correlated across all bins. The sources of correlated uncertainty are: 1) muon 1/pTresolution,
2) muon detection efficiency, 3) efficiency of all other selections. Factors to correct the result for the muon pT requirement
(pµ
T), QED FSR, muon acceptance (A), and to the larger mass window of 40-200 GeV used in the D0 electron channel analysis
(M) are also provided (defined in the text).
pZ T hpZTi 100 × 1 σ dσ dpZ T
Stat. Uncorr. Source 1 Source 2 Source 3 pµT FSR A M
(GeV) (GeV) (1/GeV) unc. (%) unc. (%) (%) (%) (%)
0.0 – 4.0 1.5 6.13 ±1.2 ±0.1 ∓7.2 ±1.4 ±1.1 0.993 1.06 1.05 1.02 4.0 – 8.0 5.9 6.27 ±1.0 ±0.1 ∓1.5 ±0.6 ±1.2 0.993 1.01 1.03 1.01 8.0 – 12. 9.9 3.84 ±1.2 ±0.1 ±4.3 ±1.1 ±1.3 0.995 0.97 1.01 1.00 12. – 16. 14. 2.50 ±1.3 ±0.1 ±5.9 ±0.7 ±1.1 0.998 0.95 0.99 0.99 16. – 23. 19. 1.43 ±1.3 ±0.1 ±5.4 ±0.6 ±1.1 1.003 0.98 0.97 0.98 23. – 32. 27. 0.704 ±1.5 ±0.1 ±4.2 ±0.8 ±1.1 1.012 0.99 0.94 0.97 32. – 45. 38. 0.332 ±1.9 ±0.1 ±2.7 ±1.1 ±1.1 1.026 1.00 0.90 0.96 45. – 60. 52. 0.150 ±2.9 ±0.2 ±1.4 ±1.6 ±1.1 1.042 1.01 0.81 0.95 60. – 80. 69. 0.0611 ±3.8 ±0.3 ±0.2 ±2.3 ±1.1 1.059 1.02 0.75 0.95 80. – 110. 93. 0.0203 ±6.0 ±0.6 ∓0.6 ±2.7 ±1.6 1.081 1.03 0.67 0.94 110. – 150. 130. 0.00530 ±11.0 ±1.1 ∓1.2 ±3.3 ±2.2 1.121 1.03 0.60 0.94 150. – 200. 170. 0.00116 ±20.7 ±1.4 ∓1.7 ±3.7 ±2.4 1.143 1.04 0.55 0.95 200. – 330. 240. 0.000123 ±42.0 ±2.7 ∓2.1 ±4.1 ±2.6 1.131 1.05 0.52 0.95

![FIG. 2: Measurements of the normalized differential cross section in bins of p Z T for the dielectron [13] and dimuon chan-nels](https://thumb-eu.123doks.com/thumbv2/123doknet/14030954.458148/7.918.490.822.77.404/fig-measurements-normalized-differential-cross-section-dielectron-dimuon.webp)