HAL Id: hal-01077143
https://hal.archives-ouvertes.fr/hal-01077143
Preprint submitted on 24 Oct 2014
HAL is a multi-disciplinary open access
archive for the deposit and dissemination of
sci-entific research documents, whether they are
pub-lished or not. The documents may come from
teaching and research institutions in France or
abroad, or from public or private research centers.
L’archive ouverte pluridisciplinaire HAL, est
destinée au dépôt et à la diffusion de documents
scientifiques de niveau recherche, publiés ou non,
émanant des établissements d’enseignement et de
recherche français ou étrangers, des laboratoires
publics ou privés.
fraction using a combination of independent automated
segmentation results in cardiovascular magnetic
resonance imaging
Jessica Lebenberg, Alain Lalande, Patrick Clarysse, Irène Buvat, Christopher
Casta, Alexandre Cochet, Constantin Constantinides, Jean Cousty, Alain de
Cesare, Stéphanie Jehan-Besson, et al.
To cite this version:
Jessica Lebenberg, Alain Lalande, Patrick Clarysse, Irène Buvat, Christopher Casta, et al.. Improved
estimation of the left ventricular ejection fraction using a combination of independent automated
segmentation results in cardiovascular magnetic resonance imaging. 2014. �hal-01077143�
Improved estimation of the left ventricular ejection
fraction using a combination of independent
automated segmentation results in cardiovascular
magnetic resonance imaging.
Jessica Lebenberg
∗, Alain Lalande, Patrick Clarysse, Member, IEEE, Ir`ene Buvat, Member, IEEE,
Christopher Casta, Alexandre Cochet, Constantin Constantinid`es, Jean Cousty, Alain de Cesare,
St´ephanie Jehan-Besson, Muriel Lefort, Laurent Najman, Elodie Roullot, Laurent Sarry, Christophe Tilmant,
Fr´ed´erique Frouin, Member, IEEE and Mireille Garreau
Abstract—This work aimed at combining different segmenta-tion approaches to produce a robust and accurate segmentasegmenta-tion result. Three to five segmentation results of the left ventricle were combined using the STAPLE algorithm and the reliability of the resulting segmentation was evaluated in comparison with the result of each individual segmentation method. This comparison was performed using a supervised approach based on a reference method. Then, we used an unsupervised statistical evaluation, the extended Regression Without Truth (eRWT) that ranks different methods according to their accuracy in estimating a specific biomarker in a population. The segmentation accuracy was evaluated by focusing on the left ventricular ejection fraction (LVEF) estimate resulting from the LV contour delineation using a public cardiac cine MRI database. Eight different segmentation methods, including three expert delineations, were studied, and sixteen combinations of the five automated methods were investigated. The supervised and unsupervised evaluations demonstrated that in most cases, STAPLE results provided better estimates of the LVEF than individual automated segmentation methods. In addition, LVEF obtained with STAPLE were within inter-expert variability. Overall, combining different automated segmentation methods improved the reliability of the segmenta-tion result compared to that obtained using an individual method
Copyright 2010 IEEE. Personal use of this material is permitted.c However, permission to use this material for any other purposes must be obtained from the IEEE by sending a request topubs-permissions@ieee.org
∗Corresponding author:jessica.lebenberg@gmail.com
J. Lebenberg and C. Constantinid`es were with LIF, INSERM UMR S 678, Universit´e Pierre et Marie Curie, 75013 Paris, France, and with the PRIAM, ESME-Sudria, 94200 Ivry-sur-Seine, France.
A. Lalande and A. Cochet are with Le2I, CNRS UMR 6306, Universit´e de Bourgogne, 21000 Dijon, France.
A. de Cesare, M. Lefort and F. Frouin are with Sorbonne Universit´e UPMC Paris 06, CNRS, INSERM, LIB, Paris, France.
E. Roullot is with PRIAM, ESME-Sudria, 94200 Ivry-sur-Seine, and LISSI, Universit´e Paris-Est, France.
I. Buvat is with CEA-SHFJ, 91405 Orsay, France.
P. Clarysse and C. Casta are with Universit´e de Lyon, Creatis, CNRS UMR5220, Inserm U1044, INSA-Lyon, Universit´e de Lyon 1, 69621 Villeur-banne, France.
J. Cousty and L. Najman are with LIGM-A3SI, UMR 8049, Universit´e Paris-Est, ESIEE, 77454 Marne la Vall´ee, France.
S. Jehan-Besson is with GREYC, CNRS UMR 6072, 14032 Caen, France. L. Sarry is with ISIT, CNRS UMR 6284, Universit´e d’Auvergne, 63000 Clermont-Ferrand, France.
C. Tilmant is with Institut Pascal, CNRS UMR 6602, Universit´e Blaise Pascal, 63000 Clermont-Ferrand, France.
M. Garreau is with LTSI, INSERM UMR 1099, Universit´e Rennes 1, 35042 Rennes, France.
and could achieve the precision of an expert.
Index Terms—Multiple segmentations, Regression Without Truth, STAPLE, Cardiac image analysis
I. INTRODUCTION
C
Ardiac Magnetic Resonance Imaging (cMRI) is used more and more frequently in clinical routine to study simultaneously the cardiac anatomy and function. A series of clinical parameters can be deduced from the acquired scans in cMRI. Among these parameters, the left ventricular ejection fraction (LVEF) remains a major prognostic index for coronary artery diseases assessment. The correct estimation of this parameter requires the accurate measurement of both end-diastolic and end-systolic volumes. Although MRI makes these measurements possible with a high precision (generally from a series of short-axis cine-MR images), the segmentation of the left ventricle (LV) is still a contemporary issue [1]due to the colossal amount of data that are acquired in a single exam-ination. For clinical routine, semi-automated algorithms that are proposed by commercial image post-processing software are largely used. For retrospective studies, research studies, or large database studies, automated segmentation algorithms are preferentially used in order to avoid the labor intensive and time consuming manual segmentation task and reduce the intra- and inter-operator variabilities [2]. To assess the performance of these automated segmentation algorithms, the common approach consists in comparing the contours resulting from the automated segmentation with the ones obtained by one or several experts who are known to often outperform automated methods[3].When visually comparing segmentation results obtained by different automated methods as in [3], the respective performance of two methods depends on the data: when a first segmentation method provides more accurate contours than a second automated method on a specific database, the second algorithm might actually be more relevant for a sub-database or, at least, for some particular MR examinations. Therefore, it is reasonable to hypothesize that there might be
an advantage in combining several automated segmentation methods to overcome the specific limitations of each one.
To combine segmentation approaches, different algorithms have been proposed [4], [5], [6], [7], [8]. The Simultaneous Truth and Performance Level Estimation (STAPLE) algorithm [5] is very popular and highly cited. Furthermore, the as-sociated software is freely available for academic purposes upon written request. For these reasons, we evaluated the performance of STAPLE. To objectively assess the segmen-tation accuracy, criteria based on estimated contours and associated image classification are often used. These include various metrics allowing to compare boundaries at a local level such as distances between contours, overlap criteria like the Dice coefficient [9], or the sensitivity, the specificity, the predictive negative value and the predictive positive value criteria computed by the STAPLE algorithm. All these criteria assume that there is a ”gold standard” segmentation, at least implicitly. Furthermore, these criteria are partly correlated and are also directly related to the optimization process involved in STAPLE. To avoid these limitations, we rather focused our evaluation on the clinical task and evaluated the accuracy of the estimated LVEF parameter. Indeed, this parameter value is the clinically relevant end result of the left cavity segmentation process.
To evaluate the interest of the STAPLE algorithm for combining segmentation results, we applied it to a cardiac cine MRI database including LV segmentation obtained from eight independent segmentation approaches: five resulted from five different automated image processing approaches, and three volume contours were drawn by three different experts. All possible combinations of the five automated methods (all five methods, four among the five methods, and three among the five methods) were tested against results provided by the three experts, using the LVEF values as the clinical parameter of interest. The evaluation was first carried out using a supervised approach, assuming a gold standard was available, and then using an unsupervised approach, the extended Regression Without Truth (eRWT) [3]to rank all segmentation methods as a function of their performance..
Our study presents some similarities with [2]: both used a public cardiac cMRI database (although not the same) for which contours were delineated by experts and algorithms. In our case, the selected database included controls and patients with different cardiac pathologies. In[2], only cMRI acquired on patients were included. Furthermore, both studies used STAPLE to combine different contours, but they differ in their approach. Indeed, [2] proposed to use STAPLE to define a gold standard segmentation based on two fully-automated algorithms and three semi-automated algorithms requiring manual input, while the present study focuses on improving the accuracy of segmentation algorithms by combining them with STAPLE to get a precision similar to the one achieved by experts i.e. make it acceptable for clinical routine. Since this study is based on previous work that requested manual delineations on a specific database, we run the tests on the public database previously used in our studies.
This paper is organized as follows. Section II presents the database that was used in our study, the segmentation methods
that were compared and combined, and the different combi-nations that were tested. Section III describes the statistical supervised evaluation and the unsupervised evaluation used to characterize the performance of the different combinations of segmentation methods. Section IV presents the results and the ranking of each segmentation method. These results are discussed in section V.
II. DATABASE AND SEGMENTATION METHODS
A. Database
This work uses the public database provided by Sunny-brook Health Sciences Center[10]. This cardiac database was first distributed to the participants in the Cardiac MR Left Ventricular Segmentation Grand Challenge (MICCAI 2009). It includes images from forty-five subjects who were divided into four subgroups: healthy individuals (CTRL, n=9), patients with hypertrophic cardiomyopathy (HYP, n=12), patients with heart failure without ischemia (HF-NI, n=12) and patients with heart failure due to ischemia (HF-I, n=12). For each examination, about ten short axis slices covering the LV were acquired using a breath-hold, retrospective ECG-gated cine-MRI sequence (twenty cardiac phases per slice, thickness = 8 mm, FOV = 320 mm, acquisition matrix256 × 256 with a 1.5T MR scanner (GE Healthcare)).
We focused here on the left ventricular ejection fraction (LVEF) estimate. LVEF was calculated conventionally as the ratio between the stroke volume and the end-systolic volume. The end-diastolic and end-systolic volumes were measured from the endocardial border that was delineated on each selected image. MR slices corresponding to the end-systolic and end-diastolic phases were indicated to the participants in the Challenge, so as to avoid any variability due to the choice of these temporal phases.
B. Segmentation approaches
Eight independent estimates of the LVEF were obtained from three manual contouring methods (M1-M 3) provided by three independent experts from two different laboratories and from five algorithms (M4-M 8). The five algorithms described respectively in [11], [12], [13], [14], [15]1 use dif-ferent segmentation strategies and various user’s interactions. Endocardial borders were obtained on the end-diastolic and end-systolic phases with all methods (methods M5 and M 6 provided contours for all cardiac phases). All methods but M5 included the papillary muscles in the LV cavity. Method M4 was the least automated one; method M8 was fully automated. Using each segmentation method, the mean LVEF value and its associated standard deviation were calculated for each of the four subgroups of subjects. More than 99% of these values ranged from0.05 to 0.85. The twenty-four patients of the studied database with heart failure (HF-NI and HF-I) had a reduced LVEF that was considered as pathological (≤0.45). 1Please note that the method M 8 described in[15] is an update of the
C. Combination of the segmentation approaches
1) Method: Several segmentation results were combined using the Simultaneous Truth and Performance Level Esti-mation (STAPLE) algorithm developped by Warfield et al. [5]. This method was implemented using the version 1.5.2 of CRKit, which is the software provided by Warfield’s team. The STAPLE framework is based on an Expectation Max-imization (EM) algorithm[17], [18]. It uses several segmen-tation results and calculates simultaneously a probabilistic estimate of a representative segmentation result and a perfor-mance level of each delineation included in the calculation. This performance level is provided by the computation of the sensitivity and the specificity indexes between each input segmentation and the segmentation result. The process is iterated until a stable solution is reached. Here, the STAPLE algorithm was run using the default parameters that were proposed by its authors. The binary version was used since only two classes were considered: the left ventricle and the remaining structures outside the left ventricle. Provided results did not depend on the size of the background (the region of interest surrounding the left cavity in our application) as mentioned in [2]. Furthermore, the STAPLE algorithm was applied in 2D, for each slice separately. The resulting contours were stacked to get a 3D segmentation result.
2) Application: The STAPLE algorithm was applied to several combinations of segmentation results obtained from the five automated methods previously described:
• a STAPLE segmentation M S45678 was created from the five automated methods.
• STAPLE was used to combine all five combinations of four automated methods. For instance, the result-ing segmentation was denoted M S4567 when methods M4, M 5, M 6 and M 7 were involved in the algorithm. • STAPLE was also applied to each combination of three
automated methods among the five available (10 combi-nations). The result was denoted M S456 when methods M4, M 5 and M 6 were involved in the algorithm. Using each STAPLE segmentation result, the mean LVEF value and associated standard deviation were calculated for each of the four subgroups of subjects.
III. STATISTICAL EVALUATIONS
A. Supervised evaluation
There is no perfect reference when three experts have delineated contours on real data for which the gold standard segmentation is unknown [4]. We could have used STAPLE to define a consensus as proposed for instance in[2]. In order to be independent of STAPLE for the evaluation, we rather used M2 as the reference method (M ref ) for the supervised evaluation step. Indeed, it was shown in [3]that method M2 performed the best and that the LVEF obtained by the three experts were more accurate than any of the five automated methods that were tested. The supervised evaluation was based on the LVEF estimation and on the computation of the bias β and its associated standard deviation (s) of each segmentation method M k with respect to the reference M2, (k representing
either one of the original methods or one of the sixteen STAPLE combinations described in II-C2).
B. Unsupervised evaluation using eRWT
1) Theory: The eRWT approach, an extension of the Re-gression Without Truth[19], [20], [21], aims at comparing and ranking different methods which estimate a specific biomarker such as the LVEF, the true value Θp of the biomarker being unknown. Considering P samples (denoted by p, ranging from1 to P ) and K segmentation methods (denoted by M k, ranging from1 to K), each segmentation method M k yields an estimate θpk of the biomarker for sample p.
The eRWT approach assumes a parametric relationship between the true valueΘp and its estimate θpk based on three hypotheses:
H1: The statistical distribution of the true value Θp on the whole database has a finite support.
H2: The estimate θpk is linearly related to the true value (equation (1)). The error term εpk is normally dis-tributed with zero mean and standard deviation σk. The ak and bk parameters are specific to each method M k and independent of sample p:
θpk = akΘp+ bk+ εpk. (1) H3: The error terms εpkfor each method M k are statistically
independent.
Regards to H1, a Beta distribution Beta(µ, ν) was chosen for LVEF [19]. Besides, given all these assumptions, the probability of the estimated values θpk given the linear model parameters and the true value Θp can be expressed and the log-likelihood can be written as a function of ak, bk, σk and the probability distribution ofΘp.
The maximization of this log-likelihood does not require the numerical values of the true LVEF, but only a model of its statistical distribution (pr(Θp)); it leads to the estimates of the linear model parameters for each method (ak, bk and σk). The numerical implementation uses an optimization func-tion implemented in MATLAB (R2012a, The Mathworks, Inc.). The figure of merit FM kchosen to rank the methods M k is defined as the expected value of the square error between the true value of the parameterΘp and its estimated value by a given method (equation (2)) [22].
FM k= E h
(Θ − akΘ − bk−εk) 2i
. (2)
If the statistical distribution ofΘp is a Beta distribution, it can be expressed analytically by equation (3).
FM k = (ak−1) 2 µ(µ + 1) (µ + ν) (µ + ν + 1)+ 2 (ak−1) bk µ µ+ ν + b 2 k+ σ 2 k. (3)
To set the shape parameters of the Beta distribution (µ and ν), we started from the values chosen in[3](µ= 4 and ν = 5) and refined these initial values so as to minimize the sum of the K figures of merit. Final values of the µ and ν parameters were
set to 2.85 and 3.40 respectively. These slight modifications of the Beta distribution compared to that used in [3]did not yield substantial changes in the ranking of the methods, as already shown in[3].
The final ranking of methods was based on a bootstrap process [23] running on the database of P values θpk generating N (N = 1000) θpnk values. From each drawing n, P values pn
were drawn from the 45 samples. From these θpnkvalues, the K figures of merit Fn
M kwere computed using the previously described optimization. The non-parametric Kruskal-Wallis test [24]was applied to the N × K values of Fn
M kto test the equality of the median among the K methods. When it was not equal, each pair of methods was tested, using a Bonferroni correction with a Type I error equal to 5%[25] to determine the significantly different pairs.
2) Experiments: The eRWT approach was first performed to rank the eight segmentation methods (M1 − M 8 described in II-B). This first ranking confirmed that the reference method chosen for the supervised evaluation (i.e. M2) ranked first, as previously established in [3], despite the update of method M8 and the new values of the Beta distribution parameters. The unsupervised eRWT approach was then systematically applied to the eight methods M1 − M 8 and to one of the STAPLE results described in II-C2 to rank each segmenta-tion combinasegmenta-tion, M Si, among the eight initial segmentasegmenta-tion methods.
IV. RESULTS
A. Combination of the segmentation approaches
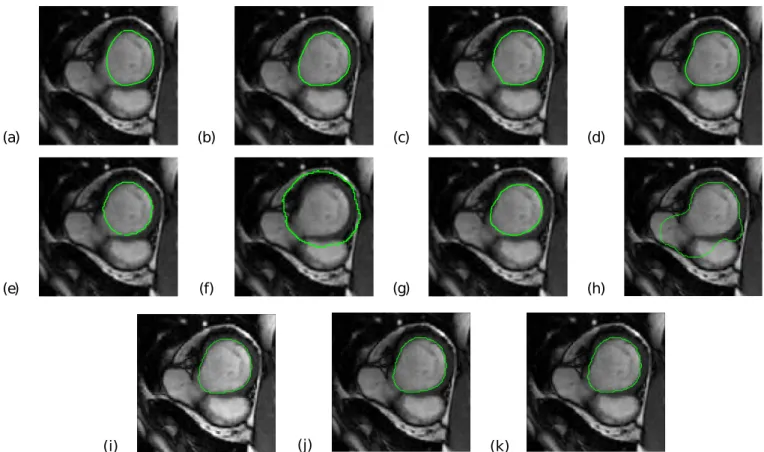
1) Superimposition of contours resulting from different seg-mentation methods on cMRI: Figures 1 and 2 show the endocardial contours obtained using the eight segmentation approaches M1 − M 8 and using three different STAPLE combinations, superimposed on an end-diastolic image. These two figures correspond to two different cases: one patient (SC-HF-01) and one control (SC-N-05). In these two examples, the LV contour was correctly delineated by STAPLE whereas it was over-delineated when using M6 and M 8 (Figure 1) or under-delineated by M5 and M 7 (Figure 2).
2) Estimation of LVEF values for each method: The mean LVEF values and their standard deviations estimated for each subgroup of subjects are displayed in Table I for each initial segmentation method (M1 − M 8) and each M Si method.
B. Supervised evaluation
1) Choice of the reference method: Table II presents the figures of merit computed using the eRWT approach when the eight initial segmentation methods (M1−M 8) were compared. These scores confirmed that M2 could be chosen as the reference method for the supervised evaluation.
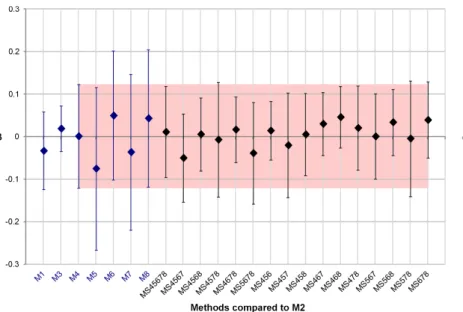
2) Bias in LVEF estimated values: Figure 3 shows the results obtained for the supervised evaluation. Each bias β with respect to the M2 result is represented with its associated standard deviation (error bars corresponding to ±1.96s). This figure shows that expert delineations M1 and M 3 give the closest results to M2, with M 3 showing less variability than M1. When comparing the five automated methods (M 4−M 8),
(n = 12) (n = 12) (n = 12) (n = 9) M 1 23.46±10.36 28.68±14.37 62.17±8.89 60.2±6.60 M 2 25.12±10.55 31.93±14.20 65.39±6.35 66.18±4.98 M 3 26.79±11.75 32.38±14.83 69.90±6.88 66.61±5.43 M 4 24.15±11.75 33.30±16.94 64.95±12.02 66.51±6.07 M 5 24.20±13.41 27.66±11.64 48.79±12.45 57.49±4.26 M 6 25.81±13.19 35.04±17.71 73.94±10.62 74.30±6.73 M 7 22.92±9.91 31.00±15.70 58.49±13.93 61.22±13.92 M 8 31.47±13.13 35.95±15.19 69.50±10.19 68.22±10.86 M S45678 26.59±10.93 34.41±15.89 64.66±10.61 67.21±6.52 M S4567 24.23±10.44 33.42±14.84 61.75±11.37 65.36±5.86 M S4568 27.26±12.34 34.21±14.54 64.87±9.40 67.54±4.28 M S4578 27.01±12.23 32.97±14.71 59.15±11.79 64.20±5.18 M S4678 26.54±10.74 34.95±16.41 69.59±8.30 68.64±5.72 M S5678 26.26± 9.95 32.60±14.17 63.51±10.70 65.59±8.08 M S456 26.87±11.67 33.64±15.02 66.54±9.35 66.99±3.75 M S457 25.07±10.66 32.41±14.36 58.98±12.04 63.85±4.69 M S458 27.85±12.54 33.33±14.26 63.29±9.87 65.94±3.58 M S467 26.70±10.03 34.62±16.22 69.71±8.26 69.59±7.42 M S468 28.47±13.26 35.65±16.47 71.70±5.93 71.08±4.06 M S478 27.76±12.23 34.81±16.67 66.06±9.37 67.94±6.56 M S567 25.31±10.65 31.96±13.31 64.28±10.42 67.46±7.98 M S568 28.19±13.42 34.49±14.23 69.85±6.42 69.47±5.72 M S578 27.20±11.48 32.52±14.13 61.06±12.28 66.0±7.9 M S678 27.63±10.85 34.84±16.43 71.78±7.12 69.83±8.57 TABLE I
MEANLVEFVALUES AND THEIR ASSOCIATED STANDARD DEVIATIONS COMPUTED FOR EACH SEGMENTATION METHOD AND GIVEN FOR EACH SUBGROUP OF SUBJECTS:HEART FAILURE WITH AND WITHOUT ISCHEMIA
PATIENTS(HF-IANDHF-NIRESPECTIVELY),HYPERTROPHIC CARDIOMYOPATHY(HYP)PATIENTS AND HEALTHY INDIVIDUALS
(CTRL).
Method M 1 M 2 M 3 M 4 M 5 M 6 M 7 M 8 Fk 0.003 <0.001 0.001 0.004 0.015 0.008 0.010 0.008
TABLE II
FIGURES OF MERIT(FMk)OF THE EIGHT INITIAL METHODS ESTIMATED BY THE ERWTAPPROACH.
M4 yields the closest result to M 2 with a bias near 0, and the smallest s. Although all semi-automated methods have slightly greater variability than the inter-expert variability, several STAPLE combinations are within the inter-expert variability, with six combinations presenting smaller variability than M1. Method M S456 was the one presenting the smallest variability [β ±1.96s] among all M Si.
To easily compare results obtained for M Si with those obtained with M4 (the best automated method according to the supervised evaluation), the variability obtained with M4 is represented by a red colored box in Figure 3. Among the sixteen tested M Si methods (using or not M4 to create the STAPLE segmentation result), ten were within the range [β ±1.96s] obtained with M 4. The six remaining M Si had a higher bias (in absolute value) than the one obtained with M4, but three of them (M S4567, M S5678 and M S678) had a lower s than M4. M S578 had a higher s than M 4, but lower than the s obtained by the four methods used to create the STAPLE segmentation result. Finally, whereas M S4578 had a s 10% higher than the one obtained with M 4, M S457 had a standard deviation s only 1% higher than the one obtained with M4.
(a) (b) (f) (e) (d) (c) (g) (h) (i) (j) (k)
Fig. 1. Basal cine MRI slice at end-diastole with superimposed contours of the LV (green line) as obtained using the eight segmentation methods included in the study (M 1 to M 8 represented from (a) to (h) respectively) and using the three different combinations of the STAPLE algorithm (M S45678 (i), M S456 (j) and M S4578 (k)). (a) (b) (f) (e) (d) (c) (g) (h) (i) (j) (k)
Fig. 2. Median cine MRI slice at end-diastole with superimposed contours of the LV (green line) as obtained using the eight segmentation methods included in the study (M 1 to M 8 represented from (a) to (h) respectively) and using the three different combinations of the STAPLE algorithm (M S45678 (i), M S456 (j) and M S4578 (k)).
Fig. 3. Supervised evaluation: Computation of the LVEF bias β of each method with respect to values obtained with M 2 and its associated standard deviation (error bars corresponding to ±1.96s). The red box represents results obtained for M 4, the automated method whose results are closest to the M 2 results for this evaluation.
C. Unsupervised comparison of segmentation methods
Table III presents the ranking of the eight initial segmenta-tion methods and of each STAPLE method M Si. Among the sixteen comparisons, method M Si was at a ranking similar to the experts in 14 cases (green M S in the table). The best rank was reached by M S456 (rank equal to 2). Method M S578 was ranked like M4 (rank equal to 4, blue M S in the table), this rank being worse than the experts ranks but better than the individual methods used to create the combination. These results demonstrate that the LVEF parameters were more accurately estimated using this combination of segmentation methods than with any of the segmentation methods used in the combination. The worst rank observed for an M Si approach was obtained for M S4578 with a rank equal to 5 (red M S in the table), worse than M4 used to provide the STAPLE segmentation result. For this test, FM 1 and FM 4 were equal to 0.004, FM S4578 was equal to 0.005, and FM 8 was equal to 0.007. So, even if M S4578 was at the fifth position, its figure of merit was close to the scores obtained with methods M1 and M4. Thus in this case, LVEF parameters estimated using M Si show a clear improvement compared to LVEF estimated using M5, M 7 and M 8.
V. DISCUSSION
A. Use of STAPLE to combine LV segmentations
The aim of this work was to evaluate the efficiency of the STAPLE algorithm [5] to estimate a clinical biomarker, the LVEF, from a segmentation resulting from the combination of different independent segmentation algorithms. To demon-strate it, a collection of segmentation applied to the MICCAI 2009 cardiac MRI database was used. For the forty-five cases of this database eight segmentation methods were available, including delineations provided by three independent experts, and five delineations obtained using five up-to-date automated LV segmentation algorithms. As the LVEF is a primordial
biomarker used in clinical routine, all evaluation tests were performed by focusing on this parameter. The database had the advantage of including a large variety of cardiac diseases (with normal or reduced LVEF) and control subjects. The computation of the mean LVEF value and associated stan-dard deviations for each subgroup showed that values were homogeneous for each subgroup of subjects, whatever the segmentation method used for the LVEF calculation. These first results confirmed that all segmentation methods provided coherent estimates for each subgroup of subjects.
The STAPLE algorithm has already been proposed to define a reference method from different expert segmentations [5], [2]. In the present study, our goal was not to define a consensus between ”experts”, but rather to determine whether some combinations of different independent automated segmentation methods could yield a segmentation as reliable as that of an expert, keeping in mind that each automated method is slightly less powerful than expert delineation. In other words, could a combination of different automated segmentation results yield better results than the ones from each individual method? The question was challenging since several evaluation studies[7], [2]already showed that the STAPLE output strongly depends on the number and on the quality of the inputs used to create the combined segmentation. However, assuming that the automated methods incorporate different strategies, we tested whether their combined use could actually help in improving segmentation results on a whole database. All possible combi-nations of three, four and five automated segmentations were systematically tested.
To assess the segmentation results, a visual inspection of the contours of all STAPLE segmentation results superim-posed onto the MR images was first performed. This visual assessment showed that in most cases, the STAPLE algorithm was able to correct, in every slice, too loose or too tight delineations obtained from automated methods. Supervised
Rank Methods entering the comparison with M S corresponding to: number M S45678 M S4567 M S4568 M S4578 M S4678 M S5678 -P er fo rm an ce + 1 M 2 M 2− M 3 M 2 M 2− M 3 M 2 M 2 2 M 3 M 3 M 3 M 3 3 M S M S M S M 1− M 4 M S M S-M 1 4 M 1 M 1− M 4 M 1− M 4 M 1− M 4 5 M 4 M S M 4 6 M 8 M 8− M 6 M 8− M 6 M 8 M 8 M 8 7 M 6 M 6 M 6 M 6 8 M 7 M 7 M 7 M 7 M 7 M 7 9 M 5 M 5 M 5 M 5 M 5 M 5
Rank Methods entering the comparison with M S corresponding to:
number M S456 M S457 M S458 M S467 M S468 M S478 M S567 M S568 M S578 M S678 -P er fo rm an ce + 1 M 2 M 2 M 2 M 2 M 2− M 3 M 2 M 2 M 2− M 3 M 2− M 3 M 2− M 3 2 M 3-M S M 3 M 3 M 3 M 3 M 3 3 M S M S M S M S M S-M 1 M S M S M 1 M S 4 M 1− M 4 M 1− M 4 M 1− M 4 M 1− M 4 M 1− M 4 M 1 M 1 M 4-M S M 1 5 M 4 M 4 M 4 M 4 6 M 8− M 6 M 8− M 6 M 8 M 8− M 6 M 8 M 8 M 8− M 6 M 8 M 8 M 8 7 M 6 M 6 M 6 M 6 M 6 M 6 8 M 7 M 7 M 7 M 7 M 7 M 7 M 7 M 7 M 7 M 7 9 M 5 M 5 M 5 M 5 M 5 M 5 M 5 M 5 M 5 M 5 TABLE III
RANKING OF THE SEGMENTATION METHODS ACCORDING TO THE DIFFERENT COMBINATIONS OF METHODS.GREENM SHIGHLIGHT METHODSM SiAT AN EXPERT-LIKE RANKING.BLUEM SHIGHLIGHTS METHODM SiRANKED BEHIND THE EXPERTS BUT IN FRONT OF THE INDIVIDUAL METHODS USED
TO CREATE THE COMBINATION.REDM SHIGHLIGHTS WORST RANK OCCUPIED BY A METHODM Si.
and unsupervised statistical evaluations were then performed to assess the results obtained using STAPLE combinations of automated methods.
B. Supervised evaluation
The main idea of the supervised evaluation was to compare the LVEF values estimated by all methods (including the M Si methods) with the values computed by a ”reference” method. This ”reference” method was the M2 method as it yields the best figure of merit when using the eRWT approach on the eight initial methods. The comparison of LVEF values was based on the bias (β) and its associated standard deviation (s) obtained when computing LVEF values using each individual segmentation method compared to the M2 results.
Results showed that M4 was the closest automated method to M2 with a low bias and the smallest standard deviation. Ten among sixteen M Si were closer to the reference method M2 than M 4 and less variable than this latter method. Furthermore, except for M S4578, all combinations resulting from the STAPLE algorithm show more accurate or at least equivalent results compared to the methods being involved in the combination. It can be concluded that the STAPLE algorithm provided segmentation results that yielded more ac-curate or equivalent LVEF results compared to the automated segmentation methods from which the STAPLE combination was based.
The practical comparison of the different segmentation combinations using STAPLE also shows interesting results. For instance, the combination of only three automated segmen-tation methods can provide a LVEF estimate as accurate as the one provided by an expert. Furthermore the bias related to each M Si method is correlated with the sum of the biases observed in the initial methods used in the combination (r = 0.736).
We also observed a systematic reduction of the standard deviation s when combining different methods using STAPLE, compared to the standard deviation of each individual method used in the STAPLE combination. This decrease in standard deviation did not necessarily depend on the number of methods used for the combination.
C. Ranking provided by the eRWT approach
The eRWT approach ranked the expert delineation M2 first, and more generally, the three expert delineations in the top three. The semi-automated method M4 was ranked as the best automated method to estimate LVEF. To evaluate the STAPLE segmentation results (M Si) without using strong a priori on the truth, the eRWT approach was systematically applied to the eight original methods and to an M Si method. In most cases, M Si ranked similarly to the expert delineations (M3 and M1). This means that the STAPLE algorithm based on several automated methods provided similar results to those obtained by experts. In one case (M S578), the rank of the STAPLE method was less than those of experts but was still better than those of the three methods STAPLE was based on. This suggests that the LVEF parameters were once again better esti-mated using the combination of segmentation methods than us-ing any of each initial segmentation method used in STAPLE. Finally, in only one instance (M S4578), M Si was ranked after one of the four methods (M4) used in the combination. However, the figures of merit showed that LVEF parameters estimated using M Si were better than those estimated using three of four methods involved in the combination (M5, M 7 and M8). Furthermore, results obtained with (M S4578) were very close to those obtained with M4. Overall, all experiments showed that the clinical parameters calculated for a specific database were better estimated when combining segmentation
methods with STAPLE than when using one of the initial methods entering the STAPLE combination.
Last, both supervised and unsupervised statistical proaches led to very similar conclusions. Indeed, both ap-proaches showed that the most accurate LVEF was obtained when combining M4, M 5, and M 6. Furthermore, both ap-proaches showed that the poorest results were obtained when combining M4, M 5, M 7 and M 8. This a posteriori con-sistency between conclusions suggests that the use of the unsupervised eRWT approach was relevant in our context and that the different hypotheses underlying the eRWT approach proved to be realistic. The major interest of eRWT is to provide a ranking of different estimation methods based on only few
a priorihypotheses.
D. Future directions
The statistical tools that were used for this study could also be used to compare the STAPLE algorithm with other algorithms that have been developed to define representative contours (for instance, the ones described in [7], [8]). This could help identify the most efficient algorithm to combine contours. However, this would require testing the statistical independency of σk in the eRWT model (equation (1)) when comparing different methods of combination based on the same initial methods.
Due to the difficulty in getting one or multiple expert delineations for clinical segmentation problems, the combined use of different independent algorithms could yield a valuable alternative. Of course, the combination process requires some computing resources, which depend on the segmentation meth-ods involved in the combination and on the method used for combining them (here STAPLE) but it guarantees reproducible results and manual delineation is no longer needed. Due to the quality of results demonstrated by this study, which shows a clear improvement in LVEF estimates using the STAPLE combinations compared to the initial automated segmentation algorithms, it becomes feasible to use automated segmentation algorithms and get stable and reliable results.
Finally our approach was applied to LV segmentation. To extend to other organs, additional tests should be realized.
VI. CONCLUSION
This work aimed at determining whether combining differ-ent segmdiffer-entation results using the STAPLE algorithm could yield a final segmentation as reliable as that of an expert. This approach was tested in the framework of the estimation of left ventricular ejection fraction on the MICCAI 2009 cardiac cine MRI database. Both supervised and unsupervised evaluations showed that in most cases, the LVEF were better estimated using the STAPLE approach than using individually the segmentation methods used to create the STAPLE result. Moreover, the STAPLE segmentation results provided, in most cases, similar estimates to the ones obtained based on manual delineations performed by an expert. The results show that combining different independent automated segmentation methods using the STAPLE approach yielded segmentations that were as accurate as those provided by expert delineating the left ventricular cavities.
ACKNOWLEDGMENTS
The authors thank B´eranger Browaeys for the optimiza-tion step of the Beta distribuoptimiza-tion parameters. This work was performed in the framework of the French MedIEval (Medical Image segmentation Evaluation) working group. The authors gratefully acknowledge the GdR 2647 Stic-Sant´e for its support to the MedIEval action. The research concerning the STAPLE algorithm was supported in part by NIH R01 RR021885 from the National Center for Research Resources, and by an award from the Neuroscience Blueprint I/C through R01 EB008015 from the National Institute of Biomedical Imaging and Bioengineering.
REFERENCES
[1] C. Petitjean and J.-N. Dacher, “A review of segmentation methods in short axis cardiac MR images.,” Med Image Anal, vol. 15, pp. 169–184, Apr 2011.
[2] A. Suinesiaputra, B. R. Cowan, A. O. Al-Agamy, M. A. Elattar, N. Ayache, A. S. Fahmy, A. M. Khalifa, P. Medrano-Gracia, M.-P. Jolly, A. H. Kadish, D. C. Lee, J. Margeta, S. K. Warfield, and A. A. Young, “A collaborative resource to build consensus for automated left ventricular segmentation of cardiac MR images.,” Med Image Anal, vol. 18, pp. 50– 62, Jan 2014.
[3] J. Lebenberg, I. Buvat, A. Lalande, P. Clarysse, C. Casta, A. Cochet, C. Constantinides, J. Cousty, A. de Cesare, S. Jehan-Besson, M. Lefort, L. Najman, E. Roullot, L. Sarry, C. Tilmant, M. Garreau, and F. Frouin, “Nonsupervised ranking of different segmentation approaches: applica-tion to the estimaapplica-tion of the left ventricular ejecapplica-tion fracapplica-tion from cardiac cine MRI sequences.,” IEEE Trans Med Imaging, vol. 31, pp. 1651– 1660, Aug 2012.
[4] V. Chalana and Y. Kim, “A methodology for evaluation of boundary detection algorithms on medical images,” IEEE Trans Med Imaging, vol. 16, no. 5, pp. 642–652, 1997.
[5] S. K. Warfield, K. H. Zou, and W. M. Wells, “Simultaneous truth and performance level estimation (STAPLE): an algorithm for the validation of image segmentation,” IEEE Trans Med Imaging, vol. 23, pp. 903–921, Jul 2004.
[6] A. Chen, K. J. Niermann, M. A. Deeley, and B. M. Dawant, “Evaluation of multiple-atlas-based strategies for segmentation of the thyroid gland in head and neck ct images for imrt.,” Phys Med Biol, vol. 57, pp. 93– 111, Jan 2012.
[7] N. Robitaille and S. Duchesne, “Label fusion strategy selection.,” Int J
Biomed Imaging, vol. 2012, p. 431095, 2012.
[8] S. Jehan-Besson, C. Tilmant, A. De Cesare, A. Lalande, A. Cochet, J. Cousty, J. Lebenberg, M. Lefort, P. Clarysse, R. Clouard, L. Najman, L. Sarry, F. Frouin, and M. Garreau, “A mutual reference shape based on information theory,” in Conf Proc IEEE International Conference on
Image Processing, (Paris, France), p. in press, Oct 2014.
[9] L. Dice, “Measures of the amount of ecologic association between species,” Ecology, vol. 26, pp. 297–302, Jul. 1945.
[10] P. Radau, Y. Lu, K. Connelly, G. Paul, A. Dick, and G. Wright, “Evaluation framework for algorithms segmenting short axis cardiac MRI,” in The MIDAS Journal - Cardiac MR Left Ventricle Segmentation
Challenge, 2009. http://hdl.handle.net/10380/3070.
[11] C. Constantinides, Y. Chenoune, N. Kachenoura, E. Roullot, E. Mousseaux, A. Herment, and F. Frouin, “Semi-automated cardiac segmentation on cine magnetic resonance images using GVF-Snake deformable models,” in The MIDAS Journal - Cardiac MR Left Ventricle
Segmentation Challenge, 2009.
http://hdl.handle.net/10380/3108.
[12] J. Schaerer, C. Casta, J. Pousin, and P. Clarysse, “A dynamic elastic model for segmentation and tracking of the heart in MR image se-quences,” Med Image Anal, vol. 14, pp. 738–749, Dec 2010. [13] J. Cousty, L. Najman, M. Couprie, S. Clement-Guinaudeau, T. Goissen,
and J. Garot, “Segmentation of 4D cardiac MRI: Automated method based on spatio-temporal watershed cuts,” Image Vision Comput, vol. 28, pp. 1229–1243, Aug 2010.
[14] A. Lalande, N. Salv´e, A. Comte, M. C. Jaulent, L. Legrand, P. M. Walker, Y. Cottin, J. E. Wolf, and F. Brunotte, “Left ventricular ejection fraction calculation from automatically selected and processed diastolic and systolic frames in short-axis cine-MRI,” J Cardiovasc Magn Reson, vol. 6, pp. 817–827, 2004.
[15] C. Constantinides, E. Roullot, M. Lefort, and F. Frouin, “Fully auto-mated segmentation of the left ventricle applied to cine mr images: description and results on a database of 45 subjects.,” Conf Proc IEEE
Eng Med Biol Soc, vol. 2012, pp. 3207–3210, 2012.
[16] C. Constantinides, Y. Chenoune, E. Mousseaux, F. Frouin, and E. Roul-lot, “Automated heart localization for the segmentation of the ventricular cavities on cine magnetic resonance images,” in Computing in
Cardiol-ogy, vol. 37, (Belfast, Ireland), pp. 911–914, Sep 26-29 2010. [17] A. P. Dempster, N. M. Laird, and D. B. Rdin, “Maximum Likelihood
from Incomplete Data via the EM Algorithm,” in JOURNAL OF THE
ROYAL STATISTICAL SOCIETY, SERIES B, vol. 39, pp. 1–38, 1977. [18] G. J. McLachlan and T. Krishnan, The EM Algorithm and Extensions.
Wiley-Interscience, 1 ed., Nov. 1996.
[19] M. A. Kupinski, J. W. Hoppin, J. Krasnow, S. Dahlberg, J. A. Leppo, M. A. King, E. Clarkson, and H. H. Barrett, “Comparing cardiac ejection fraction estimation algorithms without a gold standard,” Acad Radiol, vol. 13, pp. 329–337, Mar 2006.
[20] J. W. Hoppin, M. A. Kupinski, G. A. Kastis, E. Clarkson, and H. H. Barrett, “Objective comparison of quantitative imaging modalities with-out the use of a gold standard,” IEEE Trans Med Imaging, vol. 21, pp. 441–449, May 2002.
[21] M. A. Kupinski, J. W. Hoppin, E. Clarkson, H. H. Barrett, and G. A. Kastis, “Estimation in medical imaging without a gold standard,” Acad
Radiol, vol. 9, pp. 290–297, Mar 2002.
[22] M. Soret, J. Alaoui, P. M. Koulibaly, J. Darcourt, and I. Buvat, “Accuracy of partial volume effect correction in clinical molecular imaging of dopamine transporter using SPECT,” Nuclear Instruments and Methods
in Physics Research A, vol. 571, pp. 173–176, Feb 2007.
[23] B. Efron and R. J. Tibshirani, An Introduction to the Bootstrap. New York: Chapman & Hall, 1993.
[24] W. H. Kruskal and W. A. Wallis, “Use of Ranks in One-Criterion Variance Analysis,” Journal of the American Statistical Association, vol. 47, pp. 583–621, Dec 1952.
[25] R. G. Miller, Simultaneous Statistical Inference. New York: Springer Verlag, 2nd ed., 1981.