HAL Id: hal-01409213
https://hal.archives-ouvertes.fr/hal-01409213
Submitted on 5 Dec 2016
HAL is a multi-disciplinary open access
archive for the deposit and dissemination of
sci-entific research documents, whether they are
pub-lished or not. The documents may come from
teaching and research institutions in France or
abroad, or from public or private research centers.
L’archive ouverte pluridisciplinaire HAL, est
destinée au dépôt et à la diffusion de documents
scientifiques de niveau recherche, publiés ou non,
émanant des établissements d’enseignement et de
recherche français ou étrangers, des laboratoires
publics ou privés.
Optimizing the Operation of DBD Excilamps
David Florez, Rafael Diez, Hubert Piquet
To cite this version:
David Florez, Rafael Diez, Hubert Piquet. Optimizing the Operation of DBD Excilamps. IEEE
Transactions on Plasma Science, Institute of Electrical and Electronics Engineers, 2016, vol. 44 (n°
7), pp. 1160-1168. �10.1109/TPS.2016.2568461�. �hal-01409213�
To link to this article : DOI: 10.1109/TPS.2016.2568461
URL :
http://dx.doi.org/10.1109/TPS.2016.2568461
O
pen
A
rchive
T
oulouse
A
rchive
O
uverte (
OATAO
)
OATAO is an open access repository that collects the work of Toulouse researchers and
makes it freely available over the web where possible.
This is an author-deposited version published in:
http://oatao.univ-toulouse.fr/
Eprints ID: 16688
To cite this version: Florez, David and Diez, Rafael and Piquet, Hubert
Optimizing the Operation of DBD Excilamps. (2016) IEEE Transactions on
Plasma Science, vol. 44 (n° 7). pp. 1160-1168. ISSN 0093-3813
Any correspondence concerning this service should be sent to the repository administrator:
[email protected]
Optimizing the Operation of DBD Excilamps
David Florez, Member, IEEE, Rafael Diez, Senior Member, IEEE, and Hubert Piquet
Abstract— Dielectric barrier discharge (DBD) excimer lamps are efficient and environmentally friendly sources of ultraviolet (UV). One of the challenges for this technology to be massively adopted is the optimization and effective management of the overall lamp-supply system. Accordingly, a methodology to study the impact of the operating point over the performance and operation of a DBD UV excilamp is developed and experimentally validated. The DBD operating point is parametrically adjusted by means of the power supply current with three independent variables: intensity, frequency, and duty cycle. This methodology allows the determination of the optimal operating point for the particular excilamp under study. These supplying conditions will be later achieved by means of a dedicated electrical generator, which has to be especially designed according to these specifications. It is found that an increment in the current intensity has a positive impact on the lamp efficiency and also leads to the existence of more filamentary discharges. Also, a relation between the energy of the pulse supplied to the DBD and the reactor efficiency can be established. For certain levels of UV power, energy savings on the reactor higher than 50% are attained by proper selection of the operating point.
Index Terms— Current control, dielectric barrier dis-charge (DBD), excimer lamp, ultraviolet (UV).
I. INTRODUCTION
D
IELECTRIC barrier discharge (DBD) reactors are char-acterized by key features that make this type of discharge well adapted for its use in a variety of processes in the industry and sciences. Some of the DBD applications are surface treatment [1], lighting [2], environmental remediation [3], [4], medicine [5], plasma displays [6], and jet generation [7]. The DBD can operate from low to high pressure (>1 bar) [8], which is beneficial for the enhancement of selected electro-chemical reactions. It also incorporates the advantages of the low-temperature plasma and can produce filamentary or homo-geneous discharges [9]. The specific set of DBD operatingD. Florez is with the Escuela de Ciencias Exactas e Ingeniería, Universidad Sergio Arboleda, Bogotá 110221, Colombia (e-mail: [email protected]).
R. Diez is with the Department of Electronics Engineering, Pontificia Universidad Javeriana, Bogotá 110231, Colombia (e-mail: [email protected]).
H. Piquet is with the Laboratoire Plasma et Conversion d’Energie, Centre National de la Recherche Scientifique, Institut National Polytechnique de Toulouse, Université Toulouse III Paul Sabatier, Toulouse 31071, France (e-mail: [email protected]).
conditions that best fit a particular process is determined by the reactor design and also by the DBD power supply.
DBDs can be powered in a wide range of frequencies (Hz–MHz), current intensities (mA–A), and waveforms (sinusoidal, trapezoidal, square), always in the scale of kilovolts. Unsurprisingly, depending on the values of these parameters, different characteristics of the discharge and performance of the reactor can be achieved; this fact has been already evidenced for different DBD reactors, e.g., DBD-driven ozone generators [10], precipitators [11], and ultraviolet (UV) excilamps [12].
This paper is mainly focused on DBD-driven excil-amps, which are high efficiency and environmentally friendly UV sources, with the potential to replace the traditional mercury-based UV lamps [12], for example, in drinking water treatment applications [13]. One of the challenges for this technology to be massively adopted is the optimization and management of the overall lamp-supply system.
In previous studies, a decrease in the excilamp efficiency with the increment of the electrical power delivered to the bulb [14]–[17], as well as an impact of the operating frequency on the UV production [18], has been found. These results allow to point out that an optimization process of the DBD UV excilamp operating point should lead to maximize the lamp performance (UV production) for a given amount of electrical power. In this work, the DBD operating point is considered only from the perspective of the electrical energy (voltage, current) applied to the DBD. Additional nonelectrical para-meters such as the reactor construction, its physicochemical properties (bulb shape, quartz walls, gas mixture), or operating temperature are considered here as constant parameters.
In this paper, a comprehensive study of the operating perfor-mances is presented, including measurements of the instanta-neous response of the UV radiation, the average UV radiation power density, the parameters of the lamp equivalent electrical model, the lamp efficiency, and the discharge regime as a function of the operating point.
The proposed methodology is presented as follows. In Section II, the DBD operating point and power adjustment is developed, together with the main characteristics of the DBD UV excimer lamp used in this study. In Section III, the experimental bench and the protocols are detailed; here the results are revealed and analyzed, an optimal operating point for the UV excilamp is found, and conclusions are drawn.
II. METHODS ANDEQUIPMENT
The proposed methodology relies on the principle that the DBD electrical power can be accurately adjusted if the DBD current is controlled [18]. As proposed in [19], this current
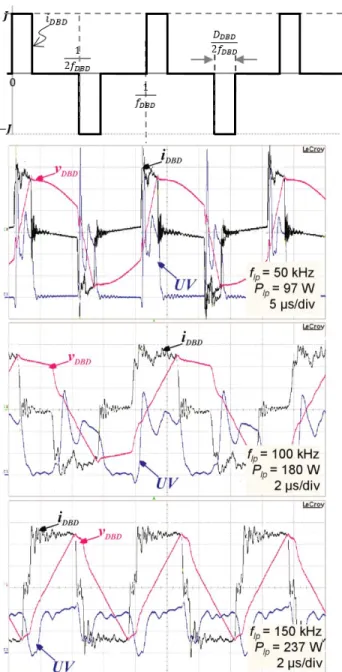
Fig. 1. DBD current (iDBD) used for parametric control of the reactor
operating point. Theoretical (top) and experimental (bottom) waveforms at different operating frequencies (iDBD: 100 mA/div, vDBD: 2 kV/div,
and UV: a.u.).
control can be effectively implemented by means of a square-shaped current mode power supply, which is the alternative chosen for this study.
The employed power supply drives an alternate current through the DBD [Fig. 1 (top)] with a versatile almost square-shaped current waveform, adjusted with three inde-pendent variables: intensity ( J), frequency ( fDBD), and duty
cycle (DDBD). Accordingly, these three parameters will be
called the degrees of freedom (DOF) of the DBD current. Through these three DOF, the intensity ( J) and duration (DDBD/2 fDBD) of the DBD current pulses can be precisely
controlled.
The square-shaped current power supply topology consists of a dc two-quadrant current source connected in cascade with
Fig. 2. DBD excilamp simplified electrical model. The lamp geometry is represented in Fig. 3.
a full-bridge inverter; the output of the latter is connected to the DBD through a stepup transformer. A detailed study concerning the design and operation of this DBD power supply topology can be found in [19] and [20].
To achieve the DBD power adjustment, the design of this power supply takes into account the specific requirements of driving a DBD load [19], which are addressed using a DBD equivalent electrical circuit model and taking into account the needs of the final application: here, an efficient control of the emitted UV dose is required.
The simplified DBD model shown in Fig. 2 has proved to be appropriate for the dimensioning of DBD power supplies [20]. Below, for a coaxial DBD excimer lamp as the one represented in Fig. 3, the most important elements of this model are recalled.
In this type of lamp, the bulb confines a gas mixture between two silica walls. These walls, acting as dielectric barriers, are modeled as the equivalent capacitance Cd. Before the discharge is produced, the gas can also be modeled as a capacitance (Cg) that is in series with Cd.
If properly excited, the voltage across the lamp gas (vCg in Fig. 2) reaches the breakdown voltage (vth)
at which the discharge takes place and the confined gas conductance abruptly changes; experimental measurements show that vCg (which waveform is not directly measurable and needs to be computed) remains almost constant as long as the discharge is sustained [18], with a value near to vth.
Most of the effective power is transferred to the DBD during this phase. A comprehensive analysis of the DBD modeling is treated in [21] and [22].
As a consequence of this voltage source behavior in the gas (when the discharge is ON), the deterministic way to control the discharge power is by means of controlling its current [19], thus leading to the use of a current-mode approach to power the DBD. This supply, due to the capacitive nature of the DBD, must provide a zero-average current to avoid uncontrolled growth of the DBD reactor voltage and further damage in the supply components.
A. DBD Operating Point and Power Adjustment
In accordance with the considerations exposed before, pro-vided this square-shaped current waveform that flows through the DBD and using the simplified DBD equivalent electrical model (Fig. 2), a theoretical expression for the DBD electrical power, as a function of the three DOF is deduced (1). The lamp
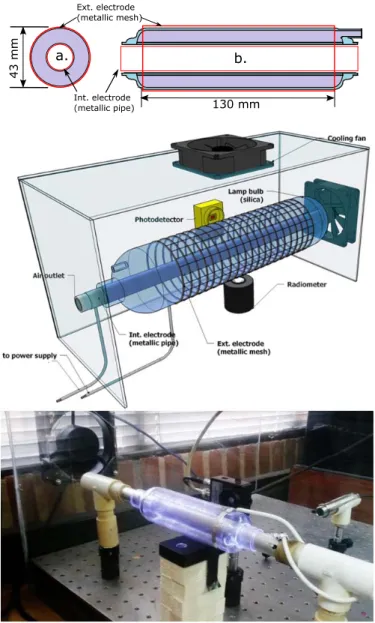
Fig. 3. Experimental bench for measurement and acquisition of the DBD parameters. Top: a—excilamp lateral view, and b—excilamp frontal view.
parameters (defined in the previous section) play an important role here as
PDBD= J DD B Dvth− 4 fDBDCgv2th. (1)
From (1), it is evident that the three DOF defining the operating point are also available to control PDBD. The
use-fulness of this property relies on the possibility of accurately adjusting the lamp electrical power at different operating points; consequently, this feature allows the research of a correlation between the values of the DOF and the reactor performance, e.g., the UV power produced by the excilamp.
Regarding the UV instantaneous response in a DBD excil-amp, a tight correlation of the lamp current intensity and the UV pulse amplitude is observed. For the operating range of the test, once the lamp ignition is produced, UV radiation is emitted without interruption as long as the current is injected into the lamp. In Fig. 1 (bottom), the experimental DBD current and UV waveform are plotted together to demonstrate this similitude at different operating points. The delay between the beginning of the current and the UV pulses corresponds
Fig. 4. DBD excilamp temperature and UV output. fDBD = 100 kHz.
DDBD= 60%. J = 110 mA. PDBD= 85 W.
to the time required to reach the gas breakdown. Once the gas breakdown is produced, the UV pulse starts and its amplitude follows the absolute value of iDBD.
However, one can notice that the initial overshoot in the UV pulse and subsequent oscillations are not observed in the lamp current. In fact, the gas conductance current,
iG in Fig. 1, is responsible for the UV production and after gas breakdown iG is not exactly equal to iDBD. However,
iG cannot be experimentally measured. With the aim to provide an accurate estimation of iG and by this means, an estimation of the UV production, an identification and estimation algorithm is proposed in [23].
B. DBD Parameters Measurement
Using the current-mode supply presented in the previous section, the DBD load (i.e., the UV excilamp) is excited under different operating points, parametrically adjusting the available DOF: J, DDBD, and fDBD. Then, making use of
comparative measurements, the impacts of J and fDBD are
analyzed for the following indicators: the excilamp UV power density, the lamp electrical model, and the appearance of the discharge.
The UV radiation as a function of the time (UV instanta-neous response in Fig. 1. is registered using a THORLABS PDA-25K photodetector. The measurement of the UV average power density is obtained with the GIGAHERTZ-OPTIK P-9710 radiometer, using a UV-3711-308 sensor head. The radiometer is configured with an integration time of 0.5 s and a dose time of 5 s. The setup of the instruments is detailed in Fig. 3. The DBD current and the voltage electrical signals are acquired using high-speed current probes (Lecroy AP015) and a high-voltage differential probe (Agilent N2891A), respectively; the phase difference between the voltage and current signals is compensated in the oscilloscope, then both signals are multiplied and averaged to obtain the power measurement (averaging time 1 ms).
C. Impact of the Lamp Temperature
In Fig. 4, the UV output power and the lamp surface tem-perature evolution at natural convection are shown for a given stable operating point. The stabilization of the temperature and
Fig. 5. Impact of DBD current intensity in the UV output for: fDBD= 50 kHz (red solid lines), fDBD= 110 kHz (blue dashed lines),
and fDBD= 200 kHz (black dashed–dotted lines).
UV power needs around 10 min, since the ignition instant. For this particular operating point, a temperature rise of 100 °C in the lamp surface (with natural convection) and a decrease of 14% in the UV power are observed.
According to these results, in order to minimize the impact of the temperature factor in the study, all the measure-ments are registered when the lamp surface temperature is around 40 °C. Note that the thermal equilibrium is different for each operating point tested in this work, as it depends on the supplied power; however, a fixed temperature is used, considering a final application that sets the lamp temperature, as in water treatment. The rise in the lamp temperature is slowed down thanks to the use of two cooling fans, one for the external electrode and one that forces air through the inner electrode (Fig. 3).
III. RESULTS OF THEPARAMETRICSTUDY
The square-shaped current mode DBD power supply used for this study is able to drive peak currents up to 200 mA in the DBD, within a frequency range from 50 to 200 kHz, a duty cycle from 10%–90%, and a maximum DBD peak voltage of 5 kV. In the following sections, the DBD performance, its equivalent electrical model, and an evaluation of the optimal operating point of the DBD are discussed.
A. Lamp Performance
The DBD excilamp performance is quantified by means of its UV average power density (ρUV).
1) Impact of the Current Intensity: For the first experiment,
the operating frequency fDBD is held constant (e.g., 50 kHz
in Fig. 5), the intensity J is configured at a first set-point value (67 mA), and then, using the current duty cycle DDBD,
different values of lamp electrical power PDBD are obtained.
According to the voltage and current probe specifications, the accuracy of the electrical power measurements is±3.02%.
The process is repeated for other values of J , and for each operating point a measurement of the lamp UV power is obtained, showing the impact of the J parameter over the DBD operation. From the radiometer specifications, the obtained UV power density measurement has a maximum error of±0.5%. In Fig. 5, different types of lines are used to identify the plots of the same operating frequency.
Three values of frequencies are used: the lower and higher limits of operation of the converter, 50 and 200 kHz, respec-tively, and an intermediate frequency, 110 kHz. Four current intensities are used with respect to the limiting value of the converter (250 mA) and assuring the lamp ignition in most of the cases (67 mA); the two other currents 128 and 189 mA are intermediate currents. Some combinations do not ignite the lamp (e.g., 200 kHz and 67 mA) and for this reason are not shown in Fig. 5.
From the fDBD= 50 kHz plots (red solid lines) in Fig. 5,
a notorious increment in the lamp UV production, for the same electrical power injected into the lamp, is obtained when J is increased from 67 to 128 mA. This increment corresponds to a gain of up to 25% in the UV radiation output.
When the current pulse intensity is increased from 128 to 189 mA, the upward trend in the lamp performance is still advised, but for J above 189 mA a significant gain is not observed anymore. For higher values of fDBD
(110 and 200 kHz), this positive impact of the current intensity in the UV production is also verified.
Another characteristic to be noticed is a reduction in the
ρUV-PDBD function slope as PDBD increases. As can be
observed in Fig. 5, as the frequency rises, the downward trend in the slope becomes more evident. This reduction in the ρUV/PDBD ratio with the increase of the injected power
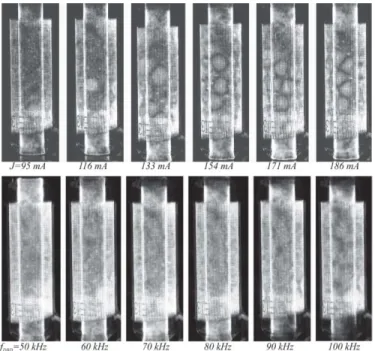
corresponds to a reduction in the lamp efficiency, which can be attributed to overexcitation [15] or to abrupt gas heating [24]. For constant values of PDBD and fDBD, the shape of the
discharges becomes more filamentary as the current intensity increases. This can be observed in the pictures in Fig. 6 (Canon
PowerShot S5 IS, f/5, 1/2000 sec., ISO-400). All the images
in Fig. 6 (top) present the same peak voltage in the lamp and different appearances; therefore, it seems that it is the amplitude of the current and not of the voltage that controls the filament shape.
Accordingly, on the basis of the UV power measurements previously analyzed, the existence of well-defined filaments can be an indicator of high levels of efficiency in the output radiation power. This result complements the experiments presented in [24] and [25], where the transition from diffuse channels to clearly defined filaments is studied and associated to a peak in the lamp efficiency.
2) Impact of the Operating Frequency: For the
sec-ond experiment, fDBD is the parameter to be assessed.
With this aim, J is fixed, fDBD is configured at the
first operating frequency, and using DDBD, the lamp power
is gradually increased. Again, the process is repeated for several values of fDBDacquiring the measurements of interest.
Fig. 6. Changes in the visual aspect of the discharges. Top: J is increased while fDBD = 70 kHz. Bottom: fDBDis increased while J = 100 mA.
PDBD= 80 W for all the pictures.
The UV output as a function of the injected power for a fixed current intensity is shown in Fig. 7, using a different line type for each J value (e.g., black dashed–dotted plots for 250 mA). For J = 250 mA and mainly for PDBD < 120 W,
a reduction in the UV production (up to 35%) is observed when comparing the 140 and 200 kHz plots. The impact of fDBD over UV radiation for the 50–140 kHz range is
negligible. In contrast, the UV output plots obtained for
J = 128 and 67 mA (red dashed and blue solid lines,
respectively, in Fig. 7) reveal that the smaller the current intensity, the higher the impact of the frequency on the lamp performance.
Accordingly, if this particular DBD excilamp is operated at low levels of power (below 120 W), the best option is to use a frequency smaller than 110 kHz to obtain more UV power per injected electrical power unit.
The pictures in Fig. 6 (bottom) have been taken for a constant PDBD and J value. Each picture corresponds to
a different fDBD (50–100 kHz). As can be observed, no
change in the visual aspect of the discharge is noticed. The UV power density obtained for these experiments presents a slight decrease of 6% with the increase in fDBD. In conclusion,
for the range of this test, the visual aspect of the plasma remains diffuse and the UV production does not change significantly with fDBD. Comparing this behavior with the
pictures in Fig. 6 (top), where the change in the discharge from diffuse to filamentary has been accompanied by an increase in the UV power density, a relation between the filamentary appearance of the streamers and a high UV production effi-ciency is suggested.
B. Lamp Electrical Model
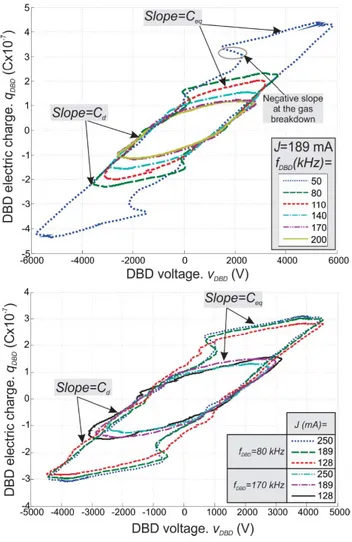
The Lissajous figures, constructed with the DBD charge-voltage trajectory (Fig. 8), are used here for identification of
Fig. 7. Impact of the operating frequency in the UV output for
J = 250 mA (black dashed–dotted lines), J = 128 mA (red dashed lines),
and J= 67 mA (blue solid lines).
the parameters of the simplified DBD model shown in Fig. 2 [2, p. 12].
The DBD voltage (vDBD) in Fig. 8 follows a
counterclock-wise trajectory as a function of the injected charge, qDBD. The
charge is calculated as the integral of the DBD current during a period. Starting from the upper right peak value of vDBD,
the voltage decreases linearly with the charge according to the capacitor voltage change
vDBD=
1
CqDBD. (2)
Consequently, the value of the equivalent capacitor is calcu-lated from the parallelogram slope; prior to the gas breakdown the charge is transferred to Cd in series with Cg, thus this series corresponds to the equivalent capacitor Ceq. Once the
gas reaches the breakdown voltage vth, the slope becomes
equal to Cd and the voltage continues to decrease almost linearly until reaching the lamp negative peak voltage− ˆVDBD. Now knowing Cd, the value of vthis computed according to the
lamp model, using the following equation, with ˆQDBD equal
to the absolute value of the maximum charge injected into the lamp:
vth= ˆVDBD− ˆQDBD
Cd .
Fig. 8. DBD charge-voltage plane for different operating points.
TABLE I
EQUIVALENTLAMPPARAMETERS
In Fig. 8 (bottom), fDBD is held constant (80 and 170 kHz)
and in Fig. 8 (top) a constant J value is used (189 mA). From these trajectories, it is inferred that the slope values (and consequently the equivalent capacitances) are not substantially affected by the changes in the adjusted DOF.
The lamp model parameters, computed for each one of these trajectories, are given in Table I. Using the average value for each of the three parameters to calculate PDBD with (1),
a maximum error of only 8% is obtained compared with the DBD power measurement(J = 189 mA, DDBD= 50%, and
fDBD = 140 kHz). Accordingly, it is possible to use a fixed
DBD model, independent of the three DOF values, to describe the large operating range ( fDBD from 50 to 200 kHz, J from
67 to 250 mA, and DDBDfrom 10% to 90%), and consequently
to design the DBD power supply.
For fDBD = 50 and 80 kHz, an abrupt change in the
sign of the curve slope is observed at the breakdown instant,
as indicated in Fig. 8 (top). This phenomena, although not considered in the simplified DBD model used here, does not have a significant impact on the validity of this model. A more complete model, including an analysis of the gas conductance can be found in [21]–[23].
C. Optimal Operating Point
The DBD excilamp optimal operating point is defined in this study as the set of DOF ( J, fDBD, DDBD) that obtain
a required UV radiation power with the minimum electrical power supplied to the reactor.
Accordingly, from the measurements presented in the pre-vious section, an optimal DBD excilamp operating point (dedicated to the particular lamp under study) has to be found within the studied range.
In order to evaluate the DBD performance, a measurement of the excilamp relative efficiency,ηr(1/cm2), in terms of the energy conversion per unit area, is calculated as the conversion ratio between the electrical power injected into the lamp
PDBD(W) and the UV output power densityρUV(W/cm2) (2).
This is a relative and not an absolute measurement of the irradiation efficiency since the radiometer only captures part of the entire radiation
ηr(1/cm2) = ρUV
PDBD.
(4)
Inspired by [26] and [27], predicting the existence of an optimal range of discharge energy, the excilamp efficiency has been plotted against the energy transferred to the lamp in each current pulse. This pulse energy (EDBD) is calculated as
EDBD=
PDBD
2 fDBD.
(5)
In Fig. 9 (left), the normalized relative efficiency of the lamp is plotted as a function of the supplied pulse energy.
Within the bottom plot, each data point type corresponds to a different J value. According to Fig. 9 (left), the efficiency for the operating points corresponding to the maximum value of J (250 mA) is slightly higher than the others.
In Fig. 9 (top), each data point type means a different operating frequency fDBD. From this figure we find that the
maximum efficiency points are obtained for fDBD = 80 kHz.
From both graphics, an interesting result from the point of view of the physics of the lamp is found; observe that despite the dispersion of the points, in general the lamp efficiency is very low for EDBD< 300 μJ for the tested values of current
frequency and intensity. Note that for fDBD = 50 kHz, no
points below 500μJ are found.
From the results analyzed in Section III-A, to maximize the UV production for a given PDBD value, the minimum
value of fDBD should be preferred. This minimum value of
fDBD is determined from the point of view of the electrical
generator by the maximum tolerated output converter voltage considering, from [13, eq. (2.1.6)], that for a given lamp power, the lamp peak voltage decreases with fDBD
ˆVDBD= vth+
J DD B D 4 fDBDCd.
Fig. 9. DBD excilamp relative efficiency (left) and UV power (right) as a function of the injected electrical power, with the corresponding lamp operating frequency (top) and lamp current intensity (bottom) of the operating point.
From the point of view of lamp efficiency, for a given value of lamp power, the minimum fDBDshould be calculated
according to (5) to drive a pulse energy higher than 300 μJ. On the other hand, in Section III-A it was shown that for a given lamp electrical power, the UV production is enhanced by increasing the current intensity. However, from Fig. 9 (bottom) it is noticed that an increment of the current amplitude above 189 mA does not contribute with an important gain in the lamp efficiency.
However, the maximum lamp efficiency operating point does not guarantee the production of the UV power required for a given application. Henceforth, in order to obtain this desiredρUVwith high efficiency, Fig. 9 (right) should be used.
These figures show theρU V as a function of the lamp electrical power.
To obtain a given value ofρUV, the optimal operating point
is one that requires the least electrical power (PDBD) (the
eftmost data point). For example, if 30 mW/cm2of UV power is required, among the operating points highlighted with a circle in Fig. 9, the leftmost operating point provides 27% of energy savings compared with the data point placed at the right limit of the highlighted region. However, it must be noticed that for ρUV around 18 mW/cm2, an energy saving
of up to 50% can be afforded by proper selection of the operating point. Accordingly, depending on the UV radiation power required for a particular application, making use of the
parametric sweep results shown in Fig. 9, the optimal DBD operating point can be selected.
IV. CONCLUSION
A methodology to quantify the impact of the DBD operating point, over a set of DBD characteristics and allowing to find optimal conditions, was proposed and validated through the study of a particular DBD UV excilamp.
The DBD lamp heating effect over the UV radiation power has been experimentally quantified, indicating the need for performing all the measurements under the same lamp tem-perature.
As a first result, this study confirms that the amplitude and duration of the UV radiation pulses are governed by the lamp current intensity ( J) and the current pulse duration, respectively.
Concerning J , we found that the increment of this variable positively affects the DBD excilamp UV production and also promotes the existence of well-defined filaments in the discharge. However, for the particular experimental bench studied here, for J above 190 mA, there is no significant gain in the lamp performance. In contrast, the simplified equivalent electrical model of the lamp is barely affected by the changes in the operating point. Regarding the DBD operating frequency, we found that the lower the values of the DBD power and J , the more visible the negative effect of incrementing the frequency.
The pulse energy of the current supplied to the discharge seems to be correlated to the excilamp performance. For all the tested operating points and for this particular XeCl DBD excilamp, the best performance points have been obtained with energy pulses higher than 300 μJ.
Finally, we point out that the methodology used for this study, incorporating the use of the square-shaped current mode supply, has demonstrated to be a valuable tool for the evaluation of DBD excimer lamps and validates that only by changing the operating point can the lamp performance be drastically improved. According to [24], the maximum efficiency conditions can differ depending on the gas mixture of the excilamp; consequently, a comparative study of different types of gas mixture DBD excilamps and other DBD reactors is one of the perspectives of this work.
REFERENCES
[1] C. Zhang et al., “Surface treatment of polyethylene terephthalate films using DBD excited by repetitive unipolar nanosecond pulses in air at atmospheric pressure,” IEEE Trans. Plasma Sci., vol. 38, no. 6, pp. 1517–1526, Jun. 2010.
[2] H. Piquet, S. Bhosle, R. Díez, and M. V. Erofeev, “Pulsed current-mode supply of dielectric barrier discharge excilamps for the control of the radiated ultraviolet power,” IEEE Trans. Plasma Sci., vol. 38, no. 10, pp. 2531–2538, Oct. 2010.
[3] V. Y. Plaksin, O. V. Penkov, and H.-J. Lee, “Application of the DBD in the cleaning of diesel engine exhausts,” J. Korean Phys. Soc., vol. 53, no. 5, pp. 2607–2611, Nov. 2008.
[4] J. Jeong and J. Jurng, “Removal of gaseous elemental mercury by dielectric barrier discharge,” Chemosphere, vol. 68, no. 10, pp. 2007–2010, Aug. 2007.
[5] G. Fridman et al., “Blood coagulation and living tissue sterilization by floating-electrode dielectric barrier discharge in air,” Plasma Chem.
Plasma Process., vol. 26, no. 4, pp. 425–442, Aug. 2006.
[6] S.-H. Park, T.-S. Cho, K. H. Becker, and E. E. Kunhardt, “Capillary plasma electrode discharge as an intense and efficient source of vacuum ultraviolet radiation for plasma display,” IEEE Trans. Plasma Sci., vol. 37, no. 8, pp. 1611–1614, Aug. 2009.
[7] C. Monge-Dauge, F. Clement, P. Svarnas, J. Loiseau, A. Ricard, and B. Held, “Experimental study coupled with electrical modeling for the consideration of DBD-based plasma jet,” IEEE Trans. Plasma Sci., vol. 40, no. 9, pp. 2254–2260, Sep. 2012.
[8] R. J. Carman, R. P. Mildren, B. K. Ward, and D. M. Kane, “High-pressure (>1 bar) dielectric barrier discharge lamps generating short pulses of high-peak power vacuum ultraviolet radiation,” J. Phys. D,
Appl. Phys., vol. 37, no. 17, pp. 2399–2407, Sep. 2004.
[9] U. Kogelschatz, “Dielectric-barrier discharges: Their history, discharge physics, and industrial applications,” Plasma Chem. Plasma Process., vol. 23, no. 1, pp. 1–46, Mar. 2003.
[10] M. Amjad, Z. Salam, M. Facta, and S. Mekhilef, “Analysis and imple-mentation of transformerless LCL resonant power supply for ozone generation,” IEEE Trans. Power Electron., vol. 28, no. 2, pp. 650–660, Feb. 2013.
[11] R. Gouri, A. Tilmatine, N. Zouzou, and L. Dascalescu, “Study of DBD precipitator energized by a modified square waveform voltage,”
IEEE Trans. Dielectr. Electr. Insul., vol. 20, no. 5, pp. 1540–1546,
Oct. 2013.
[12] M. M. Guivan, T. Kamikozawa, H. Kurokawa, H. Motomura, K. Kadowaki, and M. Jinno, “Comparative inactivation of
Bacillus subtilis spores using a DBD-driven xenon iodide excilamp and
a conventional mercury lamp,” IEEE Trans. Plasma Sci., vol. 38, no. 8, pp. 1972–1977, Aug. 2010.
[13] D. Florez, “Power supplies for the study and efficient use of DBD excimer UV lamps,” Ph.D. dissertation, Dept. Electron. Pontificia Univ. Javeriana, Inst. Nat. Polytech. Toulouse, Toulouse, France, 2014.
[14] H. Höft, T. Huiskamp, M. Kettlitz, and A. J. M. Pemen, “Visualization of a coaxial dielectric barrier discharge driven by a sub-ns rising high-voltage pulse and its reflections,” IEEE Trans. Plasma Sci., vol. 42, no. 10, pp. 2336–2337, Oct. 2014.
[15] R. J. Carman and R. P. Mildren, “Computer modelling of a short-pulse excited dielectric barrier discharge xenon excimer lamp (λ~172 nm),”
J. Phys. D, Appl. Phys., vol. 36, no. 1, pp. 19–33, Jan. 2003.
[16] E. Panousis et al., “Analysis of dielectric barrier discharges under unipolar and bipolar pulsed excitation,” IEEE Trans. Dielectr. Electr.
Insul., vol. 16, no. 3, pp. 734–741, Jun. 2009.
[17] M. I. Lomaev, E. A. Sosnin, and V. F. Tarasenko, “Excilamps and their applications,” Prog. Quantum Electron., vol. 36, no. 1, pp. 51–97, Jan. 2012.
[18] R. Díez, H. Piquet, and S. Bhosle, “Control of the UV emission of an excimer lamp by means of a current-mode power supply,” in
Proc. 35th Annu. Conf. IEEE Ind. Electron. (IECON), Nov. 2009,
pp. 3500–3505.
[19] D. Florez, R. Díez, H. Piquet, and A. K. Hay Harb, “Square-shape current-mode supply for parametric control of the DBD excilamp power,” IEEE Trans. Ind. Electron., vol. 62, no. 3, pp. 1451–1460, Mar. 2015.
[20] X. Bonnin, H. Piquet, N. Naudé, M. C. Bouzidi, N. Gherardi, and J.-M. Blaquière, “Design of a current converter to maximize the power into homogeneous dielectric barrier discharge (DBD) devices,” Eur.
Phys. J. Appl. Phys., vol. 64, p. 10901, Jul. 2013.
[21] R. Díez, J.-P. Salanne, H. Piquet, S. Bhosle, and G. Zissis, “Predictive model of a DBD lamp for power supply design and method for the automatic identification of its parameters,” Eur. Phys. J. Appl. Phys., vol. 37, no. 3, pp. 307–313, 2007.
[22] A. M. Lopez, H. Piquet, D. Patino, R. Díez, and X. Bonnin, “Parameters identification and gas behavior characterization of DBD systems,” IEEE
Trans. Plasma Sci., vol. 41, no. 8, pp. 2335–2342, Aug. 2013.
[23] L. T. Doanh, S. Bhosle, G. Zissis, and H. Piquet, “Estimation of the light output power and efficiency of a XeCl dielectric barrier discharge exciplex lamp using one-dimensional drift–diffusion model for various voltage waveforms,” IEEE Trans. Ind. Appl., vol. 49, no. 1, pp. 331–340, Jan. 2013.
[24] M. I. Lomaev, V. S. Skakun, V. F. Tarasenko, and D. V. Shitts, “Excilamps based on xenon dimers excited by a barrier discharge,”
J. Opt. Technol., vol. 79, no. 8, pp. 498–502, 2012.
[25] M. I. Lomaev, V. S. Skakun, E. A. Sosnin, V. F. Tarasenko, D. V. Shitts, and M. V. Erofeev, “Excilamps: Efficient sources of spontaneous UV and VUV radiation,” Phys.-Uspekhi, vol. 46, no. 2, pp. 193–209, Feb. 2003.
[26] A. M. Razhev and A. A. Zhupikov, “Influence of the specific pump power on the output energy and efficiency of a 223-nm gas-discharge-pumped excimer KrCl laser,” Quantum Electron., vol. 38, no. 11, p. 1005, Nov. 2008.
[27] A. M. Boichenko, M. I. Lomaev, V. F. Tarasenko, and S. I. Yakovlenko, “The effect of the excitation power on the emission efficiency of barrier-and glow-discharge pumped exciplex barrier-and excimer lamps,” Laser Phys., vol. 14, no. 8, pp. 1036–1044, 2004.
David Florez (M’12) received the B.S. degree in
electronics engineering from Pontificia Universi-dad Javeriana, Bogotá, Colombia, the M.S. degree in the domain of critical systems and networks from Université Paul Sabatier, Toulouse, France, and the Ph.D. degree in electrical engineering from Pontificia Universidad Javeriana and the Insti-tut National Polytechnique de Toulouse, Toulouse, France, in 2014.
He is currently a Professor/Researcher with the Escuela de Ciencias Exactas e Ingeniería, Univer-sidad Sergio Arboleda, Bogotá.
Rafael Diez (SM’15) received the B.S. degree in
electronics engineering from Pontificia Universidad Javeriana, Bogotá, Colombia, in 2001, and the M.S. and Ph.D. degrees from the Université de Toulouse, Toulouse, France, in 2005 and 2008, respectively.
He is currently an Assistant Professor with the Department of Electronics Engineering, Pontificia Universidad Javeriana. His current research interests include development of power converters for electric discharges.
Hubert Piquet was born in Arras, France, in 1960.
He received the B.S. degree in applied physics from the Ecole Normale Supérieure de Cachan, Cachan, France, in 1984, and the Ph.D. degree in electrical engineering from the Institut National Polytechnique de Toulouse, Toulouse, France, in 1990.
He is currently a Full Professor with the Insti-tut National Polytechnique de Toulouse, where he teaches courses on power electronics and systemic approach in electrical engineering. He is currently involved in research with the Laboratoire Plasma et Conversion d’Energie Laboratory, Toulouse. His current research inter-ests include electrical embedded networks and power supplies for plasma applications.