Nonlocal Active Contours
Texte intégral
Figure

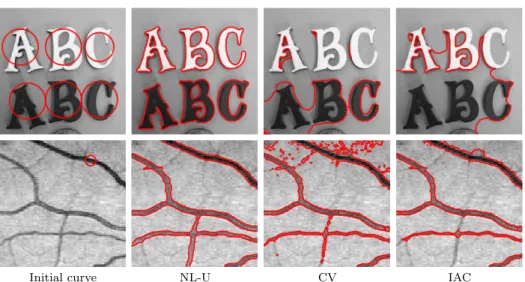
![Fig. 5.5: Natural color images segmentation. Final curves of our un-normalized model NL-U, vector-valued CV [12], and IAC.](https://thumb-eu.123doks.com/thumbv2/123doknet/14300864.494032/16.918.125.648.156.431/natural-images-segmentation-final-curves-normalized-vector-valued.webp)
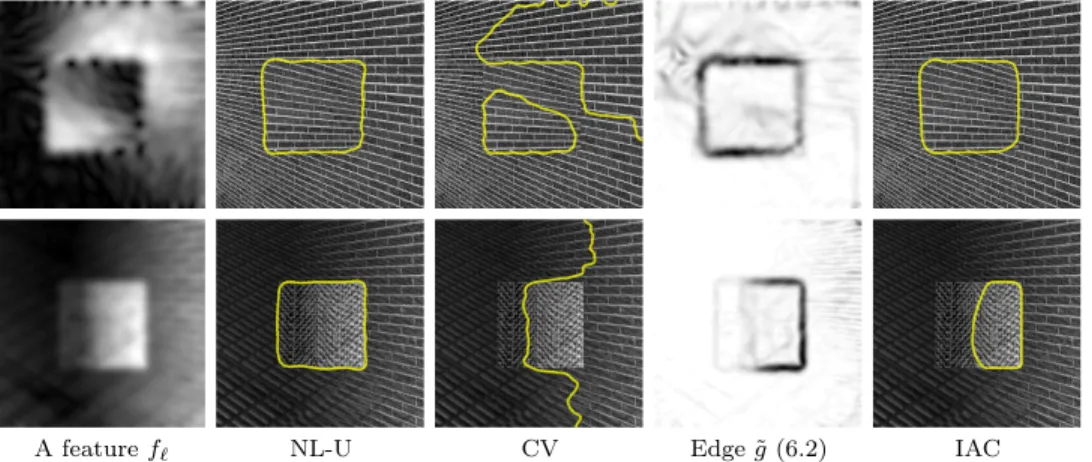

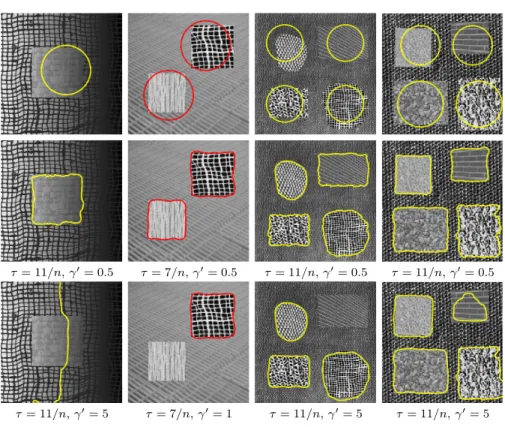
![Fig. 7.4: Texture segmentation of our NL-N model (3.5) with the sliced Wasserstein distance (7.3) with | Θ | = 3 fixed directions, and comparison with the vector-valued Chan-Vese (CV) model [12] and the extended work (CV-Wass) [2] of [40].](https://thumb-eu.123doks.com/thumbv2/123doknet/14300864.494032/22.918.113.659.148.856/texture-segmentation-sliced-wasserstein-distance-directions-comparison-extended.webp)
Documents relatifs
The application preliminary results of this method on computed tomography and X-ray images show outstanding and efficient object extraction. Blanc-Talon
L’archive ouverte pluridisciplinaire HAL, est destinée au dépôt et à la diffusion de documents scientifiques de niveau recherche, publiés ou non, émanant des
Figure 6: Snapshot of a form used for periods between enunciation time and a given time boundary.. The form
First column presents a noisy textured image with an initial contour, the segmenta- tion result on local (4-adjacency graph with Gaussian weights computed on pixel values) and
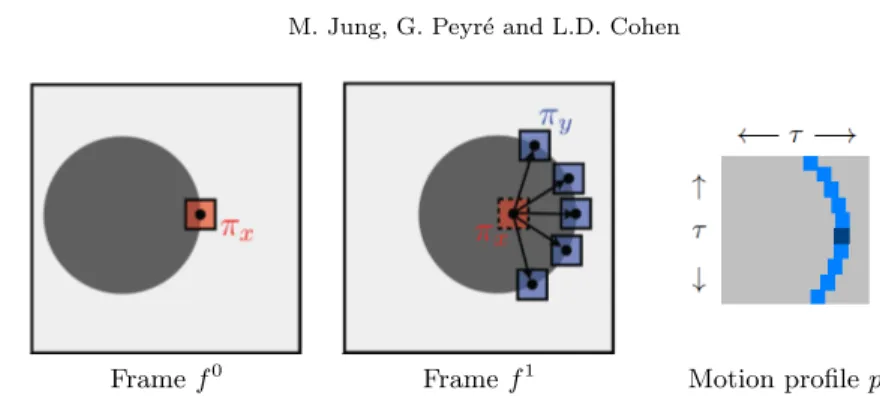
The combi- nation of the two prior terms in the active contour functional yields the final evolution equation whose evolution speed is rigorously derived using shape derivative
They represent respectively the moments estimated directly on the images at resolution of 3.175m (the ground truth) and the extrapolation results obtained by using the scheme
Representative values of apparent activa- tion energies obtained in this study are approximately 80-100 kJ/mol for the low temperature (normal) PLC effect, and 200 to 280 kJ/mol for
Tandis que le deuxième et le troisième volets sont consacrés respectivement au photographe autodidacte William Gedney (en première mondiale à Montpellier) et
