HAL Id: hal-02326898
https://hal.archives-ouvertes.fr/hal-02326898
Submitted on 23 Oct 2019HAL is a multi-disciplinary open access
archive for the deposit and dissemination of sci-entific research documents, whether they are pub-lished or not. The documents may come from teaching and research institutions in France or abroad, or from public or private research centers.
L’archive ouverte pluridisciplinaire HAL, est destinée au dépôt et à la diffusion de documents scientifiques de niveau recherche, publiés ou non, émanant des établissements d’enseignement et de recherche français ou étrangers, des laboratoires publics ou privés.
Negative ion extraction via particle simulation for
fusion: critical assessment of recent contributions
Laurent Garrigues, Gwénaël Fubiani, Jean-Pierre Boeuf
To cite this version:
Laurent Garrigues, Gwénaël Fubiani, Jean-Pierre Boeuf. Negative ion extraction via particle simula-tion for fusion: critical assessment of recent contribusimula-tions. Nuclear Fusion, IOP Publishing, 2017, 57 (1), pp.014003. �10.1088/0029-5515/57/1/014003�. �hal-02326898�
Negative ion extraction via particle simulation for fusion: critical
assessment of recent contributions
L. Garrigues†, G. Fubiani, and J.P. Boeuf
LAPLACE, Université de Toulouse, CNRS, INPT, UPS, France
Abstract
Particle-In-Cell models have been extensively used in the last few years to describe negative ion extraction for neutral beam injection applications. We show that some of these models have been employed in conditions far from the requirements of particle simulations and that questionable conclusions about negative ion extraction, not supported by experimental evidence, have been obtained. We present a critical analysis of the method that has led to these conclusions and propose directions towards a more accurate and more realistic description of negative ion extraction. We show in particular that, as expected in Particle-In-Cell simulations, mesh convergence is reached only if the grid spacing is on the order or smaller than the minimum Debye length in the simulation domain and that strong aberrations in the extracted beam are observed if this constraint is not respected. The method of injection of charged particles in the simulated plasma is also discussed and we show that some injection methods used in the literature lead to unphysical results.
†
A number of papers presenting results of Particle-In-Cell (PIC) simulations [1-12] of negative ion extraction for neutral beam injection (NBI) applications [13-16] have been published in the last ten years. In the negative ion source for ITER, to extract negative ions, an extraction grid (EG) is biased positively with respect to the plasma grid (PG) in contact with the plasma. The plasma grid is covered with a caesium layer. The bombardment of the caesiated PG by fast hydrogen atoms created in the plasma source by the dissociation of molecular hydrogen leads to the generation of negative ions on the PG surface [17].
In the particle simulations of negative ion extraction (we consider here a two-dimensional model), the computational domain is a small region around a grid aperture and periodic boundary conditions around the grid aperture are assumed. In the simulations, the extraction grid (EG) is at a potential of several kV above the plasma grid (see figure 1) and a negative ion current density is emitted from the PG surface. Space charge saturation of this emitted current may occur depending on the intensity of the emitted current density, and on the plasma properties. A magnetic field perpendicular to the simulation domain, the magnetic filter field, (BF - see fig. 1), is imposed in the extraction region. Its role is to reduce the
temperature of electrons flowing from the driver located upstream of extraction region (fast electrons can detach negative ions). A deflection magnetic field BD is added to limit the flux
of electrons extracted with negative ions (co-extracted electrons). One of the requirements for ITER is that the co-extracted electron current be less than the negative ion current. In the PIC simulations, bulk collisions between charged and neutral species are implemented using a Monte Carlo collisions procedure (PIC MCC model).
We focus in this letter on two reasons for which the results presented in a series of recently published papers [3], [7-11] are, in our opinion, not correct and led to questionable conclusions concerning negative ion extraction. These are related to the way the PIC method is used and concern 1) the too large grid spacing used in the simulations, 2) the way the
plasma is generated in the simulation domain. Our argument is based on a detail study of mesh convergence of the simulations for the first point and on basics plasma physics considerations for the second point. These two points are discussed successively below.
Debye length and grid spacing
In Refs. [3], [7-11] the authors generate and maintain a plasma in the simulation domain by injecting one charged particle each time one particle exits the domain (we come back below with more detail on this method). In this way the average charged particle density in the simulation domain stays constant. The region where the particles are generated is upstream, on the left part of the simulation domain. The authors chose to impose a plasma density close to the experimental value measured in the vicinity of the plasma grid, i.e. 1017 m-3 [18]. Assuming an electron temperature of 2 eV, this corresponds to an electron Debye length of 33
m. The authors chose to perform the simulations with a grid spacing between 5 and 10 times larger than the Debye length. They argue that since the plasma density strongly decreases from the injection region to the plasma grid, the grid spacing close to the extraction grid is smaller than the local Debye length. Since the region of interest is the vicinity of the plasma grid (the negative ions are emitted from the surface of the grid and extracted through the grid aperture), they argue that having a grid spacing smaller than the Debye length in this region (and not upstream) is sufficient to get accurate results. This is questionable for two reasons: 1) because the grid spacing is much larger than the Debye length upstream, the plasma transport from the injection region to the plasma grid is not correctly described, 2) the current density of negative ions emitted from the grid surface is on the order of 600 A/m2 [19], which gives, assuming a velocity of 104 m/s of the emitted ions (temperature 1 eV), a density next to the surface of about 3×10¹⁷ m-3. In order to properly describe extraction it is necessary to resolve a Debye length associated with this density and temperature. On a more general point of view it is well known that the grid spacing must be smaller than the minimum Debye length
everywhere in explicit PIC simulations to prevent numerical heating leading to unphysical results, and it is surprising that the authors did not consider this constraint. One of the reasons why they did not respect this constraint may be the fact that using a grid spacing smaller than the Debye length in these conditions is very time consuming in a 2D simulation and would be prohibitive in a 3D simulation.
We analyze in detail below the effect of the grid spacing over Debye length ratio, x/ d with the 2D EP-PIC (Explicit Parallel – PIC) model [20] based on standard PIC techniques [21], [22]. The computational domain is sketched in figure 1. The grid spacing in x and y directions are the same. To keep a reasonable number of grid cells when d is resolved, calculations have been performed with an initial density n0 of 6×10¹⁶ m-3 and a negative ion
current density emitted from the surface equal to 120 A/m2 (about five times smaller than real values). Species considered are electrons, positive ions (𝐻2+) and negative ions (𝐻−). At the
beginning of the simulation, an equal number of electrons and positive ions are loaded with a Maxwellian distribution with a temperature of 2 eV, randomly distributed between x = 0 to x = 26.5 mm. All the simulation parameters are given in Table 1. Only significant collisional processes are considered (assuming a constant cross section , derived from Ref. [23]): for 𝐻− electron detachment and elastic collision with H
2 (same cross-section, = 6.2×10⁻²⁰ m2),
charge exchange with H ( = 1.3×10⁻¹⁸ m2), and for electrons elastic collision with H2 ( =
1.4×10⁻¹⁹ m2).
In all the calculations presented here, the requirements on the time step are strictly respected [21], [22] and the initial number of electrons and positive ions is 40 particles per cell. For particle injection, we used a simple technique which consists in loading a new electron-positive ion pair in the source region each time one positive ion exits the domain i.e. either collides with the PG or crosses the left boundary of the simulation domain [4-6], [12]. We discuss below other techniques used by different authors. Another important point
concerning plasma injection is related to how to impose a given plasma electron temperature. One way to do it is to use an external “thermalization mechanism” [2], [24] which consists in changing at a given frequency (h) the components of the electron velocity according to a
Maxwellian distribution at the given “thermalization” temperature Th (equal to the initial
electron temperature Te). In the simple case of an un-magnetized plasma composed of electron
(of mass m) and positive ions (of mass M) between two grounded walls, if such thermalization (or another similar technique to impose the plasma electron temperature) is not performed, the electron temperature will decrease in time because of the loss of fast electrons through the sheaths. It is easy to check that the injection method with thermalization above allows to reach a steady state with a plasma potential given by the usual formula (for low collisionality):
𝑉𝑝 =𝑘𝑇𝑒
2 [ln ( 𝑀
2𝜋𝑚) + 1] (1)
We show in figure 2 the axial profiles of Te, electric potential V, and charged species
densities at y = 0 for two cases: the first one with a grid spacing of 250 m, i.e. a Debye length significantly larger than the grid spacing, x/d = 6, and the second one with a grid spacing of 32.1 m, equal to the Debye length, x/d = 1 (note that the Debye lengths in both cases are not identical because of different maximum plasma densities, see Fig. 2c). In Fig. 2b, we see that for the case with x/d = 6, Te increases from 2 eV in the source region (where the
thermalization process is used) to 9 eV, along a line from the left boundary to the plasma grid surface. This result is totally unphysical and is due to self-heating [21], [22]. It is a clear consequence of not resolving the Debye length. As a result, we see in figure 2a that the maximum of electric potential reaches 4 V (with large fluctuations in time, not shown). This potential increase strongly affects positive ion transport and limits the flux of positive ions from the injection region to the plasma grid (see Fig. 2c). The presence of positive ions in front of the plasma grid is necessary to neutralize the extracted negative ions. Therefore, in this example, not resolving the Debye length in the injection region, clearly limits the positive
ion flux to the plasma grid and prevents efficient negative ions extraction from the surface. At the PG, the positive ion density is low (~ 1016 m-3) and a virtual cathode is formed with a potential well of 3.4 V and most of emitted negative ions are reflected back leading to a very low negative ion density in the volume (~ 3×10¹⁴ m-3). When x < d, a much more physical description of the plasma properties is obtained. The electron temperature Te (~2 eV) is
practically constant and the potential is relatively flat along a line from the left boundary to the plasma grid surface. The value of the plasma potential with respect to, e.g., the left boundary adjusts according to the balance of charged particle flows to the walls. Its value can be adjusted by changing the imposed potential VLB on the left boundary. The diffusion of
electrons and positive ions from the source region to the PG leads to a positive ion density of 3×10¹⁶ m-3 at the PG, the potential well of the virtual cathode is now less deep (1.2 V) and a larger number of emitted negative ions crosses the potential well. A negative ion density of more than one order of magnitude larger than in the previous case (not respecting the Debye length constraint) is obtained.
The convergence with grid spacing is clearly shown in figure 3. The profiles of the potential along the PG are shown in Fig. 3a for five different values of the grid spacing to Debye length ratio x/d (6, 3, 1, 0.7, 0.5). We see that potential profiles for x/d=1, 0.7, and 0.5 are very close to each other while the profiles for grid spacing larger than the Debye length are significantly different. The particular potential well shape for small x is due to the concave meniscus shape (boundary between plasma and extraction region) formed around the slit aperture that prevents positive ions from reaching the grid close to aperture. For very large grid spacing, due to the large potential well along the grid surface, negative ions can be efficiently extracted from the PG surface only in a reduced to a zone around the aperture. As a result, since most of the extracted negative ions come from the periphery of the meniscus, the large electric field in the y direction induces a negative ion beam with a very bad optic. This
can be seen on Fig. 3b which displays the negative ion current density profiles along the extraction grid for the same five values of x/d. For values of x/d on the order or smaller than 1, the calculated current density profile is centered on axis and the distributions are very close together, which confirms the good mesh convergence of the simulation. For values of
x/d larger than 1, we see a very different current distribution, with a halo on the wings of the current density profiles. These particular profiles are qualitatively close to those shown in the published work of Refs [14], [25-27]. When the Debye length is resolved, 30 % of the negative ion current density is extracted. Note that charge exchange collisions in the plasma volume have an influence on the relative part of the negative ions that exit the domain toward the plasma through the left boundary and those that are extracted through the grid aperture. The percentage of the current extracted from the PG surface, that is extracted through the grid aperture also depends on the potential applied on the left boundary on the simulation domain [33], i.e. on the PG bias. These issues will be discussed in more detail elsewhere.
Plasma injection
The second critical point concerns the way the quasi-neutral plasma is injected and maintained in the simulation domain. We have described above the method used in our simulations and we comment here on the methods used by other authors. Taccogna et al. [1], [3], [7] have used the flux injection technique where appropriate flux distributions of charged particles are injected through the left-boundary plane [28], [32]. This is not trivial since the magnetic field applied along z (BF - see fig. 1) requires re-injecting most of electrons that pass
again the left-boundary plane. The technique of re-injection of all charged particles crossing the left-boundary is questionable for negative ions which are accelerated towards the upstream plasma source where they will be detached by high energetic electrons. Another technique, used in Refs [29-31], consists in a continuous injection of charged particles in a source region and at a given rate. In the work of Refs. [4-6], [8-12], an equal number of
positive and negative charges is initially uniformly distributed in the simulation domain. In Refs [8-11], when one electron or positive ion collides with one electrode or leaves the box, the same type of particle is re-injected at a random position in the source region. We show below that this method is questionable and seems totally inconsistent with the self-consistent description of a plasma in the vicinity of a wall cannot describe properly the physics of a plasma in the vicinity of a wall. For example the balance of current between floating walls in an electron-positive ion, un-magnetized plasma imposes the formation of ion sheaths leading to a total number of electrons smaller than the number of positive ions. If only the total number of ions is imposed in the simulations (and an electron-ion pair is injected each time a positive ion exits the domain), the number of electrons adjusts to satisfy the current balance. In the simulations of [8-11] the physical meaning and consequences of keeping constant the number of electrons and the number ions are absolutely not clear. This is illustrated in Fig. 4, where we show a comparison of the plasma potential profiles obtained with both methods of injection, in the simple case of a one-dimensional collisionless, non-magnetized plasma where only electrons (with a temperature of 2 eV) and 𝐻2+ ions (with a temperature of 0.1 eV) are
considered. The axial dimension is 32 mm and the initial plasma density is 1.2×10¹⁵ m-3 (x/d < 1). The thermalization temperature is 2 eV and the source region is between x = 5 mm and x = 27 mm. When the number of ions is kept constant, one obtains a plasma potential equal to 7.4 V in full agreement with the classical result of Eq. (1). In the second injection method ([8-11]) where the number of ions and electrons are conserved (electrons and ions are replaced independently in the source region when they reach a wall), the plasma potential is negative and the sheaths are reversed. At steady state positive ions are trapped in the domain (their number stays constant and there is almost no ion flux to the walls) while there is a large electron flux through both electrodes (electrons are continuously reinjected to keep constant the number of electrons in the domain). Clearly, current continuity is not respected in this
method since the rates of electron and ion generation in the domain are different. This unphysical result shows, on this simple example, that this injection method is not consistent and cannot describe the physics of sheath formation next to a wall and it is even less able to describe the complex physics of negative ion extraction.
In summary, we consider that the results on the simulation of negative ion extraction for the ITER neutral beam injection system, presented in a series of recent publications, Refs [3], [7-11], are doubtful and led to highly questionable conclusions because 1) the Debye length is not resolved in the simulations, 2) the plasma injection method leads to unphysical results in a simple test case.
Other important questions on the simulation of negative ion extraction are left for future publications [33]. Among those:
- How to properly take into account the plasma properties upstream and around the simulation domain (improvement of plasma injection)?
- What are the best boundary conditions on the sides of the simulation domain?
- A reliable PIC mode must resolve the Debye length. Since this seems prohibitive for 3D PIC simulations, is it possible to perform simulations at lower plasma densities and scale the results meaningfully to real densities?
This work has been carried out within the framework of the EUROfusion Consortium and has received funding from the European Union's Horizon 2020 research and innovation programme under grant agreement number 633053. The views and opinions expressed herein do not necessarily reflect those of the European Commission. Support from CEA and from the French Fédération de Recherche sur la Fusion Magnétique is acknowledged. This work was granted access to the HPC resources of CALMIP supercomputing centre under the allocation 2013-P1125. The authors want to thank A. Simonin from CEA Cadarache for his support.
References
[1] F. Taccogna et al., Phys. Plasmas 15, 103502 (2008).
[2] D. Wunderlich et al., Plasma Sources Sci. Technol. 18, 045031 (2009). [3] F. Taccogna et al., Phys. Plasmas 17, 063502 (2010).
[4] S. Kuppel et al., J. Appl. Phys. 109, 013305 (2011). [5] K. Miyamoto et al., Appl. Phys. Let. 100, 233507 (2012). [6] K. Miyamoto et al., . Appl. Phys. 114, 103102 (2013).
[7] F. Taccogna et al., Plasma Sources Sci. Technol. 20, 024009 (2011). [8] S. Mochalskyy et al., J. Appl. Phys. 111, 113303 (2012).
[9] F. Taccogna et al., Plasma Sources Sci. Technol. 22, 045019 (2013). [10] S. Mochalskyy et al., Plasma Phys. Control. Fusion 56, 105001 (2014). [11] S. Mochalskyy et al., Nucl. Fusion 55, 033011 (2015).
[12] S. Nishioka et al., J. Appl. Phys. 119, 023302 (2016).
[13] D. P. Moehs et al., IEEE Trans. Plasma Sci. 33, 1786 (2005). [14] E. Speth et al., Nucl. Fusion 46, S220 (2006).
[15] R. S. Hemsworth and T. Inoue, IEEE Trans. Plasma Sci. 33, 1799 (2005). [16] U. Fantz et al., Plasma Phys. Control. Fusion 49, B563 (2007).
[17] M. Bacal and M. Wada, Appl. Phys. Rev. 2, 021305 (2015). [18] U. Fantz et al., Nucl. Fusion 46, S297 (2006).
[19] R. McAdams, A. J. T. Holmes, D. B. King, and E. Surrey, Plasma Sources Sci. Technol.
20, 035023 (2011).
[20] P. Coche and L. Garrigues, Phys. Plasmas 21, 023503 (2014).
[21] C. K. Birdsall and A. B. Langdon, Plasma Physics Via Computer Simulation (IOP Publishing, New York, 2005).
[22] R. W. Hockney and J. W. Eastwood, Computer Simulation Using Particles (Adam Hilger, New York, 1988).
[23] R. K. Janev et al.,, Collision Processes in Low-Temperature Hydrogen Plasmas, Tech. Rep. 4105 (FZ-Juelich, 2003).
[24] A. Froese et al., Contrib. Plasma Phys. 50, 273 (2010). [25] R. S. Hemsworth et al., Nucl. Fusion 49, 045006 (2009). [26] Yu. I. Belchenko et al., Rev. Sci. Instrum. 75, 1726 (2004). [27] M. Kashigawi et al., Rev. Sci. Instrum. 85, 02B320 (2014).
[28] L. A. Schwager and C. K. Birdsall, Phys. Fluids B 2, 1057 (1990). [29] R. J. Procassini et al., Phys. Fluids B 2, 3191 (1990).
[30] K. Theilhaber and C. K. Birdsall, Phys. Fluids B 1, 2244 (1989). [31] R. J. Procassini and C. K. Birdsall, Phys. Fluids B 3, 1876 (1991). [32] G. Gozadinos et al., J. Comput. Phys. 172, 348 (2001).
[33] J. P. Boeuf, G. Fubiani, and L. Garrigues, Plasma Sources Sci. Technol. 25, 045010 (2016).
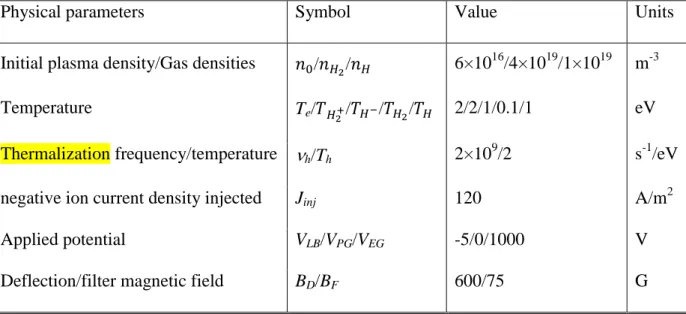
Table 1. Input data used for the simulation
Physical parameters Symbol Value Units
Initial plasma density/Gas densities 𝑛0/𝑛𝐻2/𝑛𝐻 6×10¹⁶/4×1019/1×1019 m-3
Temperature Te/𝑇𝐻2+/𝑇𝐻−/𝑇𝐻2/𝑇𝐻 2/2/1/0.1/1 eV
Thermalization frequency/temperature h/Th 2×10
9
/2 s-1/eV
negative ion current density injected Jinj 120 A/m2
Applied potential VLB/VPG/VEG -5/0/1000 V
Figure captions
Figure 1: schematic view of the simulation domain. Positions are indicated in mm. The grey region is the source region. The electric potentials imposed at the left boundary, plasma grid, and extracting grid are noted VLB, VPG and VEG, respectively. The filter magnetic field is
noted BF. The deflection magnetic field has the form
BDx = BD sin[(y-yR)/d] exp[-(xR-x)/d], BDy = BD cos[(y-yR)/d] exp[-(xR-x)/d], where BD =
600 G, d = 16 mm, yR = d/2, and xR = 32 mm.
Figure 2: profiles along the x direction at y = 0 of (a) electric potential, (b) electron temperature, (c) densities, for a grid spacing of 31.2 and 250 m. The source region is also presented.
Figure 3: profiles of (a) electric potential close to the PG and (b) negative ion current density at EG for five values of the grid spacing, 250, 125, 31.2, 21.3, and 16.5 m, corresponding to x/d =6, 3, 1, 0.7, 0.5. In (a), the potential profiles are plotted at a distance 250, 125, 100, 60, and 60 m from the PG for decreasing values of x/d.
Figure 4: plasma potential profiles obtained with the two injection methods in a simple one-dimensional collisionless and non-magnetized discharge with grounded walls, with only electrons and 𝐻2+ ions. The source region is indicated. In the standard injection method one
electron-ion pair is injected in the source region whenever an ion is lost to a wall (constant number of ions in the simulation). The plasma potential is consistent with Eq. (1). In the other method one ion (resp. electron) is generated in the source region whenever one ion (resp. electron) reaches a wall (constant numbers of ions and electrons in the simulation). This leads to an unphysical potential distribution.
Figure 1.
VPG
= all the particles
VEG x y z BD 240 G 450 G VLB BF H -x H- e H2+ e x H- e x H- e H2+ H2+ 32 28.5 26.5 0 1 3 0 4 12 16
Figure 2. 0 5 10 15 20 25 0 2 4 6 8 10 12 14 0 5 10 15 20 25 10-2 10-1 100 0 5 10 15 20 25 -4 -2 0 2 4 6 31.2 m (b) T e ( eV ) 250 m D en si tie s (1 0 17 m -3 ) X Position (mm) (c) 250 m 31.2 m e H+2 H- (a) 31.2 m 250 m V ( V )
Figure 3. 0 2 4 6 8 10 12 14 16 -4.0 -3.5 -3.0 -2.5 -2.0 -1.5 -1.0 -0.5 0.0 4 6 8 10 12 0 20 40 60 80 100 125 m 16.5 m 16.5 m (a) 21.3 m 31.2 m V ( V ) 250 m 125 m 31.2 m 21.3 m 250 m C ur re nt d en si ty (A /m 2 ) Y position (mm) (b)
Figure 4. 0 5 10 15 20 25 30 -2 -1 0 1 2 3 4 5 6 7 8
re-injection of electrons and ions
Potentia
l (V)
X Position (cm)
source region