Cocapture of cognate and bystander
antigens can activate autoreactive B cells
The MIT Faculty has made this article openly available.
Please share
how this access benefits you. Your story matters.
Citation
Sanderson, Nicholas S. R. et al. “Cocapture of Cognate and
Bystander Antigens Can Activate Autoreactive B Cells.” Proceedings
of the National Academy of Sciences 114, 4 (January 2017): 734–739
© 2017 National Academy of Sciences
As Published
http://dx.doi.org/10.1073/PNAS.1614472114
Publisher
National Academy of Sciences (U.S.)
Version
Final published version
Citable link
http://hdl.handle.net/1721.1/115131
Terms of Use
Article is made available in accordance with the publisher's
policy and may be subject to US copyright law. Please refer to the
publisher's site for terms of use.
Cocapture of cognate and bystander antigens can
activate autoreactive B cells
Nicholas S. R. Sandersona,1, Maria Zimmermanna, Luca Eilingera, Céline Gubsera, Nicole Schaeren-Wiemersa, Raija L. P. Lindberga, Stephanie K. Douganb,2, Hidde L. Ploeghb,3, Ludwig Kapposa,c,d,e, and Tobias Derfussa,c,1
aDepartment of Biomedicine, University Hospital Basel, University of Basel, 4031 Basel, Switzerland;bWhitehead Institute for Biomedical Research,
Cambridge, MA 02142;cClinic of Neurology, Department of Medicine, University Hospital Basel, University of Basel, 4031 Basel, Switzerland;dDepartment
of Clinical Research, University Hospital Basel, University of Basel, 4031 Basel, Switzerland; andeDepartment of Biomedical Engineering, University Hospital
Basel, University of Basel, 4031 Basel, Switzerland
Edited by Lawrence Steinman, Stanford University School of Medicine, Stanford, CA, and approved December 6, 2016 (received for review September 2, 2016)
Autoantibodies against myelin oligodendrocyte glycoprotein (MOG) are associated with autoimmune central nervous system diseases like acute disseminated encephalomyelitis (ADEM). For ADEM, it is specu-lated that a preceding infection is the trigger of the autoimmune response, but the mechanism connecting the infection to the produc-tion of MOG antibodies remains a mystery. We reasoned that the ability of B cells to capture cognate antigen from cell membranes, along with small quantities of coexpressed “bystander” antigens, might enable B-cell escape from tolerance. We tested this hypothesis using influenza hemagglutinin as a model viral antigen and transgenic, MOG-specific B cells. Using flow cytometry and live and fixed cell microscopy, we show that MOG-specific B cells take up large amounts of MOG from cell membranes. Uptake of the antigen from the mem-brane leads to a strong activation of the capturing B cell. When influ-enza hemagglutinin is also present in the membrane of the target cell, it can be cocaptured with MOG by MOG-specific B cells via the B-cell receptor. Hemagglutinin and MOG are both presented to T cells, which in turn are activated and proliferate. As a consequence, MOG-specific B cells get help from hemagglutinin-specific T cells to produce anti-MOG antibodies. In vivo, the transfer of MOG-specific B cells into recipient mice after the cocapture of MOG and hemagglu-tinin leads to the production of class-switched anti-MOG antibodies, dependent on the presence of hemagglutinin-specific T cells. This mechanism offers a link between infection and autoimmunity.
tolerance
|
autoantibodies|
antigen capture|
antigen presentation|
influenzaA
n association between infections and autoimmunity has long been observed in clinical practice. Examples of this association are the onset of Guillain–Barré syndrome after intestinal Cam-pylobacter infections and acute demyelinating encephalomyelitis (ADEM) following respiratory infections. Possible explanations for this connection between autoimmunity and infection include mo-lecular mimicry between the infectious agent and the autoantigen and bystander activation of preexisting autoreactive immune cells. Although the molecular mimicry hypothesis is well supported for Guillain–Barré syndrome (1), the mechanisms leading to automunity in other diseases are not understood. Among the most im-portant suspected viral triggers of ADEM is influenza virus infection (2). It is also known that pediatric patients with ADEM especially mount a humoral immune response against myelin oligodendrocyte glycoprotein (MOG) (3). The mechnism through which the viral infection leads to the production of autoantibodies is unknown.An important checkpoint for the avoidance of autoantibody production is the destruction of autoreactive B cells in the bone marrow (4). Unlike the case of T-cell selection in the thymus, where the transcriptional regulator AIRE ensures the expression of otherwise tissue-specific antigens (5), the set of antigens expressed in the bone marrow is limited, meaning that B cells whose Ig an-tigen receptors (B-cell receptor, BCR) recognize self-anan-tigens re-stricted to other tissues can escape this selection and populate the periphery. Normally this does not lead to autoimmunity, because active production of antibodies requires T-cell help (6). This takes place in secondary lymphoid organs and involves extensive physical
contact with a helper T-cell whose antigen receptor (T-cell re-ceptor, TCR) recognizes a peptide displayed on the B cell’s major histocompatibility complex (MHC) class II molecules. Efficient negative T-cell selection in the thymus therefore also safeguards against the production of autoantibodies. If a B cell that recognizes a self-antigen is artificially enabled to obtain T-cell help, for ex-ample by immunization with the self-antigen covalently linked to an immunogenic foreign protein antigen, class-switched antibodies against the self-antigen can be produced (7).
We hypothesized that breakdown of B-cell tolerance is initiated by the simultaneous uptake of an autoantigen and a viral antigen by B cells from infected parenchymal cells. Antigen capture from cell membranes differs significantly from capture of soluble anti-gen: Membrane-bound antigens are multivalent, increasing the binding avidity in comparison with a monovalent antigen in so-lution (8); moreover, membrane-bound antigens exist in associa-tion with other protein and lipid components of the membrane, so that sometimes these bystander molecules can be cocaptured with the cognate antigen (9). We speculated that if such bystander antigens were processed and presented to T cells, it would cir-cumvent the antigen specificity of T-cell help. Concretely, we hy-pothesize that if an autoreactive B cell binds a cognate self-antigen on the surface of a virus-infected cell, it can capture both self and neighboring viral antigens and, by presenting peptides from the viral antigen, can obtain T-cell help from antiviral T cells, leading to the production of antibodies against the self-antigen.
Significance
The immune system normally produces antibodies against path-ogens and avoids making antibodies against self-proteins. In some individuals, antibodies against self-proteins (autoantibodies) are made and can cause debilitating disease, but the reasons for this failure of self-tolerance are not known. The experiments de-scribed test the following hypothesis linking viral infections and production of autoantibodies: A B cell whose immunoglobulin receptor recognizes a self-membrane protein can capture that protein from the membrane of a virus-infected cell and simulta-neously cocapture viral proteins; fragments of the viral protein can then be presented to antiviral T cells and qualify for the positive signals for proliferation and antibody production known as T-cell help. We observed this phenomenon in vitro and in vivo.
Author contributions: N.S.R.S. and T.D. designed research; N.S.R.S., M.Z., L.E., and C.G. performed research; N.S.-W., S.K.D., and H.L.P. contributed new reagents/analytic tools; N.S.R.S., M.Z., L.E., C.G., and T.D. analyzed data; and N.S.R.S., R.L.P.L., S.K.D., H.L.P., L.K., and T.D. wrote the paper.
The authors declare no conflict of interest. This article is a PNAS Direct Submission.
1To whom correspondence may be addressed. Email: [email protected] or
2Present address: Dana-Farber Cancer Institute, Boston, MA 02215.
3Present address: Boston Children’s Hospital, 1 Blackfan Circle, Boston, MA 02115.
This article contains supporting information online atwww.pnas.org/lookup/suppl/doi:10.
We tested this hypothesis using adherent cells that express the CNS-restricted membrane protein MOG as a model self-antigen, influenza hemagglutinin (HA) as a model viral antigen, and transgenic mouse B and T cells specific for each antigen.
Results
Capture of Cognate Antigen from Membrane Is Rapid and Robust.
Capture of cognate antigen from membrane has been examined in molecular detail (10, 11), generally using isolated membrane prep-arations. We examined the capture of cognate antigen from mem-branes of live cells by IgHMOG transgenic B cells, whose BCR recognizes the extracellular domain of MOG (12). When IgHMOGB cells were exposed to adherent HEK cells that express a MOG-GFP fusion, GFP capture was detected in the B cells by flow cytometry as soon as 1 min after contact and continued to increase for more than 1 h (Fig. 1A–C andMovie S1). Capture was paralleled by loss of surface IgM, indicating internalization of the BCR–antigen complex (Fig. 1A and B). Immunolabeling of cocultures showed that cap-tured antigen and IgM associate with LAMP1-immunoreactive structures within the B cell, presumably lysosomes (Fig. 1D and E). Initially these structures are seen only at the interface of B cell and antigen-expressing HEK cell (Movie S2), but upon prolonged in-teraction, they distribute throughout the B cell (Fig. 1D and E and Movie S3). After extended interaction, the majority of the Ig colocalizes with antigen (Movie S3).
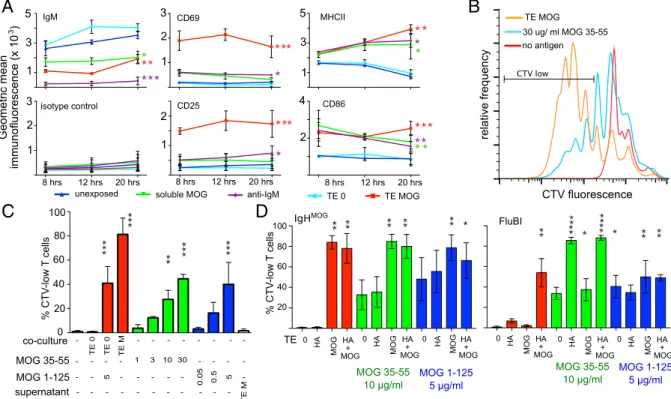
Membrane Antigen Capture Renders B Cells Highly Antigenic for T Cells.
We exposed IgHMOGB cells for 8, 12, or 20 h to adherent TE cells
that express MOG (TE MOG) and examined expression of acti-vation markers by flow cytometry. TE cells are more strongly adherent than HEK cells, facilitating their separation from B cells, but less efficiently transfected. In our hands, the type of
antigen-presenting cell has no obvious influence on B-cell antigen capture. We compared these membrane antigen-capturing B cells with identical B cells exposed to non–antigen-expressing TE cells or to soluble MOG protein or to an IgM-crosslinking antibody. Loss of surface IgM was similar for B cells exposed to soluble or mem-brane-expressed antigen, but up-regulation of the activation mark-ers CD69 and CD25 was far greater on the B cells exposed to membrane antigen (Fig. 2A). Up-regulation of class II MHC and CD86 was similar for the three kinds of BCR stimulation (Fig. 2A). Elevated class II expression was maintained longer after membrane capture than after other forms of BCR stimulation, but this effect was not statistically significant at the time points studied.
We next examined the presentation of captured membrane anti-gens to T cells by coculturing IgHMOGB cells (MHC class II allotype I-Ab) with TE MOG cells and then retrieving and coculturing them with 2D2 T cells, which recognize MOG 35–55 in the context of I-Ab
(13). The 2D2 T cells exposed to IgHMOGB cells after membrane capture proliferated more strongly than those cocultured with naive B cells in the presence of a high concentration of cognate peptide (Fig. 2B and C). Soluble MOG protein was no more effective than peptide (Fig. 2C). Neither B cells exposed to culture supernatants from antigen-expressing cells nor to TE cells that did not express antigen stimulated any proliferation. This rules out involvement of secreted soluble antigen or antigen-independent properties of the TE cells (Fig. 2C). Rather, it appears that the act of antigen capture renders the capturing B cell highly stimulatory for T cells.
To test this interpretation, we assessed the stimulatory properties of B cells after membrane capture of antigens that were irrelevant for the responding T cell, with or without additional peptide that matches the T-cell specifitiy. We exposed HA-specific FluBI B cells (I-Ab) to TE cells stably transfected with HA (TE HA) and then retrieved and cocultured these B cells with 2D2 T cells in the presence or absence
IgH
MOG
wt B cells
non-exposed 1 min 3 mins 10 mins 30 mins 90 mins 210 mins
A
C
D
surface IgM - PE MOG-GFP IgM LAMP1 MOG-GFP 3 mins 60 minsE
0 min 3 min 15 min 45 min MOG-GFP B cell MOG-GFP LAMP1 IgM 3 mins DAPI 60 mins MOG-GFP LAMP1 IgM DAPIB
surface IgM - PE (GMF/non-exposed) non 1 3 10 30 90 210co-culture time (mins)
IgM GFP 20 40 60 80 100 MOG-GFP (GMF/ non-exposed) 0.2 0.4 0.6 1.0 0.8 95 0 5 97 1 2 98 1 2 96 0 3 97 1 2 97 1 2 97 1 0 0 0 0 0 0 0 2 99 0 0 1 32 66 1 1 30 68 1 0 22 74 4 0 20 68 11 0 16 61 23 0 14 53 33 0
Fig. 1. Capture of cognate antigen from membrane.
(A) Flow cytometry of MOG-GFP fusion protein
acquisi-tion and cell-surface IgM by either MOG-specific IgHMOG
or wild-type B cells. Primary splenic B cells were
cocul-tured with MOG-GFP–expressing HEK cells for the times
shown and then retrieved, labeled with anti-CD45R (B220) and anti-IgM antibodies, and measured. Data shown are gated on scatter and B220 immunofluores-cence from one of three similar experiments (gating
strategy is shown inFig. S1). Tick marks on axes show
log10decades and are the same for all plots. (B)
Graph-ical representation of the GFP fluorescence (solid green line) and IgM immunofluorescence (broken purple line) intensities shown in A. For each of the two channels, geometric mean fluorescence divided by its initial value at time 0 is shown on a linear scale against time. Error
bars show SEM. (C) Single 28× 40 μm frames from a live
cell imaging experiment showing the capture of
MOG-GFP (green) from stably transfected HEK cells by IgHMOG
B cells labeled with Cell Tracker Deep Red (magenta). When the Top Left frame was captured, one B cell (broken cyan arrow) was in contact with the HEK cell. Three minutes later (Top Right), a second B cell had made contact (cyan arrow) but has not yet obviously captured antigen. In the subsequent frames at 15 and 45 min, the accumulations of antigen (cyan arrows in lower frames) are visibly increasing. The entire time
se-quence is provided asMovie S1. (D) 3D reconstructions
of confocal z stacks of B cell–HEK MOG-GFP interactions.
B cells were fixed after 3 or 60 min of coculture with HEK MOG-GFP cells and immunolabeled for LAMP1 (red) and IgM (magenta) before laser scanning confocal micros-copy. Stacks of XY planes were processed digitally to generate 3D reconstructions and rotated to show the
view“from the side.” The broken white arrows on each
image show the level at which the planes shown in E
were captured. (Scale bar, 2μm.) The 3D reconstructions are provided asMovies S2andS3. (E)“Horizontal” (i.e., parallel with the coverglass) sections through the same two
cells shown in D. These images are maximum intensity projections of three XY planes each, centered vertically at the level of the broken white arrows in D. (Scale bar, 2μm.)
Sanderson et al. PNAS | January 24, 2017 | vol. 114 | no. 4 | 735
IMM UNOLOG Y AND INFLAM MATION
of exogenous MOG 35–55 peptide (Fig. 2D). Without additional peptide, FluBI B cells stimulated no proliferation of 2D2 T cells, whether or not the B cells had previously encountered HA. With added peptide, even antigen-naive FluBI B cells stimulated T-cell proliferation but much less than B cells that had been previously activated by membrane HA capture (Fig. 2D). The enhanced ability of B cells after membrane capture to stimulate T-cell proliferation may thus be due to the high level of activation of B cells and the concomitant increase in costimulatory ligands (Fig. 2A).
We also measured 2D2 T-cell proliferation in response to MOG-specific B cells exposed to the same TE cells with or without peptide (Fig. 2D). Again, preexposure to membrane-expressed MOG rendered the B cells more stimulatory for the T cells than pulsing with peptide, whereas the presence of HA had no effect. Providing the antigen in a form recognizable by the BCR—that is, soluble MOG 1–125 protein—resulted in only slightly greater stimulation of T-cell proliferation than puls-ing with MOG 35–55 peptide, and IgHMOGB cells were only
slightly better in inducing 2D2 proliferation after capture of MOG 1–125 protein compared with FluBI B cells, which must take up
the protein via a BCR-independent route. Most strikingly, FluBI cells exposed to TE cells that express both HA and MOG stim-ulated the proliferation of MOG-specific T cells, without the ad-dition of exogenous MOG peptide. This implies that MOG had been cocaptured with HA and processed and presented.
Cocaptured, Noncognate Antigen Is Presented and Can Qualify B Cells for T-Cell Help. To visualize the capture of noncognate, “bystander” antigen, we generated an adherent HEK cell line stably cotrans-fected with MOG-GFP and HA (HEK HA MOG-GFP). We cocultured these cells with IgHMOGB cells or with FluBI B cells. Capture of MOG-GFP by IgHMOGB cells followed similar kinetics with or without coexpression of HA, but MOG-GFP capture by FluBI B cells was dependent on HA (Fig. 3A). This bystander cocapture was as rapid as cognate capture, being observable after 3 min of contact, but quantitatively less. Not all antigens we examined were cocaptured. For example, when FluBI B cells were exposed to TE cells that express HA, MOG-GFP, and mOVA-Cherry, the MOG-GFP is cocaptured but the mOVA-cherry is not (Fig. 3B).
A
C
D
B
Fig. 2. Immunological sequelae of membrane antigen capture. (A) Changes in surface expression of various molecules following antigen capture. IgHMOGB cells were
exposed to TE MOG cells or to various comparison treatments for 8–20 h and then retrieved, immunolabeled, and measured by flow cytometry. Responses of B cells exposed
to different conditions are plotted in different colors, as shown in the legend. The vertical axis is the gemometric mean fluorescence value for the population of cells in the B-cell gate. Each point shows the mean of pooled results from three independent experiments, and the error bars show the SEM. Asterisks indicate significant difference from
the unexposed condition (*P< 0.05, **P < 0.01, ***P < 0.001). (B) T-cell proliferation in response to B cells presenting antigen from different sources. IgHMOGB cells were
either exposed to TE MOG cells for 3 h and then retrieved and cocultured with MOG-specific 2D2 T cells (orange line) or else were added naive to the T cells in 96-well plates
with 30μg/mL of MOG 35–55 (cyan line) or without any antigen (red line). The T cells were prelabeled with CTV to enable tracking of proliferation, and after 4 d at 37 °C, the
cocultured cells were retrieved, labeled for B220 and TCR alpha 3.2 (expressed on 2D2 T cells), and subjected to flow cytometry. The range labeled“CTV low” was used to
calculate the values used for C. (C) T-cell proliferation induced by B cells capturing membrane antigen, soluble protein, or soluble peptide. IgHMOGB cells were exposed to
adherent cells and then retrieved for coculture with MOG-specific 2D2 T cells or else were cocultured with T cells in the presence of the indicated antigen concentrations. 2D2 cells were prelabeled with CTV to track proliferation, and after 4 d at 37 °C, the cocultured cells were retrieved, labeled, and measured as in B. The proportion of CD4-positive, CD19-negative cells in the CTV-low gate is displayed as a percentage of the total number of CD4-positive, CD19-negative cells (means of results from three independent
experiments). Red bars show results from conditions in which B cells were precultured with adherent cells, green bars from cells cultured with MOG 35–55 peptide, and blue
from cells cultured with MOG 1–125 recombinant protein. In the negative control, no antigen was added. Other controls include exposure of B cells to antigen-nonexpressing
TE 0 cells or to supernatants from TE MOG cells. Error bars show SEM, and asterisks indicate significant difference from the no-antigen, no-coculture condition (**P< 0.01,
***P< 0.001). (D) Effect of membrane antigen capture on T-cell–stimulating capacity of B cells. MOG-specific IgHMOGB cells (Left) or HA-specific FluBI B cells (Right) were
exposed to MOG or HA or a combination of both, expressed in TE cell membranes. After exposure, B cells were retrieved and cocultured with CTV-labeled MOG-specific 2D2
T cells for 4 d without additional antigen (red bars, left) with 10μg/mL of MOG 35–55 peptide added (green bars, center) or with 5 μg/mL recombinant MOG 1–125 protein
(blue bars, right), and then proliferation of 2D2 cells was analyzed. Bars show mean percentages from three experiments of proliferated T cells in the CTV-low gate. Error bars
Ig-bound antigens may be more efficiently presented to T cells than other endocytosed cargo (14–16). To address whether coacquired membrane antigens were processed and presented on MHC class II, we used TE cell lines stably transfected with MOG and HA or with HA alone. Because WSN/33 HA-specific, class II-restricted transgenic
T cells were not available, we added a carboxy terminal fusion to the HA including amino acids 323–339 of ovalbumin (OVA), a peptide recognized by OT-II T cells in the context of I-Ab. IgHMOGB cells
were exposed to TE HA-OVA or TE MOG HA-OVA for 3 h and then retrieved and cocultured with OT-II T cells for 4 d. T-cell
wt B cells
surface IgM/G - PE
GFP fluorescence
FluBI
120 mins 3mins 30mins 120mins co-cultured HEK HA MOG-GFP
3 mins 30 mins co-cultured HEK MOG-GFP
Naive
A
IgH MOG 91 8 0 2 81 17 0 1 85 14 0 1 8 81 10 1 4 66 30 0 4 59 37 0 90 10 0 0 89 10 0 1 88 12 0 1 97 0 0 2 99 1 0 0 98 0 0 1 80 14 1 6 84 13 0 2 85 13 0 2 8 85 6 0 6 61 33 1 4 54 41 0 11 55 28 6 5 16 58 22 6 12 42 40 mCherryB
GFP fluorescence TE 0 TE MOG-GFP TE HA MOG-GFPmOVA-Cherry TE HA- GFP
0.8 0.2 1.9 97.1 0.3 0.3 67.9 31.8 0.4 0.3 16.7 83.0 0.5 0.1 1.0 98.8
Fig. 3. Flow cytometry of bystander antigen capture. (A) IgHMOGB cells, FluBI B cells, or wild-type B cells were exposed to HEK cells expressing the
com-bination of MOG-GFP fusion protein and HA (HEK HA MOG-GFP) or to cells expressing MOG-GFP alone (HEK MOG-GFP) or not exposed to adherent cells for the indicated times and then retrieved and labeled for B220 and surface Ig for flow cytometry. Gate statistics are percentages of total, and data are rep-resentative of two experiments. (B) Cocapture of MOG-GFP versus mOVA-Cherry with HA by HA-specific B cells. FluBI B cells were exposed to TE cells expressing all three antigens (Bottom Left) or to TE 0 and TE MOG-GFP without HA as negative controls (Top Left and Top Right) or to TE HA-GFP as a positive control (Bottom Right). Intensity of captured MOG-GFP is shown on the horizontal axis, and cocaptured mOVA-Cherry is shown on the vertical axis.
A
B
C
D
E
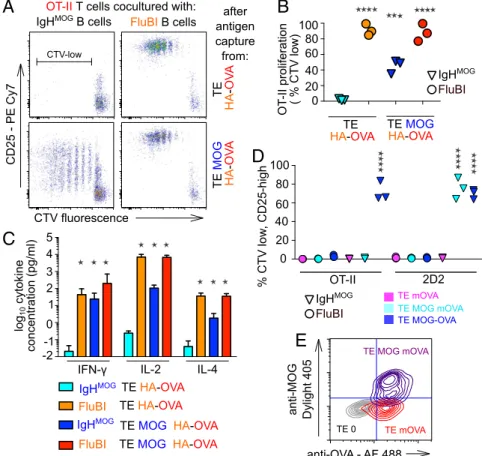
Fig. 4. Immunological sequelae of bystander antigen
cocapture and presentation. (A) IgHMOGB cells or FluBI
B cells were exposed to TE cells expressing either HA fused to the OT-II epitope (TE HA-OVA) or coexpressing both HA-OVA and MOG (TE MOG HA-OVA) for 3 h and then retrieved and cultured with CTV-labeled OT-II T cells for 5 d. Dot plots show CTV intensity against CD25 immunofluorescence for CD4-positive, CD19-negative
cells. MOG (blue) is recognized by the IgHMOGBCR; HA
(orange) is recognized by the FluBI BCR; and the OVA
epitope (red) presented in the context of the I-AbMHCII
expressed by both B-cell types is recognized by the OT-II
TCR. The range in Upper Left marked“CTV-low” was
used to calculate the percentages displayed in the col-umn scatter graph (B). (B) Colcol-umn scatter graph show-ing OT-II T-cell proliferation in three independent experiments like the one shown in A. Vertical axis shows percentages of CD4-positive, CD19-negative cells that fall in the CTV-low gate. Cyan and blue triangles
show results from cocultures with IgHMOGB cells
pre-viously exposed to TE HA-OVA or TE MOG HA-OVA, respectively; orange and red circles show results from cocultures with FluBI B cells previously exposed to TE HA-OVA or TE MOG HA-OVA, respectively. Results from the four conditions pooled from three independent experiments were analyzed by one-way analysis of
variance followed by Dunnett’s test. Asterisks indicate
significant difference from the IgHMOG+ TE HA-OVA
condition (***P< 0.0005, ****P < 0.0001). (C) Cytokine
concentrations in supernatants from OT-II T-cell pro-liferation assays like that shown in A were measured by ELISA. Color scheme is the same as B. Bars show mean and error bars 95% confidence intervals of data pooled
from two similar experiments. Results for IFN-γ,
in-terleukin-2 (IL-2), and IL-4 are shown as indicated on the
horizontal axis. Asterisks indicate significant difference from IgHMOG+ TE HA-OVA condition (two-way ANOVA followed by Bonferroni tests, *P < 0.0001). (D) IgHMOG
B cells (triangles) or FluBI B cells (circles) were exposed to TE cells expressing OVA at the cell surface (TE mOVA, magenta symbols) or coexpressing both MOG and mOVA (TE MOG mOVA, cyan symbols) or a single fusion protein (TE MOG-OVA, blue symbols). After 3 h, the B cells were retrieved and cocultured with CTV-labeled OT-II (left six columns) or 2D2 T cells (right six columns) for 3 d, and then the proliferation of the T cells was assessed by flow cytometry. Vertical axis shows percentage of T cells in the CTV-low, CD25-high gate. Each point is the median of triplicate wells, and in each condition, data are shown from three independent experiments.
Asterisks show significant difference from the FluBI+ TE mOVA + 2D2 negative control condition (****P < 0.0001). (E) Flow cytometric confirmation of membrane
location of MOG and OVA antigens. The TE mOVA and TE MOG mOVA cell lines used in the experiment shown in C were immunolabeled with mouse anti-MOG and rabbit anti-OVA primaries and Dylight 405 anti-mouse and Alexa 488 anti-rabbit secondaries; washed; and measured. The quadrants are set to 99% of the TE 0 negative control in Bottom Left. Gray contours show TE 0 cells, red contours TE mOVA, and blue contours TE MOG mOVA.
Sanderson et al. PNAS | January 24, 2017 | vol. 114 | no. 4 | 737
IMM UNOLOG Y AND INFLAM MATION
proliferation and activation were assessed by flow cytometry of Cell Trace Violet (CTV) dilution and CD25 immunofluorescence, re-spectively. The results from this model were consistent with the de-gree of cocapture observed previously. After exposure to TE MOG HA-OVA, IgHMOGB cells stimulated robust proliferation in OT-II T cells, and this was dependent on MOG (Fig. 4A and B). The increase in CD25 expression was not as great as in the cognate capture con-dition (Fig. 4A), and the percentage of proliferated T cells was also lower (Fig. 4B). We also saw secretion of IFN-γ, IL-2, and IL-4 in the interaction between B cells presenting a cocaptured antigen and T cells responding to that antigen, albeit less than in the cognate cap-ture condition (Fig. 4C). Presentation of the noncognate antigen is dependent on cocapture, because mOVA, which contains the OT-II epitope but is not cocaptured with HA or with MOG (Fig. 3B), is also not presented to OT-II T cells by IgHMOGor FluBI B cells after exposure to TE MOG mOVA (Fig. 4D). To be certain that this result was not due to inadequate expression of the mOVA protein at the cell membrane, we confirmed the accessibility of extracellular, membrane-bound OVA in live TE MOG mOVA cells (Fig. 4E). To test whether cocaptured antigen would qualify B cells for T-cell help, we used the same combination of model antigens— that is, IgHMOGB cells capturing antigen from TE cells expressing
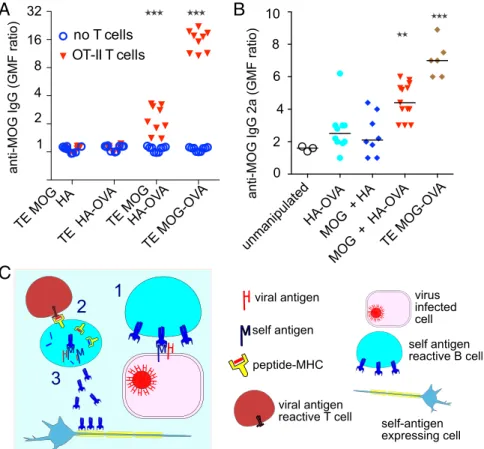
both MOG and HA-OVA—but extended the subsequent coculture of IgHMOGB cells with OT-II T cells to 7 d. To exclude the in-volvement of BCR-independent antigen uptake and the possibility that the mere fact of capturing antigen stimulates antibody pro-duction, we included negative controls of IgHMOG B cells inter-acting with TE HA-OVA or with TE MOG HA. As a positive control, another cell line was established that stably expresses MOG fused to the OT-II OVA epitope (TE MOG-OVA). We exposed the IgHMOGB cells to the TE cells expressing the different antigen combinations, retrieved and cocultured them with OT-II T cells, and measured anti-MOG antibodies in the culture supernatants. Omitting the T cells, the OVA epitope, or MOG, no antibodies were detected.
When OT-II T cells were present and the OVA epitope was included in the B-cell cognate antigen, antibody production was robust. We clearly detected antibodies also when the OVA epitope was present on the HA antigen (Fig. 5A). Autoreactive B cells that present cocaptured viral antigen can thus be triggered to produce autoanti-bodies by unrelated antiviral T cells. To test whether cocaptured antigen could mediate T-cell help in an in vivo setting, we exposed IgHMOGB cells to adherent cells expressing the same four combi-nations of antigens and adoptively transferred them into Rag−/−mice, together with OT-II T cells. Two weeks later, the mice were killed and anti-MOG antibodies in the serum were measured using an IgG2a-specific secondary antibody. Results mirrored those obtained in vitro: Antibodies were clearly produced in the cocapture condition (anti-genic cells coexpressing MOG and HA-OVA)—at a lower level than in the cognate capture paradigm (cells expressing MOG-OVA) but well above the baseline level (Fig. 5B). IgG2a production in the two negative control conditions (cells expressing either HA-OVA alone or MOG and HA) was not significantly different from baseline.
Discussion
Capture of antigen from membranes represents an alternative way of collecting antigen for B cells. It leads to strong activation of the B cell and robust antigen presentation. We show that membrane capture carries the risk that other antigens than the cognate one are cocap-tured via the BCR, with two potentially pathological consequences: (i) Antiviral B cells acquire autoantigens together with the viral an-tigen and activate autoreactive T cells, and (ii) autoreactive B cells acquire viral antigens together with the autoantigen and get T-cell help from antiviral T cells to produce autoantibodies (Fig. 5C). We provide evidence that both consequences can occur.
It is clear from our results that not all combinations of antigen, although present in the same membrane, will be cocaptured. The absence of significant cocapture of the membrane–OVA fusion protein indicates that the phenomenon does not involve wholesale
A
B
C
Fig. 5. Antibody production following
cocapture-dependent T-cell help. (A) MOG-specific IgHMOGB cells
were exposed to adherent TE cells expressing MOG and HA separately, OVA alone, MOG and the HA-OVA fusion, or MOG-HA-OVA fusion (TE MOG-HA-OVA); re-trieved; and cocultured with (inverted red triangles) or without (open blue circles) OT-II T cells. After 7 d, se-creted anti-MOG antibodies were assayed by labeling MOG-expressing or -nonexpressing reporter cells with the supernatants and detecting the bound antibodies with an anti-mouse IgG-specific secondary by flow cytometry (see Materials and Methods). The vertical axis shows the MOG-specific binding calculated as the ratio of geometric mean fluorescence (GMF) MOG-expressing:-nonexpressing reporter cells. All nine data points are plotted for each condition (Three
Experi-ments× Three Replicate Cultures). Median values from
the three experiments were pooled and analyzed by
Kruskal–Wallis test and each condition compared with
the no T cells condition (***P< 0.001). (B)
MOG-spe-cific IgHMOGB cells were exposed to adherent TE cells
expressing HA-OVA alone, MOG and HA separately, MOG and the HA-OVA fusion, or MOG-OVA fusion (TE MOG-OVA); retrieved; and adoptively transferred
into Rag−/−mice previously given OT-II T cells. After
2 wk, serum levels of anti-MOG IgG2a were mea-sured by flow cytometry exactly as described in A but using an mouse IgG2a-specific secondary anti-body. Each point shows the value from the serum from one mouse. GMF ratios were subjected to one-way ANOVA, followed by Dunnett’s test to compare each of the four experimental conditions with the
un-manipulated (serum from Rag−/−mice given neither B
cells nor T cells) condition (**P< 0.01, ***P < 0.001,
unmarked groups not significantly different from
un-manipulated). (C) Hypothetical model of the bystander antigen cocapture and presentation phenomenon in which an autoreactive B cell cocaptures self- and viral antigen from an infected cell and fraudulently gains T-cell help from a viral antigen-specific T cell, leading to the secretion of autoantibodies.
capture of large fragments of membrane and is likely to be limited to a subset of protein antigens that either share some particular localization in the membrane or else have some direct interaction. One possibility, for example, is that the interaction we observe here depends on the interaction between sialic acid residues on the MOG protein and the sialic acid-binding domain of the HA (17). This would limit the phenomenon to the set of sialated proteins, which includes much but not all of the membrane proteome (18). A major function of viral glycoproteins is attachment to host cell membranes, and therefore, the likelihood that viral proteins bind to the extracellular domains of membrane proteins is high.
A limitation of our study is that antigen capture takes place in vitro. Experimentally, this enables us to control the coexpression of antigens, and to be sure that they are captured directly by B cells rather than by some third cell type, but begs the question of how and where B cells capture and cocapture antigen in vivo. A large body of work has demonstrated that soluble antigens and fluid-borne viral particles are trapped and offered to B cells in the sec-ondary lymphoid tissue by specialized cells including subcapsular macrophages and follicular dendritic cells (19). However, we en-visage that cocapture events relevant to autoimmunity are more likely to occur during direct capture of viral antigen from infected cells, which is likely to occur during the B-cell infiltration of infected tissues that is seen during the acute response to virus (20).
The generation of autoantibodies via the cocapture mechanism is likely to be limited in several parameters. First, it will only occur during infections by viruses that encode abundant membrane proteins—that is, enveloped viruses. Second, autoantigens are limited to membrane proteins with an exposed extracellular domain. Third, the availability of nonanergised autoreactive B cells will be greatest for antigens that are not expressed in the bone marrow and particularly for antigens whose expression is limited to tissues that are not patrolled extensively by B cells under normal (i.e., noninflamed, noninfected) conditions, thereby avoiding the mechanisms of pe-ripheral tolerance that are known to be triggered by exposure to self-antigen in the absence of cognate T-cell help (21). These limitations might explain why this phenomenon rarely translates into the in-fection-associated autoimmunity seen in clinics. Nevertheless this mechanism represents an important deviation from a fundamental principle of immunology that has stood up well since its formulation in 1969: that antibody secretion by a B cell depends on an interaction with a T cell recognizing the same antigen (22). We envisage that this and further study of the phenomenon will lead to significant modi-fications in the understanding of B-cell biology, autoimmunity, and tolerance.
Materials and Methods
Methods are described in detail inSI Materials and Methods. Cell lines are
described inTable S1, primary immune cells are described inTable S2, and
abbreviations used in the text are explained inTable S3.
Mice and Primary Immune Cells. C57BL/6 and Rag−/−mice were bred in the
Uni-versity of Basel Mouse Core Facility. Tg(TcraTcrb)425Cbn (OT-II) mice on a Rag2−/−
background were a kind gift from Ed Palmer, University of Basel, Basel, Switzerland. FluBI mice (23) were bred from founder members provided by Stephanie Dougan and
Hidde Ploegh, Whitehead Institute, Cambridge, MA. IgHMOG(ref. 12; also known as
Th B cells) and C57BL/6-Tg(Tcra2D2,Tcrb2D2)1Kuch/J (2D2) mice (13) were bred from founder members provided by Guru Krishnamoorthy and Hartmut Wekerle, Max-Planck-Institut für Neurobiologie, Martinsried, Germany. Primary immune cells were obtained from spleens by mechanical disruption and brief settlement to remove tissue fragments. B cells and CD4-positive T cells were obtained by negative selection using biotinylated antibodies and magnetic beads from Miltenyi. All procedures involving animals were considered and authorized by the Cantonal Tierversuchskommission. Anti-MOG Antibody Assay. Anti-MOG antibodies were measured in sera and in culture supernatants by flow cytometry as previously described (3). Supernatants were mixed with two volumes of reporter cell suspension in PBS containing 2% FCS by volume and 1 g/L of sodium azide on ice. The reporter cells include equal numbers of unlabeled TE MOG cells and CTV-labeled TE 0 cells. After 30 min on ice, the cells are washed, and antibodies adhering to the TE MOG cells are de-tected with Alexa 647 anti-mouse IgG or PerCP-conjugated anti-IgG2a secondary antibodies (both from Jackson Immunoresearch) and measured by flow cytom-etry. TE 0 and TE MOG populations are then separated by CTV label, and the ratio of geometric mean fluorescence intensities between TE MOG:TE 0 indicates the abundance of antibody in the supernatant.
Statistics. Geometric mean fluorescence intensities of activation markers on B cells were analyzed by two-way analysis of variance (time versus condition) and the effect
of condition by one-way analysis of variance followed by Dunnett’s Multiple
Com-parison Test to compare each of the conditions against“no stimulation.” T-cell
pro-liferation data (proportions of cells in the CTV-low gate) and anti-MOG Ig levels in sera
were analyzed by one-way analysis of variance followed by Dunnett’s test. Anti-MOG
IgG levels in culture supernantants, expressed as ratios of geometric mean immuno-fluorescence TE MOG:TE 0, were analyzed by two-way analysis of variance (presence of T cells versus antigen condition), revealing a strong interaction, with an effect of condition limited to the T cells present condition. The Kruskal–Wallis test was
there-fore used to assess the effect of antigen condition, and Dunn’s Multiple Comparison
Test was used to compare each of the conditions with the T cells absent condition. ACKNOWLEDGMENTS. We thank D. Merkler, A.- K. Pröbstel, E. Palmer, G. Krishnamoorthy, J. Lünemann, and I. Tsunoda for advice and A. Sylvain, T. Peyer, A.- C. Lecourt, and the staff of the microscopy and flow cytometry core facilities of the DBM for technical help. Funding was provided from Swiss National Science Foundation Grants 310030_149966 and an MUAM award from the Medical Faculty of the University of Basel.
1. Jasti AK, et al. (2016) Guillain-Barré syndrome: Causes, immunopathogenic mecha-nisms and treatment. Expert Rev Clin Immunol 12(11):1175–1189.
2. Wang GF, Li W, Li K (2010) Acute encephalopathy and encephalitis caused by in-fluenza virus infection. Curr Opin Neurol 23(3):305–311.
3. Pröbstel AK, et al. (2011) Antibodies to MOG are transient in childhood acute dis-seminated encephalomyelitis. Neurology 77(6):580–588.
4. Wardemann H, et al. (2003) Predominant autoantibody production by early human B cell precursors. Science 301(5638):1374–1377.
5. Klein L, Kyewski B, Allen PM, Hogquist KA (2014) Positive and negative selection of the T cell repertoire: What thymocytes see (and don’t see). Nat Rev Immunol 14(6):377–391. 6. Fulcher DA, et al. (1996) The fate of self-reactive B cells depends primarily on the degree of
antigen receptor engagement and availability of T cell help. J Exp Med 183(5):2313–2328. 7. Steinhoff U, Burkhart C, Arnheiter H, Hengartner H, Zinkernagel R (1994) Virus or a hapten-carrier complex can activate autoreactive B cells by providing linked T help. Eur J Immunol 24(3):773–776.
8. Batista FD, Iber D, Neuberger MS (2001) B cells acquire antigen from target cells after synapse formation. Nature 411(6836):489–494.
9. Suzuki K, Grigorova I, Phan TG, Kelly LM, Cyster JG (2009) Visualizing B cell capture of cognate antigen from follicular dendritic cells. J Exp Med 206(7):1485–1493. 10. Carrasco YR, Batista FD (2006) B cell recognition of membrane-bound antigen: An
exquisite way of sensing ligands. Curr Opin Immunol 18(3):286–291.
11. Natkanski E, et al. (2013) B cells use mechanical energy to discriminate antigen af-finities. Science 340(6140):1587–1590.
12. Litzenburger T, et al. (1998) B lymphocytes producing demyelinating autoantibodies: Development and function in gene-targeted transgenic mice. J Exp Med 188(1):169–180. 13. Bettelli E, et al. (2003) Myelin oligodendrocyte glycoprotein-specific T cell receptor trans-genic mice develop spontaneous autoimmune optic neuritis. J Exp Med 197(9):1073–1081.
14. Drake L, McGovern-Brindisi EM, Drake JR (2006) BCR ubiquitination controls BCR-mediated antigen processing and presentation. Blood 108(13):4086–4093. 15. Zhang M, et al. (2007) Ubiquitinylation of Ig beta dictates the endocytic fate of the B
cell antigen receptor. J Immunol 179(7):4435–4443.
16. Lanzavecchia A (1990) Receptor-mediated antigen uptake and its effect on antigen presentation to class II-restricted T lymphocytes. Annu Rev Immunol 8:773–793. 17. Xiong X, McCauley JW, Steinhauer DA (2014) Receptor binding properties of the influenza
virus hemagglutinin as a determinant of host range. Curr Top Microbiol Immunol 385:63–91. 18. McDonald CA, Yang JY, Marathe V, Yen TY, Macher BA (2009) Combining results from lectin affinity chromatography and glycocapture approaches substantially im-proves the coverage of the glycoproteome. Mol Cell Proteomics 8(2):287–301. 19. Cyster JG (2010) B cell follicles and antigen encounters of the third kind. Nat Immunol
11(11):989–996.
20. Rainey-Barger EK, et al. (2011) The lymphoid chemokine, CXCL13, is dispensable for the initial recruitment of B cells to the acutely inflamed central nervous system. Brain Behav Immun 25(5):922–931.
21. Rathmell JC, et al. (1995) CD95 (Fas)-dependent elimination of self-reactive B cells upon interaction with CD4+ T cells. Nature 376(6536):181–184.
22. Rajewsky K, Schirrmacher V, Nase S, Jerne NK (1969) The requirement of more than one antigenic determinant for immunogenicity. J Exp Med 129(6):1131–1143. 23. Dougan SK, et al. (2013) Antigen-specific B-cell receptor sensitizes B cells to infection
by influenza virus. Nature 503(7476):406–409.
24. Ehst BD, Ingulli E, Jenkins MK (2003) Development of a novel transgenic mouse for the study of interactions between CD4 and CD8 T cells during graft rejection. Am J Transplant 3(11):1355–1362.
25. Schindelin J, et al. (2012) Fiji: An open-source platform for biological-image analysis. Nat Methods 9(7):676–682.
Sanderson et al. PNAS | January 24, 2017 | vol. 114 | no. 4 | 739
IMM UNOLOG Y AND INFLAM MATION