HAL Id: hal-00909519
https://hal.archives-ouvertes.fr/hal-00909519
Submitted on 26 Nov 2013
HAL is a multi-disciplinary open access
archive for the deposit and dissemination of sci-entific research documents, whether they are pub-lished or not. The documents may come from teaching and research institutions in France or abroad, or from public or private research centers.
L’archive ouverte pluridisciplinaire HAL, est destinée au dépôt et à la diffusion de documents scientifiques de niveau recherche, publiés ou non, émanant des établissements d’enseignement et de recherche français ou étrangers, des laboratoires publics ou privés.
High and low molecular weight crossovers in the longest
relaxation time dependence of linear cis-1,4 polyisoprene
by dielectric relaxations
Clément Riedel, Angel Alegría, Philippe Tordjeman, Juan Colmenero
To cite this version:
Clément Riedel, Angel Alegría, Philippe Tordjeman, Juan Colmenero. High and low molecular weight crossovers in the longest relaxation time dependence of linear cis-1,4 polyisoprene by dielectric relax-ations. Rheologica Acta, Springer Verlag, 2010, vol. 49, pp. 507-512. �10.1007/s00397-010-0433-1�. �hal-00909519�
O
pen
A
rchive
T
OULOUSE
A
rchive
O
uverte (
OATAO
)
OATAO is an open access repository that collects the work of Toulouse researchers and
makes it freely available over the web where possible.
This is an author-deposited version published in :
http://oatao.univ-toulouse.fr/
Eprints ID : 10272
To link to this article
: doi:10.1007/s00397-010-0433-1
URL :
http://dx.doi.org/10.1007/s00397-010-0433-1
To cite this version
: Riedel, Clément and Alegría, Angel and
Tordjeman, Philippe and Colmenero, Juan High and low molecular
weight crossovers in the longest relaxation time dependence of linear
cis-1,4 polyisoprene by dielectric relaxations. (2010) Rheologica Acta,
vol. 49 (n° 5). pp. 507-512. ISSN 0035-4511
Any correspondance concerning this service should be sent to the repository
administrator:
staff-oatao@listes-diff.inp-toulouse.fr
DOI 10.1007/s00397-010-0433-1
High and low molecular weight crossovers in the longest
relaxation time dependence of linear cis-1,4 polyisoprene
by dielectric relaxations
Clément Riedel · Angel Alegría · Philippe Tordjeman · Juan Colmenero
Abstract The dielectric relaxation of cis-1,4
Polyiso-prene [PI] is sensitive not only to the local and seg-mental dynamics but also to the larger scale chain (end-to-end) fluctuations. We have performed a care-ful dielectric investigation on linear PI with various molecular weights in the range of 1 to 320 kg/mol. The broadband dielectric spectra of all samples were mea-sured isothermally at the same temperature to avoid
Paper presented at the De Gennes Discussion Conference held February 2–5, 2009 in Chamonix, France.
C. Riedel (
B
) · J. ColmeneroDonostia Internacional Physics Center, Paseo Manuel de Lardizabal 4, 20018 San Sebastián, Spain e-mail: riedel@ies.univ-montp2.fr C. Riedel
IES - Groupe Micro Rhéo Acoustique - UMR5214, Université Montpellier 2 – CC/084,
Place Eugène Bataillon, 34095 Montpellier, France
C. Riedel · A. Alegría · J. Colmenero
Departamento de Física de Materiales UPV/EHU, Apdo. 1072, 20080 San Sebastián, Spain
A. Alegría · J. Colmenero Centro de Física de Materiales,
(UPV/EHU-CSIC) - Material Physics Center (MPC), San Sebastián, Spain
P. Tordjeman
INPT-CNRS, Institut de Mécanique
des Fluides de Toulouse, Université de Toulouse, 1 Allée du Professeur Camille Soula,
31400 Toulouse, France
utilizing shift factors. For the low and medium mole-cular weight range, the comparisons were performed at 250 K to access both the segmental relaxation and normal mode peaks inside the available frequency win-dow (1 mHz–10 MHz). In this way, we were able to observe simultaneously the effect of molecular mass on the segmental dynamics—related with the glass tran-sition process—and on the end-to-end relaxation time of PI and thus decouple the direct effect of molec-ular weight on the normal mode from that due to the effect on the monomeric friction coefficient. The latter effect is significant for low molecular weight (Mw<33kg/mol), i.e., in the range where the crossover
from Rouse dynamics to entanglement limited flow occurs. Despite the conductivity contribution at low frequency, careful experiments allowed us to access to the normal mode signal for molecular weights as high as Mw= 320 kg/mol, i.e., into the range of high
molecular weights where the pure reptation behav-ior could be valid, at least for the description of the slowest chain modes. The comparison between the di-electric relaxations of PI samples with medium and high molecular weight was performed at 320 K. We found two crossovers in the molecular weight depen-dence of the longest relaxation time, the first around a molecular weight of 6.5 ± 0.5 kg/mol corresponding to the end of the Rouse regime and the second around 75 ± 10 kg/mol. Above this latter value, we find a power law compatible with exponent 3 as predicted by the De Gennes theory.
Keywords Rouse model · Reptation theory ·
Crossover · Entanglement · Dynamics · 1,4-cis-Poly(isoprene) · Dielectric relaxation
Introduction
The chain dynamics of linear polymers is one of the ba-sic and clasba-sical problems of polymer phyba-sics; thereby, it has been the subject of intensive investigation, both experimentally and theoretically, over many years. Rouse theory (Rouse 1953) and the reptational tube model introduced first by de Gennes (1971) and de-veloped by Doi and Edwards (1986) are the two fundamental theoretical approaches to describe the molecular relaxations of unentangled and entangled polymers, respectively. Concerning the dynamics of en-tangled polymer many corrections (as Contour Length Fluctuation or Constraints Release) to the pure repta-tion have been attempted to obtain a totally predictive theory (Viovy et al. 2002; McLeish 2002). It is also a well-known fact that the different regimes describing the polymer dynamics are function of their molecular weight and molecular weight distribution. Abdel-Goad et al. (2004), using rheology measurements coupled with an empirical winter relaxation BSW model, ob-tained three different exponents (1, 3.4, and 3) in the molecular weight dependence of the zero shear viscos-ity. In a recent work (Riedel et al. 2009), the validity of the Rouse model for unentangled polymer melts have been tested in full detail by using broadband di-electric spectroscopy (BDS). Previous BDS studies on the molecular weight dependence of the normal mode relaxation time showed a crossover from the unentan-gled dynamics to the entanglement regime (Boese and Kremer 1990; Yasuo et al. 1988; Adachi and Kotaka
1993; Watanabe2001; Watanabe et al.2002). However, none of them has been able to access the crossover to the exponent 3 expected by the pure reptation theory which, as aforementioned, has been detected for the viscosity.
In this paper, we have carefully investigated the dynamics of 1,4-cis-poly(isoprene), which was obtained by anionic polymerization with a narrow distribution of molecular weights over a broad molecular weight range: Mw in the range 1–320 kg/mol. PI is a A-type
polymer, i.e., BDS experiments are sensitive to the large chain motion involving end-to-end vector fluctua-tions (normal mode). As BDS is particularly sensitive to the slow chain modes, it gives a quite direct access to the longest relaxation time since it can be obtained from the dielectric loss peak frequency. In that way, we will detail how careful BDS experiments allow de-tecting the two different crossovers from the Rouse up to the pure reptation regime. Entanglement effects in BDS spectra will be also analyzed. Finally, the possible influence of the narrow molecular weight distribution
of the samples on the dielectric loss shape will be discussed.
Material and methods
Polymers
1,4-cis-Poly(isoprene) samples were provided by Poly-mer Source. They were synthesized by living anionic polymerization of isoprene in a-polar media. After polymerization, the poly(isoprene) backbone is consti-tuted mainly by cis units (80%). The molecular weight (Mn)and polydispersity index (determined from
size-exclusion chromatography experiments) of the samples investigated are listed in Table 1. To avoid oxidation, PI samples were stored at −25◦C. In addition, before
the experiments, samples were dried in a vacuum oven at 70◦C for 24 h to remove any trace of solvent and humidity.
Dielectric spectroscopy
A broadband dielectric spectrometer, Novocontrol Alpha analyzer, was used to measure the complex di-electric permittivity, ε∗(ω) = ε′(ω) −iε′′(ω), ω = 2π f, in the frequency ( f ) range 10−2–106 Hz. The samples
were placed between parallel gold-plated electrodes of 20 mm diameter. The value of the gap between the electrodes was fixed to 0.1 mm (by a narrow PTFE cross shape piece). The measurements accuracy in the whole frequency range was better than 2·10−4 for the
dielectric loss permittivity. Isothermal measurements were performed every 10◦ over the temperature range 220–350 K using a temperature controller based on N2-gas jet stream (Novocontrol). The temperature
stability so obtained resulted in all the cases better than ±0.1 K.
Table 1 Microstructure of the samples investigated in this work
Sample code Mn[kg/mol] Mw[kg/mol] Ip Tg[K]]
PI-1 1.1 1.2 1.11 194 PI-3 2.7 2.9 1.06 203 PI-11 10.1 10.5 1.04 209 PI-35 33.5 34.5 1.04 210 PI-82 76.5 82 1.07 210 PI-145 138 145 1.07 210 PI-320 281 320 1.14 210
Mn average molecular weight, Mw weight-averaged molecular
weight, Ippolydispersivity index, Tgglass transition temperature
determined from the middle point of the DSC trace at a heating rate of 10 K/min after cooling down at the same rate
Results
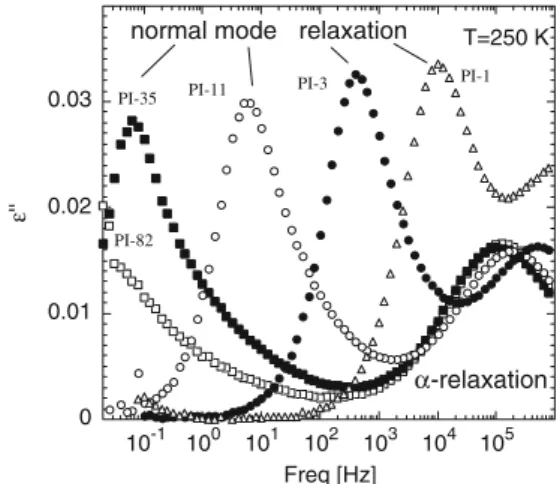
Figure 1 presents the raw data of the dielectric loss permittivity of some of the PI samples investigated. The broad frequency window of BDS (eight decades in a single spectrometer) permits to measure the two relaxations—segmental and normal mode—at the same isothermal measurement for most of the samples. It is apparent that the segmental dynamics (α-relaxation) of PI has relaxation times that are essentially indepen-dent on the chain molecular weight as far it is above 10 kg/mol, whereas the normal mode relaxation shifts rapidly to lower frequencies on increasing molecular weight. This fast variation of the normal mode relax-ation peak prevents detecting it at this temperature for molecular masses higher than about 50 kg/mol. Thus, we will first focus the analysis on the samples with lower molecular mass. First, it should be noticed that for very low molecular masses the observed changes in the longest relaxation time could be attributed to two different sources. On one hand, the intrinsic slow-ing down of the end-to-end fluctuations as the chain length increases, and on the other hand, the changes in the local friction coefficient arising because the significant changes in the end chain groups accompa-nying the changes in molecular weight. As a signa-ture of these changes the glass transition temperasigna-ture of the small molecular weight samples is significantly lower than that obtained for molecular weights higher than 10 kg/mol, which remains essentially constant (Tg= 210 K). As can be seen in Fig.1, this last behavior
is also found for the dielectric α-relaxation. Thus, in order to disentangle this effect on the normal mode relaxation time from that directly related with the chain
0 0.01 0.02 0.03 10-1 100 101 102 103 104 105 Freq [Hz] ε'' T=250 K PI-82 PI-35 PI-11 PI-3 PI-1 α-relaxation normal mode relaxation
Fig. 1 Raw BDS data showing the normal mode and the
α-relaxation of the lower molecular weight PI samples at 250 K
length, the ratio of the normal mode time scale to that of the α-relaxation was evaluated. The obtained result is shown in Fig.2. For completeness, data from other two PI samples previously measured in our laboratory are also included, namely for PI samples with values of
Mw= 6.7 kg / mol and Mw= 4.6 kg/mol. To increase
the plot sensitivity to changes between the different regimes, a factor of Mw−2has been applied to the ratio
between the characteristic times (reciprocal of the peak angular frequency) of the two relaxation processes, i.e., τN/τα. From this plot, it becomes evident that the Mw2
dependence expected for unentangled polymers on the basis of the Rouse theory is fulfilled for samples with molecular weight below 6.5 ± 0.5 kg/mol. This value is actually only slightly higher than that of the mole-cular mass between entanglements (Me= 5 kg/mol)
obtained from neutron scattering experiments. How-ever, this value is clearly out of the uncertainty of the crossover molecular weight between the two regimes detected from the present experiments. The exponent describing the higher molecular mass range considered in this plot was 3.2 ± 0.1 which is distinctly lower, but close, to the 3.4 usually found in rheological experi-ments (Ferry1980). It is noteworthy that imposing this exponent to fit our data will result in a higher value of the crossover molecular weight, thus increasing the discrepancy with the reported/admitted value of Me
mentioned above. It is noteworthy that, as it is well known, the ratio τN/τα will change with temperature
(Ding and Sokolov 2006). Nevertheless, the previous results will not change significantly using data at other
102 103 100 101 102 τ / τ α M w -2 [ k g -2 m o l 2 ] M w [kg/mol] Ν
Fig. 2 Longest and segmental relaxation time ratio as a function
of the molecular weight at 250 K. The vertical axis is scaled by M2
to emphasize the transition from the Rouse to the intermediate regime. The solid line corresponds to the description of the data with a sharp crossover between two power law regimes with different exponents (see text)
temperatures because the changes in the value τN/τα
will be very similar for all the samples having different molecular weights, and consequently, the resulting molecular weight dependence would be unaltered.
After analyzing the molecular weight dependence of the end-to-end fluctuations in the low and mod-erate molecular weight range, now we will focus the attention in the highest accessible molecular weights. In the high molecular weight range, the comparison among the different samples has to be performed at a significantly higher temperature due to the dramatic slowing down of the chain dynamics. The more suitable temperatures are those where the normal mode loss peak of the sample with the highest molecular weight occurs in the slow frequency range of the experimental window. An additional factor that has to be taken into account is the fact that by increasing temperature, the conductivity contribution to the dielectric losses be-comes more prominent. The conductivity contribution appears as a ω−1 increasing of the dielectric losses. This is an important issue even for high-quality samples when the experiments require accessing to the low frequencies at temperatures far above Tg. This situation
is illustrated in Fig.3for the raw data of the PI sample having the highest investigated molecular weight. It is apparent that at 340 K, the normal mode peak can be well resolved from conductivity for this sample, but it would be hard to resolve the normal mode relaxation at this temperature for a sample with a significantly higher molecular weight. Furthermore, increasing tem-perature would not improve the situation since the overlapping of the conductivity contribution with the normal mode relaxation will also increase. This is a serious limitation of the dielectric methods for inves-tigating the slowest chain dynamics in highly entangled systems. Nevertheless, as shown in Fig.3, resolving the
0 0.01 0.02 0.03 10-2 10-1 100 101 102 103 104 105 ε' ' Freq. [Hz] T=340K
PI-320 PI-145 PI-82 PI-35
PI-10
Fig. 3 Normal mode of the high molecular weight PI samples.
Dashed linerepresents the calculated conductivity contribution
to the dielectric losses for the PI-320 sample
4 10-9 7 10-9 10-8 101 102 103 τ M w -3 [ s kg -3 m o l 3 ] M w [kg/mol] Ν
Fig. 4 Longest relaxation time from the higher molecular weight
PI samples. The graph is scaled to M3to emphasize the crossover
from the intermediate to the reptation regime. The solid line corresponds to the description of the data with a sharp crossover between to power law regimes with different exponents (see text)
normal mode peak was possible for all the samples in-vestigated, although the contribution from conductivity will increase the uncertainty in the peak position for the samples with very high molecular weight. Figure4
shows the molecular weight dependence of the slowest relaxation time for the high molecular weight regime obtained from the data presented in Fig.3. Trying to increase the sensitivity of the plot to possible changes in behavior, the data have been multiplied by Mw−3,
which would produce a molecular weight independent result for a pure reptation regime. Despite the un-certainties involved, our results evidence that for the highest molecular weight samples, the molecular mass dependence approaches the pure reptation regime ex-pectation. The line in Fig.4corresponds to a crossover from and exponent 3.35 to a pure reptation-like regime. The small difference between this exponent and that obtained above from Fig. 2 is more likely due to the fact that the sample with the lower molecular weight considered in Fig.4has a significantly lower glass tran-sition temperature, an effect not considered in Fig. 4. The crossover molecular weight obtained from Fig.4is 75 ± 10 kg/mol, i.e., it corresponds to about 15 times
Me. This value is slightly lower than that determined
from viscosity data (Abdel-Goad et al.2004).
Discussion
The results previously described showed three different regimes for the molecular weight dependence of the chain longest relaxation time in PI, one below 7 kg/mol following the Rouse model prediction as expected for a non-entangled polymer melts, other above 75 kg/mol
where the reptation theory provides a good descrip-tion and an intermediate one, where the polymer is entangled but other mechanisms (like contour length fluctuations or constraints release) in addition to rep-tation would control the whole chain dynamics. In a recent publication, we have shown that the Rouse model provides a very satisfactory description of the whole normal mode relaxation of unentangled PI once the narrow sample polydispersity is properly taken into account. On the other hand, in the rheological experi-ments above referred (Abdel-Goad et al.2004), it was shown that the viscosity of high molecular weight PI samples conforms well the reptation theory predictions. Thus, we decided to test up to what extent the pure reptation theory is able to describe the normal mode relaxation spectrum of the highly entangled PI samples. This test can evidence the ability of the reptation the-ory to capture the main features of the slowest chain dynamics, despite the well-documented failure of the reptation theory in accounting for the whole chain dynamics, even in the high molecular weight range. This is clearly evidenced by the reported mismatching of the normalized dielectric and rheological spectra (Watanabe2001). To this end, we compared our exper-imental data on the high molecular mass samples with the corresponding reptation theory predictions for the end-to-end vector relaxation, which reads as:
D ER (t) · ER (0)E ∝ X p:odd 1 p2exp ³ −p2t τd ´ (1)
where p refers to a given normal mode and τd is the
disengagement (reptation) time, which would corre-spond in good approximation to τN. The corresponding
expression for the normal mode dielectric relaxation would be: ε′′(ω) ∝ X p:odd 1 p2 ωτd/p2 1 +¡ωτd/p2¢2 (2)
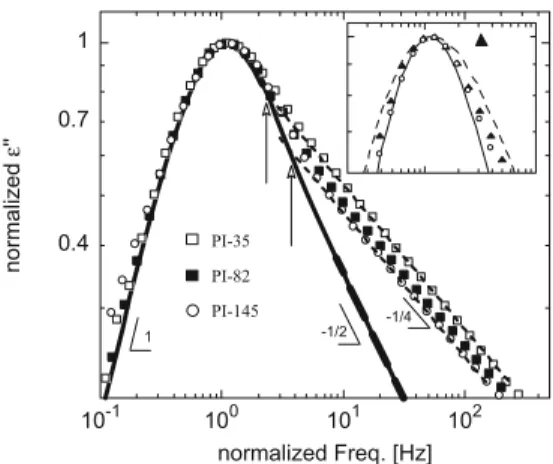
Figure 5 shows the direct comparison between the experimental data for some of the samples investi-gated (symbols) having all of them the lowest available polydispersity index (∼1.05) and the pure reptation theory prediction (solid line). Both vertical and hor-izontal scaling factors have been applied to obtain a good matching of the peaks. It should be noted that the possible conductivity contributions to the normal mode relaxation were subtracted. The inset shows sep-arately the data of the highest molecular weight sample because it has a markedly broader molecular weight distribution (polydispersity index 1.14).
0.4 0.7 1 10-1 100 101 102 PI-35 PI-82 PI-145 n o rma lize d ε '' normalized Freq. [Hz] 1 -1/2 -1/4
Fig. 5 Comparison of the BDS data of high molecular weight
(symbols) with pure reptation theory (solid line). Dashed straight
lineshowing the 1/4 power law behavior of the samples with PI 35 and PI 145 are also shown. The vertical arrows indicate the crossover frequency between both regimes. The inset presents for comparison the highest molecular weight data (PI 320) with a high polydispersity (1.14) with that of smaller polydispersity (1.04). The dashed line represents what would be the reptation theory expectation when a very crude approximation is used to account the effect of the molecular weight (see text)
From Fig. 5, it becomes apparent that in the high frequency side of the loss, peak deviations from the rep-tation predictions on the end-to-end vector fluctuations persist even for the highest molecular weight investi-gated. Whereas the high frequency behavior expected from the reptation theory is a power law with exponent −1/2, the experimental data present and exponent −1/4 (see Fig.5), which would be a signature of the relevance of chain contour length fluctuations at least in this high frequency side of the normal mode relaxation. Nevertheless, it is also clear that the range of these deviations reduce when increasing molecular weight. The vertical arrows in Fig. 5 show that a factor of 5 increasing in molecular weight makes the crossover frequency to increase in a factor of about 2. By inspec-tion of the rheological data reported by Abdel-Goad et al. (2004), it is also apparent that in the very high molecular weight range where the viscosity scales as predicted by reptation theory, the terminal relaxation is far from being properly described by this theory.
Eventually, the normal mode description by the pure reptation theory could be obtained only at extremely higher molecular weights, for which, as aforemen-tioned, the dielectric experiments will not be suitable for investigating the extremely slow chain dynamics. Concerning this, it has been shown (McLeish2002) that for polyethylene, the frequency dependence of the loss shear modulus verifies the reptation prediction only for a molecular weight as high as of 800 kg/mol, which for this polymer corresponds to about 400 times Me,
i.e., it would correspond to about 3,000 kg/mol for PI. Taking the above-calculated shift of the crossover fre-quency into account, for this limiting molecular weight, the crossover frequency would occur at around 20 Hz, and the failure of the repetition theory description would be hardly detectable by using the same scale as in Fig.5.
Figure5also shows that both the maximum and the low frequency side of the loss peak are well accounted by the reptation theory without any evident deviation, except for the sample having a broader distribution of molecular weight, which shows a distinctly broader normal mode peak (see inset of Fig.5). This compar-ison evidences that the molecular weight distribution have a noticeable effect on the normal mode spectrum shape. The effect of the molecular weight distribution on the normal mode was properly accounted for in an unentangled PI sample (Riedel et al. 2009) by as-suming that the contributions from chains in the sam-ple with distinct molecular weight simply superimpose. When we tried the same approach with the higher molecular weight samples (dashed line in the inset of Fig.5), it becomes evident that the situation for well-entangled polymers is different. Even by using the smallest polydispersity (1.04), the calculated response overestimates by far the broadening of the peak for the sample with highest polydispersity (1.14). Thus, for highly entangled polymers, the effect of the molecular weight distribution on the normal mode is less evident than that observed in the unentangled polymer case. In fact, the complete disentanglement of a chain involves also the motions of the chains around, which would have a different molecular weight, being, therefore, the resulting time scale some kind of average of those corresponding to the ideally monodisperse melts. As a result, the longest relaxation time in highly entan-gled melts should not depend greatly on the molecular weight distribution, provided it is not very broad.
Conclusion
BDS experiments on PI have allowed us to detect two crossovers in the molecular weight dependence of the end-to-end relaxation time. The first corresponds to the crossover from the range where the Rouse the-ory is applicable to the entangled limited range, being the crossover molecular weight 6.5 ± 0.5 kg/mol, i.e., slightly above the molecular weight between
entangle-ments. The crossover from the intermediate range to the behavior predicted by the pure reptation theory is found at around 75 ± 10 kg/mol, which corresponds to 15 times the molecular weight between entanglements. Despite of the fact that the reptation theory is able to describe the molecular weight dependence of the slowest relaxation time for these high molecular weight samples, the shape of the normal mode spectrum is still markedly different from that expected by this theory. Eventually, only at a much higher molecular weight (hundred times the molecular weight between entanglements) the reptation theory could completely describe the normal mode relaxation associate to the chain dynamics. Unfortunately, dielectric experiments in this range are not feasible.
References
Abdel-Goad M, Pyckhout-Hintzen W et al (2004) Rheological properties of 1,4-polyisoprene over a large molecular weight range. Macromolecules 37:8135
Adachi K, Kotaka T (1993) Dielectric normal mode relaxation. Prog Polym Sci 18:585
Boese D, Kremer F (1990) Molecular dynamics in bulk cis-polyisoprene as studied by dielectric spectroscopy. Macro-molecules 23(3):829
de Gennes PG (1971) Reptation of a polymer chain in the pres-ence of fixed obstacles. J Chem Phys 55(2):572
Ding Y, Sokolov AP (2006) Breakdown of time-temperature superposition principle and the universality of chain relax-ation. Macromolecules 39:3322
Doi M, Edwards SF (1986) The theory of polymer dynamics. Clarendon, Oxford
Ferry JD (1980) Viscoelastic properties of polymers. Wiley, Hoboken
McLeish TCB (2002) Tube theory of entangled polymer dynam-ics. Adv Phys 51:1379
Riedel C, Alegría A, Tordjeman P, Colmenero J (2009) Rouse-model-based description of the dielectric relaxation of nonentangled linear 1,4-cis-polyisoprene. Macromolecules 42:8492
Rouse PE Jr (1953) A theory of the viscoelastic properties of dilute solution of coiling solution. J Chem Phys 21:1272 Viovy JL, Rubinstein M et al (2002) Constraint release in
poly-mer melts: tube reorganization versus tube dilation. Macro-molecules 24:3587
Watanabe H (2001) Dielectric relaxation of type-a polymers in melts and solutions. Macromol Rapid Commun 22:127 Watanabe H, Matsumiya Y, Inoue T (2002) Dielectric and
vis-coelastic relaxation of highly entangled star polyisoprene: quantitative test of tube dilation model. Macromolecules 35:2339
Yasuo I, Keiichiro A et al (1988) Further investigation of the dielectric normal mode process in undiluted cis-polyisoprene with narrow distribution of molecular weight. J Chem Phys 89:7585
![Table 1 Microstructure of the samples investigated in this work Sample code M n [kg/mol] M w [kg/mol] I p T g [K]]](https://thumb-eu.123doks.com/thumbv2/123doknet/14361227.502665/4.892.460.817.892.1029/table-microstructure-samples-investigated-work-sample-code-mol.webp)