ACCEPTED MANUSCRIPT
Effects of antihistamines on the H295R steroidogenesis –
au-tocrine up-regulation following 3β-HSD inhibition
Cecilie Hurup Munkboel
1, Stine Bjerregaard Hasselstrøm
1, David Møbjerg
Kristensen
2-3, Bjarne Styrishave
1*
1
: Toxicology Laboratory, Department of Pharmacy, Faculty of Health and Medical Sciences,
University of Copenhagen, DK- 2100 OE, Copenhagen, Denmark
2
: Novo Nordisk Center for Protein Research, Faculty of Health and Medical Sciences,
Univer-sity of Copenhagen, Denmark
3
: Inserm (Institut national de la santé et de la recherche médicale), Irset - Inserm UMR 1085,
9 Avenue du Professeur Léon Bernard, 35000 Rennes, France.
*: Corresponding author: Bjarne.styrishave@sund.ku.dk
Key words: cetirizine, fexofenadine, in vitro, promethazine, steroid hormones, qPCR, Steroidogenesis.
ACCEPTED MANUSCRIPT
Abstract
Millions of people of all ages suffer from allergies worldwide and as a consequence antihistamines are among the most commonly prescribed pharmaceuticals in the world. We investigated the disrup-tive effects of three antihistamines, promethazine (PMZ), cetirizine (CET) and fexofenadine (FEX) on the H295R steroidogenesis. A multi-steroid LC-MS/MS method was used to quantify 13 steroid hor-mones in the steroidogenesis. In addition, real-time RT-PCR was used to determine if exposure to antihistamines altered gene expression in the cell line. When exposing the H295R cells to PMZ and CET, significant increases in Δ5-steroids and significant decreases in Δ4-steroids were observed, indi-cating an inhibition of 3β-hydroxysteroid dehydrogenase (3β-HSD). A sequential decrease in cortico-steroids, androgens and estrogens were also observed. Overall, FEX had no effect on the steroido-genesis even though minor effects were observed at the highest concentrations. Real-time RT-PCR showed that PMZ resulted in regulation of 3β-HSD and 17β-HSD, whereas CET only resulted in up-regulation of 3β-HSD. This indicated that the decrease in steroids downstream from 3β-HSD follow-ing PMZ and CT exposure induced a compensatory autocrine response in 3β-HSD gene expression. The effects on the steroidogenesis were observed at concentrations 30-50 times higher than the therapeutic plasma concentrations. However, antihistamines are lipophilic and may accumulate in adrenals and gonads. Thus, disruptive effects of PMZ and CET on human steroidogenesis cannot be excluded.
ACCEPTED MANUSCRIPT
1.
Introduction
About 400 million people of all ages suffer from allergies and antihistamines are among the most commonly prescribed pharmaceuticals in the world (Jones, 2016; Mahdy and Webster, 2011). The sold amount of antihistamines for systemic use has generally increased and many individuals seek medical care to get the right treatment while many others treat themselves with over-the-counter medication (Portnoy and Dinakar, 2004).
Histamine is the primary mediator in allergic reactions and has been extensively studied (Mahdy and Webster, 2011). Allergic reactions are promoted when the immune system overreacts to an other-wise harmless substance. Allergens trigger a complex chain reaction including the release of hista-mine and other mediators into the bloodstream, where histahista-mine is transported throughout the body and exerts its effect through four types of receptors, named H1, H2, H3 and H4 receptors,
local-ized in peripheral and central nerve system with the effect mediated through H1 receptors being the
most important (Jones, 2016; Simons and Simons, 2008). Antihistamines are useful in relieving un-pleasant allergic reactions by preventing histamine-mediated effects (Jones, 2016). H1 antihistamines
prevent the effects mediated through histamine at H1 receptors by acting as inverse agonists
combin-ing and stabilizcombin-ing the inactive conformation of the receptors (Mahdy and Webster, 2011; Simons and Simons, 2008).
H1 antihistamines are divided into two groups; first- and second generation antihistamines, and these
are also referred to as sedating and non-sedating antihistamines. Second generation antihistamines are the newest drugs on the market compared to the first generation antihistamines and they are mostly devoid of these sedative effects (Church and Maurer, 2014). Promethazine (PMZ), cetirizine (CET), and fexofenadine (FEX) are three widely used antihistamines. Promethazine is the most widely used first generation antihistamine, whereas CET and FEX are the two most widely used second gen-eration antihistamines in Denmark (Sundhedsdatastyrelsen, 2016).
Promathazine is non-selective in binding to H1 receptors and has pronounced anticholinergic effect.
Due to this, PMZ is used to treat insomnia, motion sickness and nausea but also to some extent aller-gic disorders and as an antiemetic drug in pregnancy (Borowiecki, 2015; Danish Medicines Agency, 2016). In contrast, CET is potent and selective in binding to the H1 receptor, and initially identified as
a major active carboxylic acid metabolite of the first generation antihistamine hydroxyzine with anti-cholinergic and sedative properties (Chen, 2008; Portnoy and Dinakar, 2004). Due to its selectivity, it is used in the treatment of allergic disorders as an orally given over-the-counter drug. Like CET, FEX
ACCEPTED MANUSCRIPT
is highly selective for the H1 receptor and is identified as the carboxylic acid metabolite of
terfena-dine (Simpson and Jarvis, 2000). Fexofenaterfena-dine is used in the treatment of allergic disorders due to the selectivity, and in Denmark it is an orally given drug, which is handed as over-the-counter in 120 mg and with prescription in 180 mg (Danish Medicines Agency, 2016).
Since antihistamines are widely used by the general population, including children, teenagers, preg-nant women, men and women of reproductive age, it is very relevant to investigate any endocrine effects that these drugs may have.
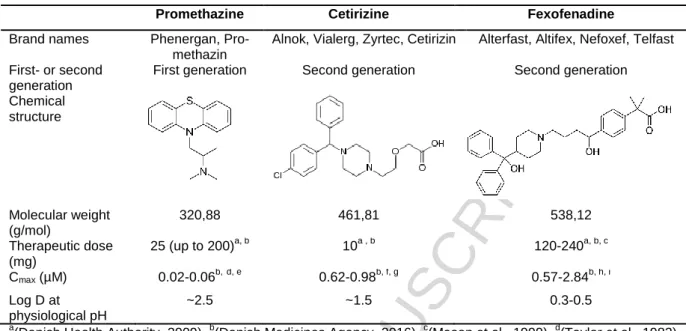
The purpose of this study was to investigate the potential disruptive effects of the three antihista-mines PMZ, CET and FEX on steroid synthesis. The in vitro H295R steroidogenesis assay was used to investigate any effects on the steroid hormone synthesis, using liquid chromatography-tandem mass spectrometry (LC-MS/MS). In addition to the results obtained from the H295R steroidogenesis assay, real-time RT-PCR was used to investigate any effects on the gene expression of the enzymes in the steroidogenesis. Table 1 gives an overview of the three studied antihistamines and some of their relevant physiochemical properties.
2. Materials and Methods
The H295R cells were cultured following a specific protocol according to the OECD guideline (OECD, 2011). Cells were started from frozen stock and transferred to a 75 cm2 culture flask. Cultivation was conducted in the incubator at 37 °C with 5% CO2 atmosphere. Cells were placed in 15-20 mL
supple-mented medium consisting of Dulbecco’s Modified Eagle’s Medium and Ham’s F-12 Nutrient mixture (DMEM/F12) medium supplemented with 2.5% Nu-Serum and 1% ITS+Premix. The medium was re-newed 2-3 times per week. Every 5-7 days, when the cell confluence was approximately 85-90%, the cells were sub-cultivated. Cells in passages 4-13° were used in the experiments (OECD, 2011).
Preparation of test compounds
Stocks solutions and serial dilutions were prepared prior to conducting the assay. All test compounds were dissolved in 100% dimethyl sulfoxide (DMSO) as recommended in the guideline (OECD, 2011). A maximum of 0.5% DMSO was used in the wells. Both PMZ and CET had final concentrations of 0.1% DMSO. FEX was tested both in 0.1% and 0.5%. The drugs were tested in the following concentrations: PMZ: 0, 0.10, 0.31, 1, 3.14, 10, 31.4, 50, 62.8 and 100 µM; CET: 0, 0.10, 0.31, 1, 3.14, 10, 31.4, 100, 200, 314 and 500 µM; FEX: 0, 0.10, 0.31, 1, 3.14, 10, 31.4, 50, 100, 157, 250, 500 and 2500 µM.
ACCEPTED MANUSCRIPT
The H295R steroidogenesis assay
The H295R steroidogenesis assay was conducted in accordance to the OECD (2011) guideline with minor modifications according to Sørensen et al (2016) and Hansen et al (2017). The assay was per-formed in 24-well culture plates. Prior to initiating the assay cells were visually inspected with re-spect to morphology and attachment to confirm suitable cell conditions. The cells were seeded in plates with a cell density of 3 x 10⁵ in each well. Nu-Serum was omitted from the growth media in the assay due to its background levels of steroids, especially TS. Removing the Nu-Serum did not affect cell growth. The seeded plates were incubated at 37 °C under 5% CO2 atmosphere. After 24 hours the
cell medium was renewed, and the cells were exposed to test compound in seven different concen-trations and to a solvent control (SC) by adding 1 µL of the appropriate solution, all in triplicates. The plates were returned to the incubator at 37 °C and 5% CO2. After 48 hours cell condition and signs of
cytotoxicity were investigated under microscope. 950 µL cell medium from each well was transferred to eppendorf tubes, which were stored at -20 °C for later hormone analysis.
Quality control
For every experiment the H295R cell performance was verified by running a quality control (QC) plate in parallel in accordance with the guideline (OECD, 2011). On the QC plates, the H295R cells were exposed to cell media (blank, n = 6), 0.1% DMSO in cell media (SC, n = 6), and a positive and negative control. As positive control a known inducer, forskolin (FOR), was used in concentrations 1 and 10 µM, and as negative control a known inhibitor, prochloraz (PROC) was used in the concentrations 0.1 and 1 µM (n = 3, for each test concentration) (OECD, 2011).
Cell viability assay
Cell viability assay was performed at each concentration (OECD, 2011). After 48 hours every well was visually inspected for any signs of cytotoxicity. After removal of 950 µL cell medium, new 750 µL me-dium and 200 µL resazurin were added to conduct the cell viability assay. Plates were incubated at 37 °C and 5% CO2 for 3 hours. Afterwards the fluorescence from the formed resorufin was measured at
excitation and emission wavelengths of 560 and 590 nm, respectively using a Wallac Envision 2100 multilabel reader. The formation of resorufin is directly correlated with the number of living cells (O'Brien et al., 2000). Expression of cell viability was calculated relative to the average response in SCs (OECD, 2011). If the cell viability was lower than 80%, the specific wells were excluded in the final data analysis. No positive control was used since methanol (MeOH) was not added to three blanks and SCs. The two highest concentrations of PMZ (62.8 and 100 µM) and CET (314 and 500 µM), and
ACCEPTED MANUSCRIPT
the highest concentration of FEX (2500 µM) resulted in a viability lower than 80% and consequently were excluded from further analysis.
Steroid extraction, cleanup and LC-MS/MS analysis
Steroids were extracted and analysed according to Weisser et al. (2016). To each eppendorf tube containing 950 µL cell medium 50 µL of 0.1 µg/mL internal standard solution containing deuterated steroid analogues was added. The first protein precipitation was conducted by adding 900 µL ice cold acetonitrile. The tubes were vortexed and frozen for approximately 10 min and afterwards centri-fuged at ~9500 G for 10 min. Supernatant was transferred to glass tubes and evaporated under a gentle stream of nitrogen at 60 °C until ~1 mL left. A second protein precipitation was conducted by adding 900 µL ice cold 100% MeOH. The glass tubes were then vortexed and frozen for another 10 min and centrifuged at ~1500 G for 10 min. Supernatant was transferred to 1.5 mL LC-vials and evap-orated under a gentle stream of nitrogen at 60 °C until ~0.5 mL left (Weisser et al., 2016). Finally, milli-Q water was added up to 1.0 mL.
Online clean-up Liquid Chromatography (LC) followed by mass spectrometry (MS) was used to quan-tify steroid hormones (Weisser et al., 2016). A binary 1100 Agilent HPLC pump and a binary 1290 Agilent Infinity Series system were used in combination for online clean-up and chromatographic separation of all steroid hormones. The system contained an autosampler at 7 °C, an in-line filter (1290 infinity in-line filter, Agilent), a TTC switching valve with 6 ports in two positions (left and right), and two columns; C18 enrichment column (µbondapak® C18, 3.9× 20 mm, 10 μm, Waters) and C18 analytical column (Kinetex, 2.6 µm C18 100 A, 75 x 2.1 mm, Phenomenex, USA). The enrichment
col-umn was connected to the autosampler through the TTC switching valve. In front of the analytical column a guard column (C18, 2.1 mm, Phenomenex, USA) was placed, and they were connected to
the TTC switching valve and a MS switching valve. To the TCC switching valve a 1290 pump was con-nected (Weisser et al., 2016). A mass spectrometer (AB SCIEX 4500 QTRAP) was used for detection, provided with an atmospheric pressure chemical ionization Turbo V source. Total run time in total was 16 min. LC and MS data were conducted using Analyst v. 1.6.2 software package (AB SCIEX). Fur-ther details including quality criteria and method validation is found in Weisser et al. (2016).
Quantitative RT-PCR
ACCEPTED MANUSCRIPT
After carefully removal of 950 µL medium from the 24-well culture plates, 300 µL of trizol was added to the wells to lyse the cells directly. The wells were scraped with the trizol-pipette tip and pipetted up and down several times until cells appeared lysed. Lysate was then added to a new eppendorf tube and the procedure was repeated. Samples were stored at -80 °C.
RNA isolation
RNA was isolated from 12 samples (3 concentrations and 1 SC, three replicates for each) from each test compound (24 samples in total) based on results from the H295R steroidogenesis assay. For PMZ, concentrations of 0, 0.01, 3.14 and 31.4 µM, and for CET concentrations of 0, 1, 31.4 and 200 µM were chosen. Samples were thawed and vortexed. 0.2 mL chloroform was added and samples were vortexed. Samples were centrifuged at 4 °C and 15000 G for 20-60 min, and the upper trans-parent phase was transferred to new 1.5 mL tubes. An equal volume (0.2 mL) of 2-propanol was add-ed, samples were vortexadd-ed, and left for 10 min. Samples were centrifuged at 4 °C and 15000 G for 30-60 min. The supernatant was removed and collected without removing any RNA pellets, samples were centrifuged again for 3 min and the last traces of supernatant was removed. To the RNA pellets, 0.5 mL of ice cold 75% ethanol was added, and the tubes were inverted until pellets were freely float-ing. Samples were centrifuged for 20-60 min followed by removal and collection of supernatant without removing any RNA pellets. The samples were centrifuged again for 3 min and the last traces of ethanol were removed. The tubes were left open on bench for approximately 20 min allowing the remaining ethanol to evaporate. 20 µL DEPC-treated water was then added and samples were vor-texed and placed at -80 °C.
On NanoDrop 1000 the sample type RNA-40 was selected. 1 µL sample was added to the pedestal without any air bubbles. The absorbance of RNA samples were measured at 260 and 280 nm and the 260/280 and 260/230 ratios were calculated. The pedestals were wiped off after each measurement to avoid “carry-over” contamination. As a reference 1 µL of DEPC-treated water was used. The RNA concentrations were estimated using the A260 value and a standard with an A260 of 1 that was
equiva-lent to 40 µg RNA/mL.
cDNA preparation
A final RNA concentration of 0.5 µg and a total volume of 15 µL were chosen. cDNA synthesis mix used according to the manufacturer, was prepared for 25 samples (24 samples + 1 extra) with 5 *
ACCEPTED MANUSCRIPT
TransAmp Buffer (4 µL x 25) and Reverse Transcriptase (RT) (1 µL x 25). The TransAmp Buffer and RT were vortexed and centrifuged before use. The cDNA synthesis mix was mixed gently by pipetting up and down and 5 µL cDNA synthesis mix was added to each sample followed by DEPC-treated water and RNA as calculated. A No RT as negative control was prepared as follows: 4 µL 5 * TransAmp Buff-er, 4 µL PMZ C1 and 12 µL DEPC-treated water. The following program was used: 25 °C for 10 min (primer annealing), 42 °C for 15 min (reverse transcription), 85 °C for 5 min (inactivation) and chill on ice. Samples were centrifuged at 4 °C and 15000 G for 3 min, then diluted with 20 µL DEPC-treated water and frozen at -80 °C.
Quantitative RT-PCR analysis
Real-time RT-PCR was performed on two genes of interest (3β-HSD and 17β-HSD) and one house-keeping gene (TfB2M) (Ndossi et al., 2012). Primer sequences of 3β-HSD and 17β-HSD were obtained from Hilscherova et al. (2004) and synthesized by Tag Copenhagen. Two plates were designed and the needed amount of master mix associated to each gene was calculated. All samples were deter-mined in technical duplicates. For each sample, the master mix was prepared as follows: 2 x Sensi-FAST SYBR Lo-ROX mix (10 µL), 10 µM forward primer (0.8 µL), 10 µM reverse primer (0.8 µL) and DEPC-treated water (6.4 µL). To each well on the plate 18 µL of respective master mix was added together with 2 µL of diluted cDNA. The plate was sealed and centrifuged for 30 sec at 6-700 G. The plate was placed in the Mx3005P instrument, and the thermal cycling program included segment 1 (1 cycle), 2 (40 cycles) and 3 (1 cycle). Segment 1: 95 °C for 5 min (initial denaturing). Segment 2: 95 °C for 15 sec (denaturing), 55 °C for 45 sec (primer annealing) and 72 °C for 30 sec (cDNA extension). Segment 3: 95 °C for 1 min, 55 °C for 30 sec and 95 °C for 30 sec. Melting curve analyses were per-formed immediately after the final PCR cycle to differentiate between desired amplicons and any contaminants.
Data processing and statistical analysis
Data obtained from LC-MS/MS were examined using the MultiQuantTM 3.0 Software. Chromatograms from all samples were inspected and peaks were manually integrated if necessary. Afterwards, the raw data were transferred and processed in Microsoft Excel. All steroid hormone concentrations were normalized relative to the mean SC value of each plate to account for interplate variability. All data were analysed using GraphPad Prism 6. All data sets of each steroid hormone were gathered
ACCEPTED MANUSCRIPT
and a Grubb’s test for outliers was used to remove outliers. Data were plotted as the relative steroid hormone concentrations compared to SC as a function of increasing test concentrations. All data were expressed as mean ± standard error of mean (SEM). One-way analysis of variance (ANOVA) followed by Dunnett’s multiple comparison test was performed to test if responses from test concen-trations were significantly different from the SC response. Differences were considered significant at p ≤ 0.05.
For quantification of results from RT-PCR, the threshold cycle (Ct) was determined for each reaction.
The Ct value for the gene of interest was normalized to the TfB2M gene by division producing ΔCt.
The difference between ΔCt values for the exposed and the control (ΔΔCt) represented the degree of
induction or inhibition of the gene of interest. Data were statistically analyzed as fold induction be-tween exposed and control samples. Statistically analyses of differences in gene expression were assessed by ANOVA followed by Dunnett’s multiple comparison test. A p ≤ 0.05 was considered as significant.
3. Results
Promethazine
Changes in the production of steroid hormones in the steroidogenesis after exposing the H295R cells to the three selected drugs are presented in Figure 1 (n = 3–12). Exposing the H295R cells to PMZ resulted in significantly changes in all steroid hormones compared to SC. The Δ5-hydroxysteroids (mainly PREG and OH-PREG) displayed around 200% increase in concentrations relative to the SC. Consequently, a decrease in the concentrations of Δ4-hydroxysteroids (PROG, OH-PROG, AN, and TS) relative to the SC was seen. The increase in concentrations of PREG and OH-PREG was significant at concentrations ≥ 31.4 µM (p < 0.0001) and ≥ 10 µM (p < 0.05 at 10 µM and 0.0001 at remaining con-centrations), respectively. The increase in DHEA concentrations was significant at concentrations 10 and 31.4 µM (p < 0.05 and 0.001) but not at the highest concentration. DHEA increased up to around 135% relative to the SC. The decrease in PROG and OH-PROG concentrations was significant at con-centrations 50 µM (p < 0.0001) and ≥ 31.4 µM (p < 0.0001), respectively. For AN and TS the decrease was significant at concentrations ≥ 3.14 µM (p < 0.05 at 3.14 µM and 0.0001 at remaining concentra-tions) and ≥ 10 µM (p < 0.0001), respectively. All Δ4-hydroxysteroids decreased relative to SC.
ACCEPTED MANUSCRIPT
The estrogens decreased in concentrations ≥ 31.4 µM (p < 0.05 and 0.0001 for E1, and 0.01 and 0.0001 for β-E2). A significant decrease was also observed in the corticosteroids except for 11-deoxy COS with significance levels between 0.0001-0.05. The decrease in corticosteroid concentrations relative to SC ranged from 20-70%. The concentration at the lowest observed effect was approxi-mately 3.14 µM, which was above the Cmax of 0.06 µM. using TS as end point and calculating a margin
of safety (MoS) as NOAEL/Cmax, the MoS for PMZ will be approximately 52.
Due to increasing Δ5-hydroxysteroids and decreasing Δ4-hydroxysteroids, the ratio between 3β-HSD products and substrates were calculated (Figure 2). Any difference in the decrease of AN to TS and E1 to β-E2 was also determined by calculating the ratio between 17β-HSD products and substrates. In this plot, a ratio higher than control (ratio = 1) indicates a stimulation of the enzyme whereas a ratio lower than 1 indicates an inhibition. The ratio of 3β-HSD was significantly lower than control samples at concentrations ≥ 10 µM (p < 0.0001), indicating an inhibition of the enzyme, whereas no significant effect was observed for 17β-HSD.
Cetirizine
The effects of CET on the H295R steroidogenesis were similar to that of PMZ (Figure 1). The Δ5 -hydroxysteroids (PREG, OH-PREG and DHEA) displayed an increase in concentrations relative to the SC. The increase in PREG concentrations was significant at concentration 200 µM (p < 0.01), whereas the increase in OH-PREG and DHEA concentrations was significant at concentrations ≥ 100 µM (p < 0.0001) with increases from 120-135% relative to the SC. Consequently, the Δ4-hydroxysteroids (PROG, OH-PROG, AN, and TS) displayed a decrease in concentrations relative to the SC. For PROG the increase was not significant. The decrease in OH PROG and AN concentrations was significant at concentrations ≥ 100 µM (p < 0.01-0.0001 for OH-PROG and 0.0001 for AN). TS concentrations were significantly decreased around 40% at concentrations ≥ 1 µM (p < 0.0001) No significant decrease was observed for the estrogens even though β-E2 concentrations were observed to slightly decrease. The corticosteroids showed a significant decrease except for 11-deoxy COS. The decrease in 11-deoxy COR, COR and CORNE concentrations was significant at concentrations ≥ 100 µM (p < 0.0001 for 11-deoxy COR, p < 0.01 for COR, and p < 0.001-0.0001 for CORNE), ranging from 50-75% relative to SC. The concentration at the lowest observed effect was approximately 31.4 µM, which was above the Cmax of 0.98 µM.
ACCEPTED MANUSCRIPT
The ratio between increased Δ5-hydroxysteroids and decreased Δ4-hydroxysteroids, is illustrated in Figure 2. The inhibition of 3β-HSD was significant at concentrations ≥ 31.4 µM (p < 0.05 at 31.4 µM and 0.0001 at 100-200 µM). The changes in the ratio between 17β-HSD products (E1 and β-E2) and substrates (AN and TS) are also shown in Figure 2. The decrease in the ratio, indicating an inhibition of the 17β-HSD, was significant in concentrations ≥ 10 µM (p < 0.05 at 10 µM, 0.01 at 31.4 and 200 µM and 0.0001 at 100 µM).
Fexofenadine
Results from exposing the H295R cells to FEX are presented in Figure 1 (n = 3–12). FEX did not show a clear change in the steroid hormone productions even at high concentrations. For most steroid hor-mones, production remained around 100% compared to SCs. PREG showed minor but significant decrease at concentrations ≥ 157 µM (p < 0.0001 at 157 µM and p < 0.01 at 250 and 500 µM), PROG concentrations were not significantly different, and OH-PREG and OH-PROG concentrations were only significantly different at concentrations 157-250 µM (p < 0.01) and concentration 250 µM (p < 0.05), respectively. All androgens (DHEA, AN and TS) were significantly different in concentrations ≥ 157 µM (p < 0.05-0.0001). No significantly difference was observed for the two estrogens. All cortico-steroids showed minor but significant differences. Concentrations of 11-deoxy COS and 11-deoxy COR were significant at concentration 500 µM (p < 0.01) and ≥ 157 µM (p < 0.01-0.0001), respective-ly. The Cmax range from 0.57-2.84 µM. This is approximately 35 times lower than the concentrations
for the observed changes.
Quantitative RT-PCR
The results from the H295R experiments indicated potential effects on the HSDs, in particular the 3β-HSD during PMZ and CET exposure. Consequently, we investigated the effects of PMZ and CET on gene expression of 3β-HSD and 17β-HSD (Figure 3). Exposing the H295R cells to PMZ resulted in no significant differences in expression of 3β-HSD in concentrations 0.01 and 3.14 µM normalized to TfB2M. However, PMZ concentration 31.4 µM resulted in a significant 1.5-fold increase in expression of 3β-HSD (p < 0.01). The same tendency was observed for 17β-HSD. No significant differences in expression of 17β-HSD were seen in PMZ concentrations 0.01 and 3.14 µM but PMZ concentration 31.4 µM resulted in a minor, yet significant 1.2-fold increase in expression of 17β-HSD (p < 0.05).
ACCEPTED MANUSCRIPT
The H295R cell exposure to CET resulted in a significant increase in expression of 3β-HSD in all three concentrations normalized to TfB2M (p < 0.01 at 1 and 31.4 µM and p < 0.001 at 200 µM) with the highest dose increasing approximately 2.2-fold. Exposure of H295R cells to CET did not significantly affect the expression of 17β-HSD.
4. Discussion
When exposing the H295R cells to PMZ and CET, a clear significant inhibition of 3β-HSD was ob-served. We have been unable to identify studies confirming these observations and generally the effects of H1 antihistamines on the steroidogenesis are not well investigated. Effects on HSDs rather
than the steroidogenic CYP enzymes are not commonly observed, but since HSD play a crucial role in the steroidogenesis, it is an important target (Sanderson, 2006). Previously, other 3β-HSD inhibitors such as isoflavone derivatives (e.g. genistein and daidzein) have been investigated in the H295R cell line (Nielsen et al., 2012; Ohno et al., 2002). A study by Kaminska et al. (2014) and previous investiga-tions showed that genistein and daidzein suppressed the activity of 3β-HSD in adrenocortical cells rather than altering gene expression (Kaminska et al., 2014; Ohno et al., 2002). The degree of inhibi-tion was found to relate to steric conformainhibi-tion in the ring-structures but also electron affinity in the active site of the enzyme (Kaminska et al., 2014; Ohno et al., 2004).
Non-steroidal HSD inhibitors such as pyridine derivatives have been identified (Braun et al., 2016). Three flexible ring-structures in close proximity and one or more acidic hydroxyl groups, stabilizing interactions through an extensive H-bonding network (Braun et al., 2016), characterize the interac-tions between pyridine derivatives and the active site in 17β-HSD. The drugs investigated in the pre-sent study do not have acidic hydroxyl groups. They do, however, contain 3 ring structures, the ones in cetirizine being very flexible, allowing free rotation. Promethazine did not seem to inhibit 17β-HSD. However, this may be due to upstream inhibition of 3β-HSD, which caused depletion of the precursor AN. The steroidogenesis is a sequential pathway and the inhibition of 3β-HSD could poten-tially mask other effects of PMZ further down the pathway (Harvey and Everett, 2003; Nielsen et al., 2012). Computational modelling should be conducted to investigate any potential interactions be-tween these drugs and the active site of the HSDs involved in the steroidogenesis.
The tricyclic structure of PMZ is similar in structure to tricyclic antidepressants (TCAs) such as ami-triptyline, which is known to inhibit the steroidogenesis by affecting the HPA axis, where it decreases levels of basal ACTH and corticosteroids such as CORNE (Reul et al., 1993). Another second
genera-ACCEPTED MANUSCRIPT
tion H1 antihistamine with a structure similar to TCAs is loratadine, an over-the-counter second
gen-eration H1 antihistamine. Källen and Olausson (2001) found a correlation between exposure to
lo-ratadine and hypospadias. Furthermore, lolo-ratadine was reported to exert estrogen-like effects and disrupt penile development in mice resulting in offspring with hypospadias, when administered dos-es of 1 and 3 mg/kg/day (Willingham et al., 2006), although McIntyre et al (2003) found no correla-tion between perinatal loratadine exposure and hypospadias in male rats. The tricyclic structure of PMZ and similar drugs could potentially interact with steroids metabolizing enzymes such as HSDs. This aspect needs to be investigated further.
Significant up-regulations in gene expression of both 3β-HSD and 17β-HSD were observed at PMZ concentration of 31.4 µM. An even more pronounced up-regulation in 3β-HSD gene expression was also observed for CET. This up-regulated gene expression could be due to the capacity of the H295R cells to compensate for decreased productions of steroid hormones caused by altered enzyme activi-ties. Hence, results from other studies on H295R cells have shown that the cells have the capacity to mount auto-regulatory responses (Rainey et al., 1993; Sanderson et al., 2002; Staels et al., 1993). A decrease in steroid hormone may exert negative feedback and increase the signaling through the cAMP pathway, inducing gene expressions and formation of steroid hormones (Houk et al., 2004). Through this negative feedback, steroid hormones may regulate their own production and the cells may maintain steroid levels to some extent, at the expense of slightly higher enzyme levels. For ex-ample, TS appears to be able to inhibit its own production by inhibiting StAR expression in Leydig cells in vitro and in vivo (Houk et al., 2004). Auto-regulatory responses may therefore play a role in the observed effects seen in the H295R steroidogenesis assay and may have compensated for some of the effects of PMZ and CET. Since the decrease in androgens, estrogens and corticosteroids could be due to sequential depletion from upstream inhibition of 3β-HSD, the autocrine compensation may be mainly directed towards the 3β-HSD and only to a lesser extend towards other enzymes such as 17β-HSD as indicated by the data presented in Figures 2 and 3.
The no observed adverse effect level (NOAEL) for PMZ in the present study was 3.14 µM, using TS as endpoint. This concentration is around 50 times higher than the highest Cmax at 0.06 µM. This
indi-cates that the effects on the steroidogenesis during treatment may be limited.
Using TS as endpoint, the NOAEL for CET was 1 µM, which corresponds to Cmax at 0.98 µM. However,
the decrease in TS levels was significant at much lower concentrations than other steroids with a NOAEL around 31.4 μM, which seems more realistic. A realistic Margin of Safety, defined as
NO-ACCEPTED MANUSCRIPT
AEL/Cmax would then be around 30, indicating low risk of endocrine effects during CET exposure,
alt-hough the ability of adrenals and gonads to accumulate CET should be taken into account.
A difference in inhibition of 3β-HSD downward the Δ4/Δ5 pathway was observed in the steroidogene-sis, where a greater accumulation of both PREG and OH PREG compared to DHEA was seen. Conse-quently, for both PMZ and CET, there was a tendency towards lower 3β-HSD inhibition of the PREG transformation compared to that of the OH-PREG and DHEA transformations. This could be due to the difference in substrate affinities observed in studies by Fan and Troen (1975) and Byrne et al. (1985) allowing PMZ and CET to outcompete PREG easier than DHEA.
Exposing the H295R cells to FEX resulted only in minor but significant changes in the steroid hormone productions, which did not seem to follow any general pattern. The nitrogen-containing ring struc-ture with one nitrogen connected to a cyclohexane ring and the hydrophilic property at physiological pH may not be sufficient to alter any enzyme activities, and it indicates that FEX may not fit into the active site. Furthermore, FEX is relatively water soluble (LogKow = 0.3-0.5), with much lower LogKow values compared to that of the natural substrates, i.e. steroid hormones (LogKow = 1.08-3.87). This may significantly decrease the ability of FEX to bind in the lipophilic pockets of the CYP and HSD en-zymes involved in the steroidogenesis.
A study by Nicolas et al. (1999) investigated the ability of several second generation antihistamines to inhibit human liver CYP microsomes. The study included terfenadine, the prodrug of fexofenadine. Terfenadine undergoes complete first-pass metabolism in the human liver to form fexofenadine, which accounts for most of the antihistamine effect. Terfenadine showed no inhibitory effect on the investigated CYP enzymes at therapeutic plasma concentrations since the IC50 values were > 20 µM
(Nicolas et al., 1999). Although it is not clear if terfenadine was metabolized into FEX in the study by Nicolas et al (1999) it supports the fact that no obvious effects on steroid hormones were seen in the present study at concentrations lower than 100 μM. The therapeutic index of FEX is very wide and no maximum tolerated dose has been determined (Mason et al., 1999; Russell et al., 1998). Clinical pharmacology studies have tested dose tolerability up to 800 mg as a single oral dose and 690 mg twice daily in healthy subjects without any dose-related effects (Mason et al., 1999). However, daily doses up to 240 mg have been recommended as being safe in relieving symptoms of allergic disor-ders (Mason et al., 1999; Simpson and Jarvis, 2000; Robbins et al., 1998). Comparing the highest Cmax
of 2.84 µM with the minimum 55 times higher NOAEL, it seems less likely that normal doses of FEX would lead to any endocrine disrupting effect on the steroidogenesis.
ACCEPTED MANUSCRIPT
Both PMZ and CET seemed to exert inhibitory effects of HSDs in varying degrees. HSDs play a crucial role in the synthesis and inactivation of all steroid hormones (Penning, 1997), and it is therefore im-portant to clarify if these observations are clinically relevant. Many people suffering from allergies are dependent on antihistamine treatment every day as chronic consumers. In adults, EDCs mainly have effects when presented but exposure during development, childhood and puberty may have permanent effects (UNEP, 2012). Therefore, the decrease in androgens and estrogens after exposure to PMZ and CET could potentially have an influence in these developmental processes. There are still many uncertainties associated with the use of antihistamine during pregnancy but many pregnant women need treatment against allergic reactions, nausea and pruritus (So et al., 2010). None of the antihistamines have been categorized as safe during pregnancy and FDA classifies CET in category B, whereas PMZ and FEX are in category C (Shawky & Seifeldin, 2015). Based on the present study, FEX may be the drug of choice since no effects were seen on steroidogenesis, and no adverse effects in offspring have been reported for FEX (Mason et al., 1999). In contrast to this, other recommends first generation antihistamines during pregnancy as the safest choice (Shawky & Seifeldin, 2015). General-ly, FEX appears to offer the best overall balance of efficacy. FinalGeneral-ly, the lipophilic structure of e.g. PMZ should also be taken into account. The adrenal glands, and other lipid-rich tissues, have the ability to accumulate lipophilic compounds, which may result in much higher PMZ levels in adrenals and gonads, compared to that of the blood. Such a potential accumulation should be investigated in later studies.
5. Conclusion
The potential endocrine disrupting effects of PMZ, CET and FEX was investigated using the H295R steroidogenesis assay and real-time RT-PCR. Both PMZ and CET affected numerous steroid hormones by inhibition of the 3β-HSD enzyme, which resulted in increasing concentrations of Δ5-steroids and decreasing concentrations of Δ4-steroids. As a sequential consequence of the effects on the 3β-HSD enzyme, a decrease was also observed for the remaining steroid hormones including corticosteroids, androgens and estrogens. Overall, FEX did not show any major effect on the steroidogenesis. PMZ and CET caused regulation of 3β-HSD around 1.5-2.2-fold, and PMZ also caused a minor up-regulation of 17β-HSD. This indicates a compensatory autocrine feed-back up-regulation on the gene expression. Based on estimated margins of safety, none of the investigated antihistamines seemed to affect the steroidogenesis in therapeutic plasma concentrations but it cannot be concluded based on these investigations. Further research is needed to clarify if the observed inhibitory effects on the
ACCEPTED MANUSCRIPT
HSDs in the present study have clinical relevance and whether these compounds accumulate in lipid-rich tissues.
6. Acknowledgement
The Drug Research Academy at the University of Copenhagen is acknowledged for funding CHM.
7. References
Borowiecki, P. 2015. Enantiodifferentiation of promethazine using (S)-(−)-BINOL as the NMR chiral solvating agent: determination of the enantiomeric purity and performance comparison with traditional chiral HPLC. Tetrahedron: Asymmetry, 26, 16-23. doi:http://dx.doi.org/10.1016/j.tetasy.2014.11.018
Braun, F., Bertolettin, N., Möller, G., Adamski, J., Steinmetzer, T., Salah, M., Abdelsamie, A.S., van Koppen, C.J., Heine, S., Klebe, G., Marchais-Oberwinkler, S. 2016. First Structure−Activity Relationship of 17β-Hydroxysteroid Dehydrogenase Type 14 Nonsteroidal Inhibitors and Crystal Structures in Complex with the Enzyme. J Med. Chem. 59, 10719-10737
Byrne, G.C., Perry, Y.S., Winter, J.S. 1985. Kinetic analysis of adrenal 3 beta-hydroxysteroid dehydrogenase activity during human development. J. Clin. Endocrinol. Metab. 60, 934-939. doi:10.1210/jcem-60-5-934
Chen, C. 2008. Physicochemical, pharmacological and pharmacokinetic properties of the zwitterionic antihistamines cetirizine and levocetirizine. Curr. Med. Chem. 15, 2173-2191.
Church, M., K., Maurer, M. 2014. Antihistamines. Chem. Immunol. Allergy 100, 302-310. doi:10.1159/000359963
Danish Medicines Agency 2016. Phenergan, Alnok, Telfast. Retrieved on 27 January 2016 from http://pro.medicin.dk/
DiGregorio, G.J., Ruch, E. 1980. Human whole blood and parotid saliva concentrations of oral and intramuscular promethazine. J. Pharmaceut. Sci. 69, 1457-1459.
Fan, D.F., Troen, P., 1975. Studies of the human testis. VII. Conversion of pregnenolone to progesterone. J. Clin. Endocrinol. Met. 41, 563-574. doi:10.1210/jcem-41-3-563.
Hansen, C.H., Larsen, L.W., Sørensen, A.M., Halling-Sørensen, B., Styrishave B. 2017. The six most widely used selective serotonin reuptake inhibitors decrease androgens and increase estrogens in the H295R cell line. Tox. in Vitro 41, 1-11.
Harvey, P.W., Everett, D.J., 2003. The adrenal cortex and steroidogenesis as cellular and molecular targets for toxicity: Critical omissions from regulatory endocrine disrupter screening strategies for human health? J. Appl. Toxicol. 23, 81-87.
Hilscherova, K., Jones, P.D., Gracia, T., Newsted, J.L., Zhang, X., Sanderson, J.T., . . . Giesy, J. P. 2004. Assessment of the effects of chemicals on the expression of ten steroidogenic genes in the H295R cell line using real-time PCR. Tox. Sci. 81, 78-89. doi:10.1093/toxsci/kfh191
Houk, C.P., Pearson, E.J., Martinelle, N., Donahoe, P.K., Teixeira, J. 2004. Feedback inhibition of steroidogenic acute regulatory protein expression in vitro and in vivo by androgens. Endocrinology, 145(3), 1269-1275. doi:10.1210/en.2003-1046
ACCEPTED MANUSCRIPT
Danish Health Authority, 2009. (11 February 2011). ATC-grupe R06 - Antihistaminer. Retrieved from http://www.irf.dk/dk/rekommandationsliste/baggrundsnotater/aandedraetsorganer/atc-gruppe_r06_96_antihistaminer.htm
Jones, A.W. 2016. Perspectives in Drug Development and Clinical Pharmacology: The Discovery of Histamine H1 and H2 Antagonists. Clin. Pharmacol. Drug Dev. 5, 5-12. doi:10.1002/cpdd.236 Källén, B., Olausson, P.O. 2001. Monitoring of maternal drug use and infant congenital
malformations. Does loratadine cause hypospadias? Int. J. Risk Saf. Med. 14, 115-119.
Kaminska, B., Czerwinska, J., Wojciechowicz, B., Nynca, A., Ciereszko, R. 2014. Genistein and daidzein affect in vitro steroidogenesis but not gene expression of steroidogenic enzymes in adrenals of pigs. J. Physiol. Pharmacol. 65, 127-133.
Mahdy, A.M., Webster, N.R. 2011. Histamine and antihistamines. Anaesthesia Intens. Care Med. 12, 324-329. doi:http://dx.doi.org/10.1016/j.mpaic.2011.04.012
Mason, J., Reynolds, R., Rao, N. 1999. The systemic safety of fexofenadine HCl. Clin Experiment Allergy, 29 Suppl 3, 163-170; discussion 171-163.
McIntyre, B.S., Vancutsem, P.M., Treinen, K.A., Morrissey, R.E. 2003. Effects of perinatal loratadine exposure on male rat reproductive organ development. Reprod. Toxicol. 17, 691-697. doi:http://dx.doi.org/10.1016/S0890-6238(03)00108-4
Molimard, M., Diquet, B., Benedetti, M.S. 2004. Comparison of pharmacokinetics and metabolism of desloratadine, fexofenadine, levocetirizine and mizolastine in humans. Fund. Clin. Pharmacol. 18, 399-411. doi:10.1111/j.1472-8206.2004.00254.x
Ndossi, D.G., Frizzell, C., Tremoen, N.H., Faeste, C.K., Verhaegen, S., Dahl, E., . . . Ropstad, E. 2012. An in vitro investigation of endocrine disrupting effects of trichothecenes deoxynivalenol (DON), T-2 and HT-2 toxins. Tox. Lett. 214, 268-278. doi:10.1016/j.toxlet.2012.09.005
Nicolas, J.-M., Whomsley, R., Collart, C., Roba, J. 1999. In vitro inhibition of human liver drug metabolizing enzymes by second generation antihistamines. Chem.-Biol. Interac. 123, 63-79. Nielsen, F.K., Hansen, C.H., Fey, J.A., Hansen, M., Jacobsen, N.W., Halling-Sorensen, B., Björklund, E,
Styrishave, B. 2012. H295R cells as a model for steroidogenic disruption: a broader perspective using simultaneous chemical analysis of 7 key steroid hormones. Tox. in Vitro 26, 343-350. doi:10.1016/j.tiv.2011.12.008
O'Brien, J., Wilson, I., Orton, T., Pognan, F. 2000. Investigation of the Alamar Blue (resazurin) fluorescent dye for the assessment of mammalian cell cytotoxicity. Eur. J. Biochem. 267, 5421-5426.
OECD. 2011. Test No. 456: H295R Steroidogenesis Assay: OECD Publishing.
Ohno, S., Matsumoto, N., Watanabe, M., Nakajin, S. 2004. Flavonoid inhibition of overexpressed human 3beta-hydroxysteroid dehydrogenase type II. J. Steroid Biochem. Mol. Biol. 88, 175-182. doi:10.1016/j.jsbmb.2003.11.007
Ohno, S., Shinoda, S., Toyoshima, S., Nakazawa, H., Makino, T., Nakajin, S. 2002. Effects of flavonoid phytochemicals on cortisol production and on activities of steroidogenic enzymes in human adrenocortical H295R cells. J. Steroid Biochem. Mol. Biol. 80, 355-363.
Penning, T.M. 1997. Molecular endocrinology of hydroxysteroid dehydrogenases. Endocr. Rev. 18, 281-305. doi:10.1210/edrv.18.3.0302
Portnoy, J.M., Dinakar, C. 2004. Review of cetirizine hydrochloride for the treatment of allergic disorders. Expert Opin. Pharmacother. 5, 125-135. doi:10.1517/14656566.5.1.125
Rainey, W.E., Bird, I.M., Sawetawan, C., Hanley, N.A., McCarthy, J.L., McGee, E.A., . . . Mason, J.I. 1993. Regulation of human adrenal carcinoma cell (NCI-H295) production of C19 steroids. J. Clin. Endocrinol. Metab. 77, 731-737. doi:10.1210/jcem.77.3.8396576
Reul, J.M., Stec, I., Soder, M., Holsboer, F. 1993. Chronic treatment of rats with the antidepressant amitriptyline attenuates the activity of the hypothalamic-pituitary-adrenocortical system. Endocrin. 133, 312-320. doi:10.1210/endo.133.1.8391426
ACCEPTED MANUSCRIPT
Robbins, D.K., Castles, M.A., Pack, D.J., Bhargava, V.O., Weir, S.J. 1998. Dose proportionality and comparison of single and multiple dose pharmacokinetics of fexofenadine (MDL 16455) and its enantiomers in healthy male volunteers. Biopharmaceut. Drug Disposit. 19, 455-463. Russell, T., Stoltz, M., Weir, S. 1998 Pharmacokinetics, pharmacodynamics, and tolerance of single-
and multiple-dose fexofenadine hydrochloride in healthy male volunteers. Clin. Pharmacol. Ther. 64, 612-621
Sanderson, J.T. 2006. The steroid hormone biosynthesis pathway as a target for endocrine-disrupting chemicals. Tox. Sci. 94, 3-21. doi:10.1093/toxsci/kfl051
Sanderson, J.T., Boerma, J., Lansbergen, G.W., van den Berg, M. 2002. Induction and inhibition of aromatase (CYP19) activity by various classes of pesticides in H295R human adrenocortical carcinoma cells. Tox. Applied Pharmacol. 182, 44-54.
Shawky, R.M., Seifeldin, N.S. 2015. The relation between antihistamine medication during early pregnancy & birth defects. Egypt. J. Med. Human Gen. 16, 287-290. doi:http://dx.doi.org/10.1016/j.ejmhg.2015.04.003
Simons, F.E., Simons, K.J. 2008. H1 antihistamines: current status and future directions. World Allergy Organ J. 1, 145-155. doi:10.1097/WOX.0b013e318186fb3a
Simpson, K., Jarvis, B. 2000. Fexofenadine: a review of its use in the management of seasonal allergic rhinitis and chronic idiopathic urticaria. Drugs 59, 301-321.
So, M., Bozzo, P., Inoue, M., Einarson, A. 2010. Safety of antihistamines during pregnancy and lactation. Can. Family Physician 56, 427-429. Retrieved from http://www.ncbi.nlm.nih.gov/pmc/articles/PMC2868610/
Staels, B., Hum, D. W., Miller, W.L. 1993. Regulation of steroidogenesis in NCI-H295 cells: a cellular model of the human fetal adrenal. Mol. Endocrinol. 7, 423-433. doi:10.1210/mend.7.3.8387159
Sundhedsdatastyrelsen. 2016 (19 April 2016). Medstat.dk. Retrieved from http://www.medstat.dk/ Sørensen, A.M., Hansen, C.H., Bonomo, S., Olsen, L., Jørgensen, F.S., Weisser, J.J., Kretschmann, A.C.,
Styrishave, B. 2016. Enantioselective endocrine disrupting effects of omeprazole studied in the H295R cell assay and by molecular modeling. Tox. in Vitro 34, 71-80.
Taylor, G., Houston, J.B., Shaffer, J., Mawer, G. 1983. Pharmacokinetics of promethazine and its sulphoxide metabolite after intravenous and oral administration to man. British J. Clin. Pharmacol. 15, 287-293. doi:10.1111/j.1365-2125.1983.tb01501.x
UNEP. 2012. State of the Science of Endocrine Disrupting Chemicals 2012: Summary for Decision-Makers
Weisser, J.J., Hansen, C.H., Poulsen, R., Larsen, L.W., Cornett, C., Styrishave, B. 2016. Two simple cleanup methods combined with LC-MS/MS for quantification of steroid hormones in in vivo and in vitro assays. Anal. Bioanal. Chem. 408, 4883-4895. doi:10.1007/s00216-016-9575-z Willingham, E., Agras, K., Vilela, M., Baskin, L.S. 2006. Loratadine exerts estrogen-like effects and
disrupts penile development in the mouse. J. Urol. 175, 723-726. doi:10.1016/s0022-5347(05)00188-6
ACCEPTED MANUSCRIPT
Figure legends:
Figure 1: The effects of promethazine (green), cetirizine (blue) and fexofenadine (red) on the steroidogenesis conducted in the H295R cell assay. The results are presented in the standard steroidogenic setup as relative steroid hormone concentrations compared to solvent controls (= 100%) plotted as a function of increasing drug concentrations (µM). Error bars are standard error of mean (SEM, n = 3-12). Blue bars indicate steroid metabolizing enzymes. LOQ is limit of quantification. CYP: Cytochrome P450 enzyme; HSD: Hydroxysteroid dehydrogenase..
Figure 2: Products/substrates ratios for 3β-HSD and 17β-HSD in cells exposed to promethazine (green squares) and cetirizine (blue circles). 3β-HSD products included PROG, OH-PROG and AN, and sub-strates included PREG, OH- PREG and DHEA. For 17β-HSD, TS and β-E2 were products and AN and E1 were substrates. Error bars are SEM (n = 3 – 12). Stars indicate significance levels; * (p < 0.05), ** (p < 0.01), *** (p < 0.001), and **** (p < 0.0001).
Figure 3: The effects of promethazine (PMZ) concentrations 0.01, 3.14 and 31.4 µM and cetirizine (CET) concentrations 1, 31.4 and 200 µM on 3β-HSD and 17β-HSD gene expression in H295R cells. Expression of genes was normalized to the expression of TfB2M. The y-axis represents the change in expression compared to the relevant solvent control (SC). Represented values are means of two de-terminations on each of the three replicates from the H295R steroidogenesis assay. Error bars are SEM. Stars indicate significance levels; * (p < 0.05), ** (p < 0.01), and *** (p < 0.001).
ACCEPTED MANUSCRIPT
Table 1: Overview of investigated antihistamines, and some physiochemical properties.
Promethazine Cetirizine Fexofenadine
Brand names Phenergan, Pro-methazin
Alnok, Vialerg, Zyrtec, Cetirizin Alterfast, Altifex, Nefoxef, Telfast First- or second
generation
First generation Second generation Second generation Chemical structure Molecular weight (g/mol) 320,88 461,81 538,12 Therapeutic dose (mg) 25 (up to 200)a, b 10a , b 120-240a, b, c Cmax (µM) 0.02-0.06b,d, e 0.62-0.98b, f, g 0.57-2.84b, h, i Log D at physiological pH ~2.5 ~1.5 0.3-0.5 a
(Danish Health Authority, 2009), b(Danish Medicines Agency, 2016), c(Mason et al., 1999), d(Taylor et al., 1983),
e
(DiGregorio & Ruch, 1980), f(Portnoy & Dinakar, 2004), g(Chen, 2008), h(Molimard et al., 2004), i(Simpson & Jarvis, 2000a).
ACCEPTED MANUSCRIPT
Munkboel et al highlights
Endocrine effects of 3 antihistamines were investigated in the H295R steroidogenesis assay Promethazine and cetirizine increased Δ-5 steroids and decreased Δ-4 steroids
Exposure to promethazine and cetirizine increased 3β-HSD gene expression Fexofenadine exerted little effects on steroidogenesis