HAL Id: hal-02329727
https://hal.archives-ouvertes.fr/hal-02329727
Submitted on 23 Oct 2019HAL is a multi-disciplinary open access archive for the deposit and dissemination of sci-entific research documents, whether they are pub-lished or not. The documents may come from teaching and research institutions in France or abroad, or from public or private research centers.
L’archive ouverte pluridisciplinaire HAL, est destinée au dépôt et à la diffusion de documents scientifiques de niveau recherche, publiés ou non, émanant des établissements d’enseignement et de recherche français ou étrangers, des laboratoires publics ou privés.
First characterizations by capillary electrophoresis of
human Chorionic Gonadotropin at the intact level
Julien Camperi, Bart de Cock, Valérie Pichon, Audrey Combes, Jean
Guibourdenche, Thierry Fournier, Yvan Vander Heyden, Debby Mangelings,
Nathalie Delaunay
To cite this version:
Julien Camperi, Bart de Cock, Valérie Pichon, Audrey Combes, Jean Guibourdenche, et al.. First characterizations by capillary electrophoresis of human Chorionic Gonadotropin at the intact level. Talanta, Elsevier, 2019, 193, pp.77-86. �10.1016/j.talanta.2018.09.095�. �hal-02329727�
First characterizations by capillary electrophoresis of human
Chorionic Gonadotropin at the intact level
Julien Camperi a , Bart De Cock a,b , Valerie Pichon a,c , Audrey Combes a , Jean Guibourdenche d , Thierry Fournier e
, Yvan Vander Heyden b , Debby Mangelings b , Nathalie Delaunay a a
Laboratory of Analytical, Bioanalytical Sciences and Miniaturization, UMR CBI 8231 CNRS -ESPCI Paris, PSL University, Paris, France
b
Department of Analytical Chemistry, Applied Chemometrics and Molecular Modelling, Vrije Universiteit Brussel (VUB), Brussels, Belgium
c
Sorbonne Université, Paris, France d
Laboratory of Hormonology, CHU Cochin AP-HP, Paris, France e
Laboratory of Physiopathology and PharmacoToxicology of the Human Placenta, UMR-S 1139 Inserm - University Paris Descartes, Sorbonne Paris Cité, Paris, France
Corresponding author: Nathalie Delaunay, nathalie.delaunay@espci.fr
Corresponding author institution: LSABM, UMR CBI 8231 CNRS – ESPCI Paris, 10 rue Vauquelin, 75231 Paris cedex 05, France.
Keywords: human Chorionic Gonadotropin; Intact protein; Glycosylation; Capillary electrophoresis; Mass spectrometry;
2
Abstract
In the present work, the first characterizations by Capillary Electrophoresis of the human Chorionic Gonadotropin (hCG) hormone at the intact level were carried out. hCG is a hetero-dimeric glycoprotein, specific to the human pregnancy, consisting of an α and a β subunit, so-called hCGα and hCGβ, respectively. hCG has 8 potential glycosylation sites leading to a high number of isoforms (including glycoforms and other post-translational modifications) that we are interesting to characterize. First, Capillary Gel Electrophoresis (CGE) was used to separate the isoforms of two hCG-based drugs: Ovitrelle® (recombinant r-hCG) and Pregnyl (hCG isolated from the urine of pregnant women, u-hCG). As expected, CGE led to a better resolution than SDS-PAGE and confirmed the large heterogeneity of hCG. Different CGE profiles were obtained for the two hCG-based drugs, varying in number of peaks, migration times, and peak intensities, thus demonstrating that the drugs contain isoforms, different in nature and proportion. This result was confirmed by Capillary IsoElectrophoretic Focusing (CIEF). The pI ranges of the hCG isoforms were found between 3.4 and 4.7, and 4.5 and 5.2 for r-hCG and u-hCG, respectively. This information was further used to develop the separation of the hCG isoforms by Capillary Zone Electrophoresis (CZE). The pH, the nature, and the concentration of the background electrolyte as well as the nature and the content of its organic modifier were optimized. The use of a coated capillary to avoid protein adsorption was also evaluated. The final CZE-UV method allowed distinguishing at least 6 peaks, corresponding to different hCG isoforms.
To significantly improve the level of information obtained, the CZE instrument was then coupled by means of an electrospray ionization source to a triple quadrupole (TQ) mass spectrometer. Two detection strategies were used, one focusing on the lower m/z values (100-1000) in order to identify some sugar residues as diagnostic ions to confirm the presence of glycan chains, and the second focusing on the higher m/z values (1000-2000), corresponding to the multiple charged intact protein isoforms. For both approaches, the fragmentor and capillary voltage values were optimized. The composition and the flow-rate of the sheath liquid were then optimized for the strategy focusing on the higher m/z values in order to both increase the charge state of the ionized intact isoforms and the signal-to-noise ratio. The final method was used to compare the two hCG-based drugs, demonstrating the potential of the developed CZE-MS method for isoforms fingerprinting.
3
1. Introduction
The human Chorionic Gonadotropin (hCG) protein is a hormone essential for the maintenance of the pregnancy and the development of both placenta and fetus [1]. hCG is a hetero-dimeric glycoprotein consisting of an α and β subunit with a total of eight potential glycosylation sites, comprising 4 N- and 4 O-linked oligosaccharides. Its subunits, hCGα and hCGβ, are non-covalently associated and internally stabilized by a cysteine knot and disulfide bonds. The α-subunit is similar to other gonadotropin hormones, such as the luteinizing hormone (LH), the follicle-stimulating hormone (FSH), and the thyroid-stimulating hormone (TSH), while the β-subunit constitutes the specific part of the hCG [2]. hCGα has a molecular weight (MW) of 10,188 Da with 92 amino acids. Two asparagine-linked carbohydrate units (N-glycans) were determined on Asn-76 and Asn-102 residues [3,4]. hCGβ is composed of 145 amino acids and has a MW of 15,509 Da with two asparagine-linked glycans localized on Asn-33 and Asn-50 residues. Moreover, four serine-linked oligosaccharides (O-glycans) attached to serine residues 121, 127, 132, and 138 have also been shown [5]. With eight potential glycans, hCG is a highly glycosylated protein and about 30% of its MW is due to the glycosylation [6]. Indeed, its mass range was estimated between 30 and 50 kDa.
Glycosylation is a commonly observed post-translational modification (PTM) of proteins. Indeed, more than 70% of the human proteins are glycosylated [7]. Studies demonstrated that the glycosylated state of a protein impacts directly its biological functions, its stability, its half-life, etc [3]. Concerning hCG, studies demonstrated that different hCG glycoforms are produced by two distinct placental sources and that the glycan profile varies for each source of production during the pregnancy [3,8]. Based on these considerations, some glycosylated forms of hCG could be potential biomarkers to diagnose pregnancy pathologies from placental origin, which represents a major societal challenge.
Nevertheless, the full characterization of a glycoprotein is very complex due to the high number of isoforms, especially for hCG and its 8 glycosylation sites, which can give a very large number of glycoforms. Furthermore, other PTMs such as deamidation or oxidation may further complicate its characterization. Generally, the glycoprotein characterization is currently performed with the analysis of the peptides obtained after the enzymatic digestion of the protein, the so-called bottom-up strategy [9–11]. The peptides are separated by liquid chromatography (LC) or capillary electrophoresis (CE) prior to their identification by mass spectrometry (MS). This strategy allows the identification of proteins, the localization of the glycans along the protein chain and the determination of the MW of the glycans [12,13]. Concerning hCG, different studies using the bottom-up strategy allowed the sequencing of several glycopeptides with the composition of the associated glycans for each N-glycosylation site [14–16]. Furthermore, the interest of the use of a pronase as enzyme to isolate the O-glycosylation sites in order to determine the O-glycan composition of the β-subunit was also demonstrated [17]. Other studies on the hCG showed the interest of a second
4
approach based on the release of the N-glycans after an enzymatic digestion with PNGase-F to obtain the N-glycan profiling of different hCG-based drugs [18]. However, despite the interest of the bottom-up and released N-glycans approaches to elucidate the composition, the structure and the localisation of glycans on the protein, the information on the exact combinations of multiple PTMs (macro-heterogeneity) is lost. Moreover, these approaches suffer from some disadvantages because of the numerous steps that are usually necessary such as alkylation and reduction in addition to enzymatic digestion that are expensive, time consuming, and may lead to the loss of some monosaccharides or minority isoforms.
This is why, currently, the analysis of the proteins at the intact level generates a large interest in the field of protein analysis [19, 20]. For hCG, composed of two subunits that both contribute to its bioactivity, it may also allow knowing which isoform of hCGα is associated with such isoform of hCGβ. Nevertheless, a high performance separation step is required because of the structural similarity of the isoforms, in order to reach the best possible separation resolution between the isoforms to facilitate their ionization in MS [21].
Both LC and CE are high-performance separation techniques and are used for the analysis of intact proteins [22–25]. We recently published the first characterization of hCG at the intact level by reversed-phase liquid chromatography (RPLC) coupled with high-resolution mass spectrometry (HRMS) [26]. Nevertheless, only the main isoforms of hCGα were detected with this method. As LC and CE are based on different separation mechanisms, capillary electrophoresis can provide complementary information to the LC method. Moreover, CE is characterized by high efficiencies, especially with proteins since they have a low diffusion coefficient, involves aqueous conditions, which allow avoiding the conformational change due to a stationary phase, and can separate the protein isoforms as a function of their charge-to-size ratio, their pI values or their size depending on the involved mechanism.
The analysis of intact hCG or its subunits by electrokinetic techniques was mainly carried out at the non-miniaturized scale, i.e. SDS-PAGE or isoelectric focusing [27–30]. These approaches require the use of toxic products, show a long analysis times, use expensive materials, high sample volumes while the separation resolution is low [31]. This is why the use of electrokinetic methods at the capillary format is nowadays preferred, allowing fast analysis thanks to the possibility to apply electric fields 10 to 100 times higher without joule effect, leading to a high resolution for the separation of protein isoforms whatever separation mode used [22, 23, 32–34].
As far as we know, the capillary gel electrophoresis (CGE) and the capillary isoelectric focusing (CIEF) modes have never been used for the hCG characterization. Concerning capillary zone electrophoresis (CZE), three papers were published for hCG, all involving a non-volatile borate- or phosphate-based buffer and UV detection, thus preventing any identification [34–36]. To go further in the hCG isoform characterization, the hyphenation of the CZE separation with mass spectrometry is required. Indeed, the glycoform profiling of the intact alpha subunit (hCGα) was done by CZE coupled with a high resolution MS analyser
5
[37]. Hence, this work presents for the first time the analysis of dimeric hCG by CGE, CIEF, and CZE-MS. Two hCG-based drugs were used as standards: Ovitrelle® (recombinant hCG, r-hCG) and Pregnyl® (hCG from urine of pregnant women, u-hCG).
2. Material and methods
2.1. Reagents and analytes
Acetonitrile (ACN), isopropanol (IPA) and methanol (MeOH) were of HPLC grade. 1 M NaOH and 0.1 M HCl solutions were purchased from VWR (Fontenay-sous-bois, France). Bovine serum albumin (BSA, molecular mass, 66,000 Da), dimethylformamide (DMF, > 99%), hydroxypropyl cellulose (HPC, molecular mass, 100,000 > 99%), polyvinyl alcohol (PVA, molecular mass, 205,000 > 99%), phosphoric acid (85%), arginine, iminodiacetic acid, urea, β-mercaptoethanol, and HPLC acetone were purchased from Sigma-Aldrich (Saint-Quentin-Fallavier, France). Hydrochloric acid (HCl), formic acid (FA), and acetic acid (AC) were obtained from Carlo Erba (Val de Reuil, France). The ultra-pure water was obtained with a Direct-Q3 UV system (Millipore, Molsheim, France) and used for the preparation of all stock solutions and the background electrolyte (BGE).
Ovitrelle® and Pregnyl®, two hCG-based drugs, were used as recombinant hCG (r-hCG) and urinary hCG (u-hCG) standards, respectively. Ovitrelle® (Serono Europe, London, UK) was available as a solution containing 250 µg of r-hCG, and Pregnyl (Organon, Oss, The Netherlands) as a lyophilized powder containing 5000 IU of u-hCG (1 IU being equivalent to a concentration of 0.092 µg L-1 [38]). A lyophilized powder, containing 500 µg of r-hCGβ (recombinant Pichia pastoris, r-hCGβ), was purchased from Sigma-Aldrich (Saint-Quentin Fallavier, France). The Ovitrelle® solution was diluted in water to obtain a stock solution containing 100 mg L-1 of r-hCG. For Pregnyl® and r-hCGβ, the lyophilized content of each ampoule was reconstituted in water at a concentration of 100 mg L-1. The standard solutions were aliquoted and stored at -20°C. Before the analysis in CZE-MS system, the hCG fractions were cleaned and concentrated by centrifugation with ultra-centrifugal units (Merck, Darmstadt, Germany) with a molecular weight cut-off of 10 kDa, to remove small additives from drug formulations.
2.2 Experimental set-up
2.2.1 CGE-UV method
The capillary gel electrophoresis method was carried out using a Beckman P/ACE MDQ capillary electrophoresis system (AB Sciex, Ulis, France) equipped with a diode array detector (DAD). The detection was performed at 220 nm ± 10 nm, the reference wavelength was 350 nm ± 10 nm and the data acquisition rate 2 Hz. The acquisitions were performed by the 32 Karat® software version 9.1 (Beckman-Coulter). The separation was achieved using a bare fused-silica capillary (Photonlines, Marly-le-Roi, France) with an inner diameter of
6
50 µm, an effective length of 20 cm and a total length of 30.2 cm, installed into a PA 800 cartridge. The temperature cartridge was set at 25°C. The analysis of the hCG protein was performed with the SDS-MW Analysis Kit, delivered by Beckman®, that was designed for the separation of protein-SDS complexes using a replaceable gel matrix. The kit utilises different reagents: ProteomLab MW sample buffer (100 mM Tris-HCl, 1% SDS, pH 9) and SDS-MW gel buffer. The SDS-SDS-MW size standard (recombinant proteins, 10-225 kDa, supplied with the ProteomeLABTM SDS-Analysis Kit) was used to estimate the protein molecular weight. The bovine serum albumin (BSA, 66 kDa) was used as an internal standard (1 µg ml-1 inH2O, 2.5 µL in sample). β-mercaptoethanol (5 µL) was also added to each vial, containing 95 µL of protein sample (10 µl in 85 µl of sample buffer) or diluted SDS-MW size standard. Then, the vials were capped tightly and heated at 100°C for 3 min. Prior to the CE analysis, a capillary preconditioning was performed by consecutively rinsing the capillary with 1 M NaOH (10 min, 20 psi), 0.1 M HCl (5 min, 20 psi), ultra-pure water (2 min, 20 psi), and SDS gel (10 min, 70 psi) before the application of a voltage with reverse polarity (-15 kV, 10 min) for SDS gel equilibration. Then, the hCG sample was injected electrokinetically (-5 kV, 20 s) at a concentration of 2 mg ml-1 in H2O. The applied voltage during the separation was set at -15 kV during 30 min.
2.2.2 CIEF-UV method
CIEF experiments were performed on an Agilent G7100 (Agilent Technologies, Massy, France) instrument, equipped with a DAD, using a bare fused-silica capillary coated with HPC with a total length of 30.2 cm (effective length: 20 cm) x 50 µm inner diameter. The detection was performed at 214 nm ± 4 nm and the reference wavelength was 360 nm ± 100 nm. The data acquisition was 10 Hz and the temperature 25°C. The electropherograms were processed by means of the 3D-CE Chemstation software (Agilent Technologies). The analysis of hCG was performed using the CIEF kit delivered by Beckman®. The kit utilises 200 mM phosphoric acid as anolyte and 300 mM NaOH as catholyte. The cathodic and anodic stabilizers were 500 mM arginine and 200 mM iminodiacetic acid, respectively. The chemical mobilizer used was 350 mM acetic acid and the ampholytes provided a pH gradient between 3 and 10. The used peptidic pI markers had pI values of 10, 9.5, 7, and 5.5. The CIEF gel contained 6 M urea while the rinsing urea solution had a concentration of 4.3 M. The applied voltages during focusing and mobilization were set at 25 and 30 kV under normal polarity, respectively. The sample consisted of 500 µg ml-1 of r-hCG in H2O.
For the HPC coating, a polymer solution was prepared by dissolving at 40°C HPC in water at a concentration of 5% w/v. The procedure was according to Shen and Smith’s protocol [39], based on a physical adsorption of highly-hydrophilic substitute-celluloses onto the silica wall by a thermal process. For this purpose, the capillary was first pre-treated with acetone during 10 min, and then washed with 1 M NaOH for 30 min and with 0.1 M HCl and ultra-pure water for 10 min each. The polymer solution was then hydrodynamically pumped for 5 min
7
through the capillary at approximately 1 bar. Then, the capillary was put in a gas chromatograph oven 3800 GC (Varian, Grenoble, France), heated from 60 to 140°C at 5°C min-1, and held at 140°C for 20 min with a nitrogen flow.
To evaluate the quality of the coating, the EOF was measured according to the Vigh’s procedure [40]. The electroosmotic mobility determination was achieved as follows: (i) the capillary was filled with a BGE composed of 5 mM sodium phosphate at pH 7.0, (ii) a neutral marker plug (1% DMF, here), diluted in the BGE, was hydrodynamically introduced into the capillary, (iii) the DMF plug was moved by pressure, with the capillary inlet introduced in a vial containing BGE, (iv) another plug of DMF was hydrodynamically injected and also moved by pressure, with the capillary inlet introduced in a vial containing BGE, (v) a voltage of 15 kV was applied during 3 min in order to move both DMF bands with electroosmotic velocity toward the UV detector, (vi) a third plug of DMF was hydrodynamically introduced into the capillary, and finally (vii) a constant pressure was applied, with the capillary inlet introduced in a vial containing BGE until CE software recorded the passage of the three plugs of DMF (neutral marker) through the detection window. The capillaries having electroosmotic mobility values superiorto 2 x 10⁻⁵ cm2 V-1 s-1 were discarded.
2.2.3 CZE-UV method
The CZE-UV experiments were carried out with an Agilent G7100 instrument. The detection was performed at 214 nm ± 4 nm and the reference wavelength was 360 nm ± 100 nm. A fused silica capillary with an internal diameter of 50 µm and a total length of 60 cm (effective length: 51.5 cm) was used. The applied voltage was + 30 kV with the optimized BGE; no joule heating was observed and the generated current was 32 µA. The capillary temperature was kept at 60°C. Prior to the first use, a capillary preconditioning was performed by rinsing the capillary with consecutively 1.0 M NaOH, 0.1 M NaOH, ultra-pure water, and BGE at a pressure of 1 bar during 20 min (3.28 µL min-1), each corresponding to about 55 capillary volumes.
The CZE BGE composition after optimization was 800 mM formic acid and 800 mM acetic acid at a pH of 2.2. Methanol and isopropanol were used as organic modifiers in the BGE and the sheath liquid. The BGE was prepared weekly as all stock solutions, filtered through a 0.25 µm syringe filter (Minisart® RC25, Sartorius, Goettingen, Germany) and placed during 10 min in an ultra-sonic bath prior to CE experiments.
For the PVA coating, the capillaries were prepared according to Belder’s protocol [41]. First, the capillary was filled with an acidified aqueous glutaraldehyde solution (200 mL of a 50% aqueous solution mixed with 300 mL of 1:10 diluted conc. HCl). Then, an acidified PVA solution (450 mL of a 5% aqueous PVA solution, mixed with 50 mL of 1:1 H2O diluted HCl) was pumped through the capillary at approximately 1 bar for 5 min. Then, the capillary was put in the gas chromatograph oven, heated from 40 to 160°C at 6°C min-1, and held at 160°C for 10 min with a nitrogen flow.
8
Between runs, the capillary was rinsed during 2 min with acetic acid (1 M) and 3 min with BGE both at a pressure of 1 bar (corresponding to 6-8 capillary volumes). The sample was injected hydrodynamically at 50 mbar during 20 s leading to an injection volume of 102 nL. The sample consisted of 500 µg ml-1 r-hCG in H2O. The sample injection was followed by a BGE plug injection at 50 mbar during 20 s.
2.2.4 CZE-(TQ) MS method
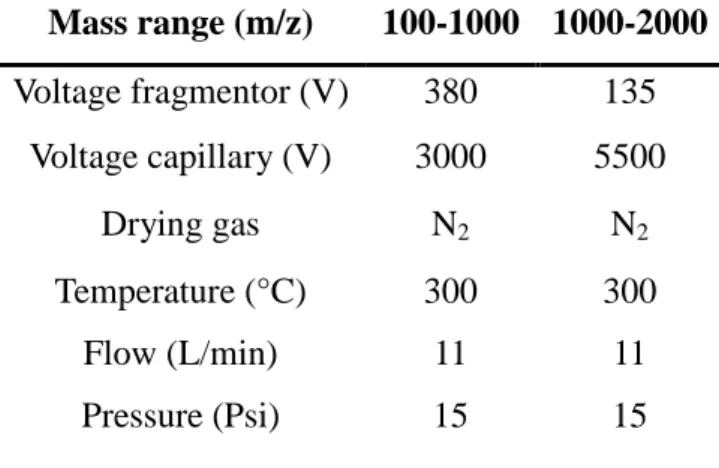
The CE-ESI-MS experiments were performed with an Agilent G7100 instrument utilizing an uncoated fused silica capillary with identical dimensions and from the same batch as during the CE-UV experiments. An Agilent CE ESI-MS sprayer and a Nano LC-pump sending the sheath liquid (H2O/MeOH/FA 50:50:0.1) was used at a flow rate of 0.6 µL min-1. The ionization was operated in the positive mode and the measurements performed on the Agilent triple quad 6400 detector MS. The fragmentor voltage, capillary voltage, used m/z ranges, and the drying gas parameters are shown in Table 1.
Table 1: Optimized parameters of the MS detection obtained for the r-hCG analysis by
CZE-(TQ)MS for low (m/z 100-1000) and high (m/z 1000-2000) masses.
3. Results and discussion
3.1 Gel-electrophoretic analysis of hCG
The most conventional electrokinetic method used for the characterization of proteins is gel electrophoresis. It is based, in general, on the use of SDS to unfold the proteins: the SDS molecules interact with the protein all along the amino acid-based chain and confer a constant charge-to-size ratio to all proteins. Therefore, they all have the same electrophoretic mobility and migrate across the gel according to their size.
Different isoforms of dimeric hCG were detected using the SDS-PAGE technique [27, 28, 30]. As reported, for example, by Gam and Latiff [28], many hCG bands were observed with main apparent MWs around 43.5 kDa and 38.5 kDa. Notice that it is only possible to give apparent MWs. Indeed, hCG is a highly glycosylated protein and the glycan content alters the
Mass range (m/z) 100-1000 1000-2000 Voltage fragmentor (V) 380 135 Voltage capillary (V) 3000 5500 Drying gas N2 N2 Temperature (°C) 300 300 Flow (L/min) 11 11 Pressure (Psi) 15 15
9
hCG mobility in gel electrophoresis, because (i) the SDS molecules do not interact with the glycan moieties and, (ii) the glycan moieties can have a charge if they contain, for example, sialic acids. This is why the glycan moieties confer an additional electrophoretic contribution to that of the protein, which may decrease or increase its total apparent electrophoretic mobility. This explains why some authors observed what they called abnormal migration shifts in some cases when they implemented successive digestions with different enzymes to remove gradually the glycans from hCG [27].
To overcome this limitation, Magnelli et al used a glycoprotein standard ladder (Candy-Cane from Invitrogen) [27]. However, it cannot lead to a correct MW determination as the glycan content of the standard glycosylated proteins may be dramatically different in nature (size) and charge from that of the hCG, that may be itself composed of various glycoforms with some of them being highly sialylated. Therefore, gel electrophoresis leads to apparent MWs of the hCG isoforms, but allows the comparison of different hCG profiles and can be helpful for the optimization of some protein treatment steps, such as their reduction.
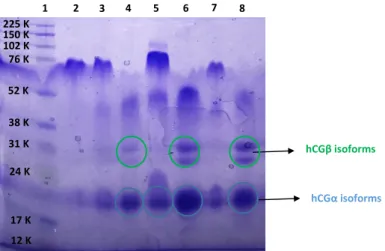
In this study, the SDS-PAGE technique was used to test different conditions of reduction of hCG using r-hCG as standard. The results are shown in Figure S1. Whatever the used percentage of β-mercaptoethanol between 2.5 and 7.5% at 95°C, a reduction time of 3 min was insufficient to completely reduce hCG. Using a longer reduction time of 15 min, two large bands were detected around 25-30 kDa that may correspond to the hCGβ isoforms, and one large band close to 18-20 kDa, which could be assigned to different isoforms of hCGα. Only with the harshest tested conditions, 7.5% of β-mercaptoethanol heated at 95°C for 15 min, the hCG protein was totally dissociated into its subunits hCGα and hCGβ.
Figure S1: Study of the reduction conditions on r-hCG by SDS-PAGE. Lane 1: protein
molecular weight markers; lane 2: not reduced r-hCG; lane 3: 2.5% β-mercaptoethanol at 95°C during 3 min; lane 4: 2.5% mercaptoethanol at 95°C during 15 min; lane 5: 5% β-mercaptoethanol at 95°C during 3 min; lane 6: 5% β-β-mercaptoethanol at 95°C during 15 min; lane 7: 7.5% β-mercaptoethanol at 95°C during 3 min; lane 8: 7.5% β-mercaptoethanol at
38 K 52 K 76 K 12 K 17 K 24 K 31 K 102 K 225 K 150 K 1 2 3 4 5 6 7 8 hCGα isoforms hCGβ isoforms
10
95°C during 15 min. The arrows indicate the different isoforms of hCGα and hCGβ. The SDS-PAGE was performed using a 12% polyacrylamide gel and using vertical gel apparatus (Amersham® ECL® Gel Box, GE Healthcare, Aulnay-sous-Bois, France) at a constant voltage of 160 V during 60 min. The r-hCG sample was prepared by a two times dilution with Tris-HCl-SDS buffer. 0.5 µg of r-hCG sample was loaded per well.
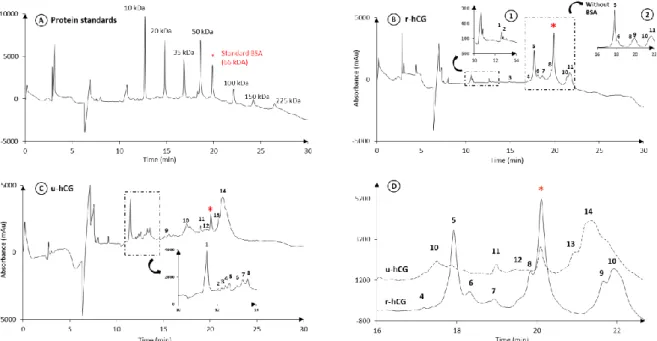
Next, for the first time for hCG, a high-performance capillary gel electrophoresis method was applied to separate the hCG isoforms. This was done with two hCG-based drugs, Ovitrelle® (r-hCG) and Pregnyl® (u-hCG). Figure 1 presents the resulting electropherograms. A protein MW standard mixture containing 7 recombinant proteins within the range of 10 to 225 kDa was used, not only to get calibration curves by plotting the MW as a function of the mobility (calibrations curves not shown) but mostly to evaluate the performance of the used analytical conditions (Figure 1A). It is obvious compared to SDS-PAGE (Figure S1, lane 1) that CGE provides improved resolutions with a shorter analysis time and a reduced sample consumption.
Figure 1: Analysis by CGE-UV of r-hCG and u-hCG after a partial reduction. (A) Protein
MW standard mixture; (B) r-hCG, with a zoom between 10 and 14 min (1), and between 16 and 22 min (2); (C) u-hCG; and (D) overlay of the r-hCG and u-hCG electropherograms between 16 and 23 min. BSA was added as an internal standard in all samples. r-hCG and u-hCG: 2 mg mL-1.Other conditions: see experimental section 2.2.1.
Figure 1B presents the resulting electropherogram obtained with r-hCG after a partial reduction step (5% of β-mercaptoethanol heated at 95°C for 3 min). A large number of peaks were detected between 16 and 22 min (peaks 4 to 9), which may correspond to the time
11
window expected for the hCG isoforms having MWs between 30 and 50 kDa, considering a potential shift in migration time due to glycan moieties on hCG. This confirms the high complexity of hCG, which did not appear so clearly from the previous SDS-PAGE analysis. From the calibration curve, the apparent MW ranges of all main peaks were estimated considering the beginning and the end of each peak (Table 2), after calculating standard deviations on the apparent MWs, inferior or equal to 12 Da (n=3). As expected from the partial reduction conditions used before injection, some peaks that may correspond to hCGα isoforms (MW without glycan: 10,198 Da) and hCGβ (MW without glycan: 15,521 Da) were detected at the beginning of the electropherogram (peaks 1 and 2 for hCGα and peak 3 for hCGβ). Figure 1B shows also two peaks with apparent MWs higher than 80 kDa (peaks 10 and 11), which may correspond either to highly-glycosylated hCG isoforms or to hCG aggregates.
A hCG-based drug obtained after extraction from urine of pregnant women, u-hCG, was next analysed by CGE-UV in the same conditions, including the same partial reduction step. The resulting electropherogram is presented on Figure 1C. As expected since u-hCG is produced from complex biological samples, the corresponding electropherogram is much more complex, with additional peaks between 10 and 14 min compared to the r-hCG electropherogram. These peaks (1 to 5) correspond to apparent MWs values between 6,300 and 9,780 Da that all are inferior to the MW of the α-subunit, even without any glycan. It can therefore be assumed that these peaks may correspond to either (i) other urinary proteins, (ii) cleaved forms of u-hCG, and/or (iii) highly sialylated hCGα. This last hypothesis is based on the fact that the presence of a high number of sialic acids on glycan moieties should accelerate the migration of the protein through the gel thanks to an additional anodic electrophoretic mobility contribution, and that some authors already observed a higher fraction of acidic hCG isoforms in urine [29, 42]. As previously discussed with r-hCG, the peaks 6, 7, and 8 can be assigned with a high level of confidence to the isoforms of the α-subunit and the peak 9 to one of the β-subunit. Figure 1C also shows a wide and quite intense massif of peaks eluting within the same range of migration times (16-22 min) as those of r-hCG. They should correspond to the u-hCG isoforms. Then, the peaks 13 and 14 in u-hCG (see Figure 1D for the enlarged view) were also detected with apparent MWs above 70 kDa, which may again correspond either to aggregated or highly glycosylated hCG.
Finally, the most important result obtained by CGE analysis of both hCG-based drugs appears on Figure 1D, where the electropherograms were overlaid in the area of interest, corresponding to the hCG isoforms. Two different profiles appear, with a varying number of peaks, different migration times and intensities. This clearly demonstrates that both hCG-based drugs contained isoforms, different in nature and amount. This study constitutes the first demonstration that CGE can be a useful and high performance technique for hCG fingerprinting. Nevertheless, CGE suffers from a big drawback: its incompatibility for a direct coupling with mass spectrometry, preventing further identification of the separated isoforms.
12
Table 2: Apparent MW range (determined as the estimated MWs at the beginning and end of
each peak) and signal-to-noise ratio (S/N) of the main peaks seen in the CGE-UV analysis of r-hCG and u-hCG (u-hCG and r-hCG: 2 mg mL-1). For peak number: see Figures 1B, 1C and 1D.
3.2 CIEF-UV method
A second electrokinetic technique usually involved in protein characterization is based on isoelectric focusing allowing a separation according to pI values. It has already been used at conventional format for hCG, to compare its isoforms in urine and serum samples [29, 30]. The obtained pI values were in the acidic range, between 3 and 7 in one case [29] and 3.3 and 4.9 in the second [30]. For the first time, the capillary format (CIEF) was used here for hCG in order to improve significantly the resolution, as it can distinguish two proteins whose pI differ by as few as 0.005 pH units and allows determining of protein-charge heterogeneity profiles [23].
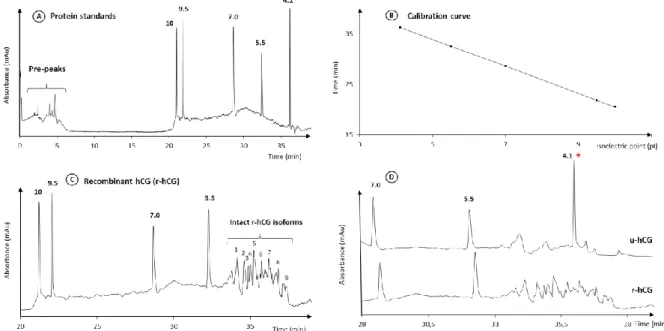
For the CIEF analysis of hCG, 5 isoelectric pI markers with values between 4.1 and 10.0 were selected and analysed using a CIEF kit and an ampholyte 3-10 (Figure 2A). During the focusing step of 15 min, some pre-peaks were detected thus confirming the success of this
r-hCG u-hCG
Peak
number MW range (kDa) S/N
Peak
number MW range (kDa) S/N
1 10.25-10.56 20 1 6.30-7.18 1500 2 11.27-11.58 5 2 7.97-8.20 66 3 18.77-19.58 7 3 8.35-8.66 100 4 32.42-33.62 6 4 8.81-9.18 166 5 37.48-41.80 211 5 9.28-9.78 366 6 42.37-45.45 44 6 10.28-11.09 133 7 47.91-50.98 34 7 11.39-12.36 400 8 59.43-61.87 65 8 12.36-12.88 446 9 64.01-66.24 80 9 19.13-29.03 80 10 85.48-90.04 70 10 32.87-45.43 215 11 90.30-101.61 77 11 49.03-52.87 466 12 53.66-61.27 10 13 73.22-78.41 750 14 78.41-99.00 1600
13
step. A chemical mobilisation step was next involved from 15 to 45 min, which displays the different pI marker peaks. The calibration curve was plotted, reporting the migration time and the pI marker values (Figure 2B). During the CIEF study, a calibration curve was built for each acquisition. However, the pI marker at 4.1 was not added in the preparation for the experiments because it would have co-migrated with some hCG isoforms.
Figure 2: Analysis of r-hCG and u-hCG by CIEF-UV. (A) CIEF analysis of 5 pI markers, (B)
Calibration curve, (C) CIEF analysis of hCG, and (D) overlay CIEF electropherograms of r-hCG and u-r-hCG in a reduced time range (marker 4.1 added only in the u-r-hCG sample). r-r-hCG and u-hCG: 2 mg mL-1. Other conditions: see experimental section 2.2.2.
First, r-hCG was mixed with the different pI markers, the cathodic and anodic stabilizers, the ampholytes providing a pH gradient between 3 and 10, and the CIEF gel containing 6 M urea. After the focusing and mobilisation steps, one typical resulting electropherogram is shown in Figure 2C. At least 15 r-hCG isoforms with pI values between 3.0 and 5.5 were separated. Table 3 presents the RSDs calculated for the migration times by taking the apex of the main peaks (n=3). They are between 0.92 and 1.23% for the migration times, which confirms the high repeatability of the CIEF method. With the calibrations curves, the corresponding pI values were determined, between 3.49 and 4.78, with RSD values below 1.55%. The results confirm the high resolution of the CIEF analysis for the characterization of protein isoforms, in particular hCG here, even if it is a very complex protein because of its 8 glycosylation sites.
14
Table 3: Relative standard deviation (RSD) values of the migration times and the estimated pI
values of the main peaks obtained for the r-hCG analysis by CIEF-UV (n=3). r-hCG: 500mgL-1. For peaks number: see Figure 2C.
Then, u-hCG was analysed by CIEF at the same conditions and Figure 2D presents an overlay in the area of interest of the resulting electropherogram with the one obtained for r-hCG. Two significantly different profiles can be observed, which confirms the previous result obtained in CGE that both hCG-based drugs contained isoforms, different in nature and proportion. Nevertheless, the u-hCG signal intensity is inferior to that of r-hCG. Two explanations can be provided. First, u-hCG is produced by extraction from urine and its bioactivity was determined to be 9,200 IU mg-1. Since each ampoule of drug contains 5,000 IU u-hCG, the calculation of the concentration in mg L-1 u-hCG was done considering that 1 IU was equal to 0.092 [38, 43]. This calculation hypothesis may be inaccurate. Secondly, it is known that cleaved forms of hCG occur in urine and they may also be present in the u-hCG-based drug. These cleaved forms may still be bioactive and contribute to the lower intensities of the u-hCG peaks with respect to the intensities of the r-u-hCG peaks, for which the concentration in mg L-1 is given by the manufacturer. Nevertheless, this experiment allows estimating a pI range between 4.5 and 5.2 for the u-hCG isoforms. This pI range, though somewhat narrower, is comparable to that obtained for r-hCG.
3.3 CZE-UV
Capillary zone electrophoresis involves a migration mechanism based on the charge and friction coefficient ratio of the molecule. It is particularly relevant for the separation of intact proteins, including the fingerprinting of intact isoforms [22, 44]. This is why this approach was implemented for hCG [34–37]. Nevertheless, as already mentioned in the introduction, three of the four papers involved a non-volatile borate- or phosphate-based buffer and UV detection preventing any identification [34–36]. To go further in the hCG isoform characterization, the hyphenation of the CZE separation with mass spectrometry (MS) is required, as it was done for the glycoform profiling of the intact hCGα [37].
Peak number 1 2 3 4 5 6 7 8 9
tm (min) 34.08 34.54 34.79 34.95 35.15 35.83 36.29 36.80 37.32
% RSD 1.23 1.22 1.22 1.23 1.20 0.92 0.87 1.02 0.99
pI values 4.78 4.60 4.50 4.44 4.35 4.08 3.90 3.70 3.49
15
The optimization of the CZE-MS method for the hCG analysis first started with a simple UV detector for the sake of simplicity, but taking into consideration that the final purpose was the hyphenation of the CZE separation with an MS detection. Therefore, a long capillary length of 60 cm (effective length: 51.5 cm) and a volatile BGE were selected.
Even if it was demonstrated that it was not possible to establish a generic CZE approach for the intact protein analysis and its transfer to CE-MS, two approaches are generally considered: working with a BGE at a pH either below or above the pI values of the proteins [45]. With a BGE pH below their pI values, proteins are positively charged and may interact with the deprotonated silanol groups at the surface of the capillary and, consequently, may adsorb more or less irreversibly, which is one of the main difficulties of protein analysis in CZE [22, 25, 45]. To limit this phenomenon, a capillary coating and/or a highly acidic pH can be used, to reduce as much as possible the deprotonation of the silanols and to favour the ESI-MS ionization in positive mode. With a BGE pH above their pI values, proteins are negatively charged, as is also the capillary wall, and electrostatic repulsions may limit their adsorption. In previous works related to the CZE analysis of hCG, a bare fused-silica capillary and a BGE pH between 6 and 9 and containing some diaminoalkane were used [34, 35, 37]. At this pH range and according to the pI values previously observed in CIEF, the hCG isoforms are negatively charged, which should limit their interactions with the capillary surface.
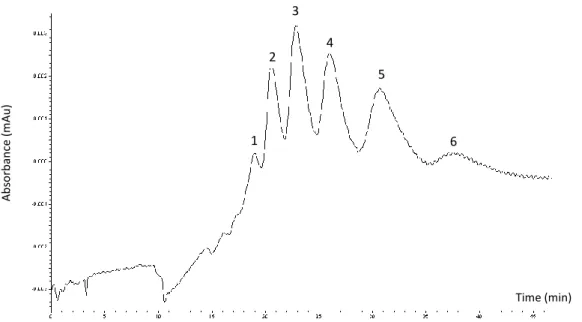
Thus, our first CZE experiments were carried out with a bare fused-silica capillary and a volatile BGE based on ammonium acetate at pH 8.0. It is worthwhile to note that the optimization of the parameters was done with r-hCG, which is purer than u-hCG. Unfortunately, a strong adsorption of hCG on to the capillary wall was observed, leading to peak broadening and low separation efficiencies. Different parameters were then tested to limit this phenomenon: an increase in the ionic strength from 50 up to 200 mM (maximum value allowing a voltage of 30 kV without detrimental Joule heating) by increments of 50 mM, an increase in the separation temperature from 25 to 60°C with increments of 5°C, and the use of a HPC capillary coating as usually described in the literature [20, 22, 44, 46, 47]. The best separation was obtained with a HPC-coated capillary, an ionic strength of 200 mM and a temperature of 60°C as shown on Figure S2. In that case, 6 wide peaks were observed with a total analysis time of about 50 min. It was highly probable that each peak corresponds to several glycoforms or other types of post-translational modifications, such as methylation, oxidation or amidation.
16
Figure S2: Electropherogram obtained for the r-hCG analysis by CZE-UV with a volatile
basic BGE: 200 mM ammonium acetate at pH 8.0. HPC-coated silica capillary, 50 μm x 60 cm (effective length: 51.5 cm). Hydrodynamic injection: 20 s, 50 mbar. Voltage: -30 kV. Temperature: 60°C. UV detection: 214 nm. r-hCG: 0.500 mg mL-1.
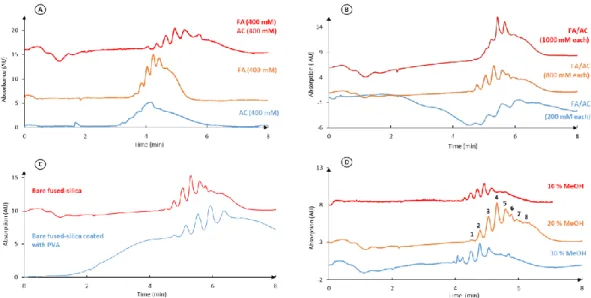
For comparison, our second approach consists of using a highly acidic BGE as was reported for the CZE-MS analysis of hCGα (BGE composed of 2% acetic acid at pH 2.5, but without any motivation of this choice) [37]. With a BGE pH below the previously determined pI values, the hCG isoforms are positively charged. BGEs based on formic acid (FA) and acetic acid (AC) at pH 2.2 were selected as they are both MS compatible and classically involved in this kind of application [44]. The effects of the nature and the concentration of the acids, alone or mixed (keeping their concentration constant) were first studied with a high voltage (30 kV) and a high temperature (60°C). As illustrated on Figure 3A, their combination led to an increased number of peaks and improved resolutions. This option was thus selected. It can also be noticed that the use of the acid BGE provides a dramatic decrease by a factor 10 in the analysis time compared to the basic BGE, whereas a similar number of peaks was observed. The concentration of each acid in the BGE was next varied from 0.2 to 1.0 M (Figure 3B). No Joule heating even at 30 kV was observed, regardless the tested concentrations. The concentrations of 800 mM of both FA and AC led to the best resolution and the highest number of separated isoforms. Therefore, this high BGE concentration may also help to prevent protein adsorption.
Ab so rb an ce (m Au ) Time (min) 1 2 3 4 5 6
17
Figure 3: Optimization of the CZE-UV separation of r-hCG. (A) Effect of the BGE
composition. (B) Effect of the acid concentrations. (C) Comparison between the use of bare and PVA-coated capillaries. (D) Effect of MeOH addition in BGE (800 mM of AC and FA, pH 2.2). r-hCG: 0.5 mg mL-1. Other conditions: see experimental section 2.2.3.
Nevertheless, the potential problem of protein adsorption was considered. The use of a neutral polyvinyl alcohol (PVA) coating was first evaluated (Figure 3C), but it led to an increased baseline drift and a decrease in resolution and sensitivity. A second strategy to limit hCG adsorption was the addition of an organic modifier to the BGE, as already reported [44, 45]. Indeed, the solvent may modify the zeta potential of the capillary surface, change the ionization state of the proteins and the silanol groups, reduce the hydrophobic interactions between the proteins and the wall, and change the protein conformation and solvation, which all may change the selectivity and reduce the adsorption. It may also favour the desolvation process in the ESI source. Both isopropanol and MeOH were tested at 10, 20, and 30%. Concerning the use of isopropanol as organic modifier, no improvement of the separation was seen. In return, the addition of 20% MeOH led to the best sensitivity and resolution (Figure 3D). The final BGE composition was thus 800 mM FA, 800 mM AC, and 20% MeOH, which led to the detection of 8 peaks within 8 min.
3.5 CZE-MS
The conditions optimized in CZE-UV were used for the hyphenation to a Triple Quadrupole mass spectrometer with an ESI interface and a nano-LC pump delivering a sheath liquid. Two different strategies for MS detection were used during this study: a detection targeting a low mass range (100-1000 m/z) and one targeting a high mass range (1000-2000 m/z). Both strategies needed an individual optimization. The conditions were first optimized for the low mass range. The fragmentor voltage was varied from 135 to 380 V, while keeping all other MS parameters constant. The highest sensitivity was obtained with a fragmentor voltage value
18
of 380 V. While maintaining the fragmentor voltage at 380 V, the capillary voltage of MS was varied from 0.5 to 6 kV. Some peaks appeared on the Base Peak Electropherogram (BPE) from a value of 2 kV and the maximum sensitivity was achieved at 3 kV. For the high mass range, a low fragmentor voltage of 135 V and a high capillary voltage of 5.5 kV were selected in order to avoid the fragmentation in the MS source and allow the transfer of the heaviest ions for the detection of intact isoforms. The retained MS parameters are summarized in Table 1.
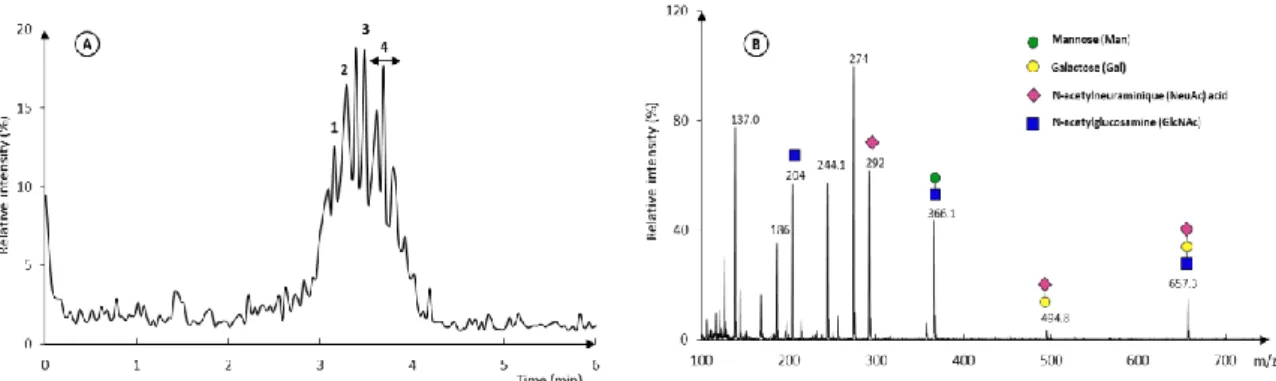
These two sets of parameters were used for the analysis of r-hCG. Figure 4A shows the corresponding BPE with the MS conditions adapted to the low mass range. Using a classical sheath liquid consisting of H2O-IPA (1/1) and 0.01% FA, at least 10 peaks were observed with an analysis time below 5 min. The decrease in analysis time, while increasing the separation length from the previous effective length in UV (51.5 cm) to the total capillary length in MS (60 cm), may come from small variations in the low electroosmotic velocity and from some suction effect [48]. The relative standard deviation values for the migration times and the intensities are summarized in Table 4 and are all inferior to 1.1% and 3,0%, respectively (n= 3), demonstrating a good repeatability of the CZE separation with at low mass range conditions of MS detection.
Table 4: Relative standard deviation (RSD) values of the migration times and the relative
intensity of 4 main peaks obtained for the r-hCG analysis by CZE-(TQ)MS with the optimized MS conditions for the low mass range (n=3). Other conditions and peak numbers: see Figure 4A. r-hCG: 500mgL-1.
Figure 4B shows the resulting MS spectrum obtained for peak 4 (between 3.75 and 3.83min). It allows identifying some fragment ions corresponding to monosaccharides, such as galactose (Gal, m/z 163 Da) , mannose (Man, m/z 163 Da), acetylneuraminic acid (NeuAc, m/z 292 Da), and acetylglucosamine (GlcNAc, m/z 204 Da) and some combinations. These monosaccharides confirm the presence of glycan chains on the glycoprotein. However, no detection of intact isoforms is possible within the targeted mass range.
Peak number 1 2 3 4
RSD(tm) (%) 0.96 0.95 0.98 1.02
19
Figure 4: CZE-MS analysis of r-hCG with the MS parameters for the low-mass range
(100-1000 m/z). (A) Base Peak Electropherogram (BPE). (B) MS spectrum between 3.75 and 3.83min (peak 4) on the BPE with the different diagnostic ions. r-hCG: 0.5 mg mL-1. Other conditions: see experimental section 2.2.4 and Table 1.
Therefore, r-hCG was next analysed by CZE-ESI-MS applying the high-mass range MS conditions. With the parameters of sheath liquid used above (H2O-IPA (1/1) + 0.01% FA), the obtained BPEs at the high-mass range MS conditions were non-repeatable and without isotopic profiles. However, it is well-known that the composition of the sheath liquid has a strong impact on the ionization process [22, 49]. This is why the sheath liquid composition was modified in order to improve the efficiency and repeatability of the ionization step. Moreover, the Triple Quadrupole (TQ) MS has a low maximum mass-to-charge ratio, namely 2000 m/z, which is rather low for the analysis of intact proteins. One of our purposes was thus also to increase as much as possible the ionization state charge of the hCG isoforms to decrease their m/z values.
Therefore, the percentage of FA in the sheath liquid was varied from 0.01 to 0.5%. An increase in sensitivity was observed at 0.1% (see Figure S3 in supplementary data), but still no repeatable electropherograms were obtained. In a second approach, the nature of the sheath liquid was altered from H2O-IPA to H2O-MeOH, while maintaining 0.1% FA and a ratio of 1/1. It led to an increased charge state and thus reduced m/z values and repeatable isotopic massifs in the 1000-2000 m/z range. Finally, the sheath-liquid flow rate was optimized as it is also known that this parameter affects the ionization process [49]. It was varied from 0.2 to 1.0 µl min-1. While applying a flow rate of 0.6 µl min-1, a stable spray and repeatable migration times were obtained with these MS parameters for the high-mass range (1000-2000 m/z).
20
Figure S3: Effect of FA percentage in the sheath liquid on the BPEs obtained from r-hCG by
CZE-MS for the high-mass range (1000-2000 m/z). r-hCG: 0.5 mg mL-1. Other conditions: see experimental section 2.2.4 and Table 1.
After optimization of the sheath liquid, the resulting r-hCG BPE showed at least 12 peaks between 4.25 and 5.01 min, corresponding to hCG isoforms with different glycosylations or PTMs (Figure 5A). It is worthwhile to notice the difference in migration times with the CZE separation obtained at the low mass range MS conditions (3.08-4.25 min, see Figure 4A). This is probably due to the different composition (H2O/MeOH/FA) of the sheath liquid, which can induce a suction effect.
These conditions were also used for the analysis of u-hCG, in order to evaluate the potential of this approach to distinguish some differences between the two drugs (Figure 5B). The separation profile showed two elution zones, the first one between 3.76 and 4.05 min, and the second one between 4.24 and 5.45 min, but the resolution is not insufficient here to distinguish individual peaks, probably due to the high complexity of the u-hCG sample. Figures 5C and 5D present the MS spectra between 4.24 and 5.01 min on the BPEs for r- and u-hCG-based drug, respectively. The m/z values corresponding to hCG isoforms of r-hCG are mainly comprised between 1500 and 1900, with three intense peaks at m/z 1530.6, 1562.2, and 1595.0. With u-hCG, the mass range of isoforms is different with m/z values comprised between 1400 and 1650. The differences between the two MS profiles confirm clearly the presence of different isoforms in each hCG-based drug, which probably results from their different sources of production (recombinant or extracted from the urine of pregnant women). Nevertheless, the identification of the r- and u-hCG isoforms is impossible due to the low resolution of the triple quadrupole MS detector. Indeed, the analysis of glycoproteins such as hCG with 8 glycosylation sites, requires an MS detector with a higher resolution, such as a quadrupole/time-of-flight (QTOF), to obtain the isotopic profiles of each isoform allowing a correct spectrum deconvolution for their identification. However, this CZE-(TQ)MS strategy
0 1 2 3 4 5 6 25 0.1 % FA 0.075 % FA 0.05 % FA 0.5 % FA 0.1 % FA 0.075 % FA 0.05 % FA 0.5 % FA Time (min) Re lat iv e in ten sity (% ) 50 75
21
is very promising for fingerprinting to compare different batches of a given hCG drug or different hCG-based drugs.
Figure 5: CZE-MS analysis of r-hCG and u-hCG with the MS parameters for the high-mass
range (1000-2000 m/z). Base Peak Electropherograms (BPE) of (A) r-hCG and (B) u-hCG. Mass spectra between 4.24 and 5.01 min on the BPEs of (C) r-hCG and (D) u-hCG. r-hCG and u-hCG: 0.5 mg mL-1. Other conditions: see experimental section 2.2.4 and Table 1.
Conclusion
In order to better characterize the heterogeneity of hCG, its analysis at the intact level by different high-performance capillary electrokinetic techniques (CGE-UV, CIEF-UV, CZE-UV, and CE-ESI-MS) was undertaken for the first time. This study confirmed the very high heterogeneity of hCG isoforms, leading to different pI and electrophoretic mobility values. After optimization of several experimental parameters, the CZE-MS analysis with a Triple Quadrupole detector demonstrates, for the first time, its potential for a fingerprinting approach as it allows to differentiating the two hCG-based drugs. In addition, this method is fast and cheap, compared to conventional bottom-up approaches. Therefore, a full validation of this method seems to be relevant as a perspective for this work. Finally, the conditions of the CZE method can be used for the hyphenation with a high-resolution mass spectrometer, such as a
22
QTOF, which should be helpful for the identification of the different isoforms (glycoforms and other PTMs).
Acknowledgments
The authors acknowledge the financial support from Institute Pierre Gilles de Gennes for microfluidic (IPGG, Paris, France).
23 References:
1. Fournier T, Guibourdenche J, Evain-Brion D (2015) Review: hCGs: different sources of production, different glycoforms and functions. Placenta 36 Suppl 1:S60-65 . doi: 10.1016/j.placenta.2015.02.002
2. Kessler MJ, Reddy MS, Shah RH, Bahl OP (1979) Structures of N-glycosidic carbohydrate units of human chorionic gonadotropin. J Biol Chem 254:7901–7908
3. Guibourdenche J, Burc L, Frendo J., Flament G, Kacprzak A, Bazot I, Jeanne P, Porquet D, Muller F (2002) Physiopathologie de l’hormone chorionique gonadotrope humaine (hCG) dans la trisomie 21 fœtale. Immuno-Anal Biol Spéc 17:2–10 . doi: 10.1016/S0923-2532(02)01159-6 4. Gromoll J, Eiholzer U, Nieschlag E, Simoni M (2000) Male hypogonadism caused by
homozygous deletion of exon 10 of the luteinizing hormone (LH) receptor: differential action of human chorionic gonadotropin and LH. J Clin Endocrinol Metab 85:2281–2286 . doi:
10.1210/jcem.85.6.6636
5. Kessler MJ, Mise T, Ghai RD, Bahl OP (1979) Structure and location of the O-glycosidic carbohydrate units of human chorionic gonadotropin. J Biol Chem 254:7909–7914
6. Liu L, Leaman D, Villalta M, Roberts RM (1997) Silencing of the gene for the alpha-subunit of human chorionic gonadotropin by the embryonic transcription factor Oct-3/4. Mol Endocrinol Baltim Md 11:1651–1658 . doi: 10.1210/mend.11.11.9971
7. Mechref Y, Muddiman DC (2017) Recent advances in glycomics, glycoproteomics and allied topics. Anal Bioanal Chem 409:355–357 . doi: 10.1007/s00216-016-0093-9
8. Diaz-Cueto L, Barrios-de-Tomasi J, Timossi C, Mendez JP, Ulloa-Aguirre A (1996) More in-vitro bioactive, shorter-lived human chorionic gonadotrophin charge isoforms increase at the end of the first and during the third trimesters of gestation. Mol Hum Reprod 2:643–650 . doi: 10.1093/molehr/2.9.643
9. Zhu H, Li X, Qu J, Xiao C, Jiang K, Gashash E, Liu D, Song J, Cheng J, Ma C, Wang PG (2017) Diethylaminoethyl Sepharose (DEAE-Sepharose) microcolumn for enrichment of glycopeptides. Anal Bioanal Chem 409:511–518 . doi: 10.1007/s00216-016-9937-6
10. Alagesan K, Khilji SK, Kolarich D (2017) It is all about the solvent: on the importance of the mobile phase for ZIC-HILIC glycopeptide enrichment. Anal Bioanal Chem 409:529–538 . doi: 10.1007/s00216-016-0051-6
11. Jiang H, Wu S-L, Karger BL, Hancock WS (2010) Characterization of the Glycosylation Occupancy and the Active Site in the Follow-on Protein Therapeutic: TNK-Tissue Plasminogen Activator. Anal Chem 82:6154–6162 . doi: 10.1021/ac100956x
12. Zhang Z, Pan H, Chen X (2009) Mass spectrometry for structural characterization of therapeutic antibodies. Mass Spectrom Rev 28:147–176 . doi: 10.1002/mas.20190
13. Sandra K, Moshir M, D’hondt F, Verleysen K, Kas K, Sandra P (2008) Highly efficient peptide separations in proteomics. J Chromatogr B 866:48–63 . doi: 10.1016/j.jchromb.2007.10.034 14. Zhu H, Qiu C, Ruth AC, Keire DA, Ye H (2017) A LC-MS All-in-One Workflow for
Site-Specific Location, Identification and Quantification of N-/O- Glycosylation in Human Chorionic Gonadotropin Drug Products. AAPS J 19:846–855 . doi: 10.1208/s12248-017-0062-z
24
15. Nerenz RD, Butch AW, Woldemariam GA, Yarbrough ML, Grenache DG, Gronowski AM (2016) Estimating the hCGβcf in urine during pregnancy. Clin Biochem 49:282–286 . doi: 10.1016/j.clinbiochem.2015.10.020
16. Lund H, Løvsletten K, Paus E, Halvorsen TG, Reubsaet L (2012) Immuno-MS based targeted proteomics: highly specific, sensitive, and reproducible human chorionic gonadotropin determination for clinical diagnostics and doping analysis. Anal Chem 84:7926–7932 . doi: 10.1021/ac301418f
17. Wuhrer M, de Boer AR, Deelder AM (2009) Structural glycomics using hydrophilic interaction chromatography (HILIC) with mass spectrometry. Mass Spectrom Rev 28:192–206 . doi: 10.1002/mas.20195
18. Liu C, Bowers LD (1997) Mass spectrometric characterization of nicked fragments of the beta-subunit of human chorionic gonadotropin. Clin Chem 43:1172–1181
19. Tran BQ, Barton C, Feng J, Sandjong A, Yoon SH, Awasthi S, Liang T, Khan MM, Kilgour DPA, Goodlett DR, Goo YA (2016) Comprehensive glycosylation profiling of IgG and IgG-fusion proteins by top-down MS with multiple fragmentation techniques. J Proteomics 134:93– 101 . doi: 10.1016/j.jprot.2015.10.021
20. Haselberg R, de Jong GJ, Somsen GW (2011) Capillary electrophoresis-mass spectrometry for the analysis of intact proteins 2007-2010. Electrophoresis 32:66–82 . doi:
10.1002/elps.201000364
21. Sinha S, Pipes G, Topp EM, Bondarenko PV, Treuheit MJ, Gadgil HS (2008) Comparison of LC and LC/MS methods for quantifying N-glycosylation in recombinant IgGs. J Am Soc Mass Spectrom 19:1643–1654 . doi: 10.1016/j.jasms.2008.07.004
22. Štěpánová S, Kašička V (2016) Recent applications of capillary electromigration methods to separation and analysis of proteins. Anal Chim Acta 933:23–42 . doi: 10.1016/j.aca.2016.06.006 23. Zhao SS, Chen DDY (2014) Applications of capillary electrophoresis in characterizing
recombinant protein therapeutics: CE and CEC. Electrophoresis 35:96–108 . doi: 10.1002/elps.201300372
24. Fekete S, Dong MW, Zhang T, Guillarme D (2013) High resolution reversed phase analysis of recombinant monoclonal antibodies by ultra-high pressure liquid chromatography column coupling. J Pharm Biomed Anal 83:273–278 . doi: 10.1016/j.jpba.2013.05.022
25. Staub A, Guillarme D, Schappler J, Veuthey J-L, Rudaz S (2011) Intact protein analysis in the biopharmaceutical field. J Pharm Biomed Anal 55:810–822 . doi: 10.1016/j.jpba.2011.01.031 26. Camperi J, Combes A, Guibourdenche J, Guillarme D, Pichon V, Fournier T, Delaunay N
(2018) An attempt to characterize the intact human chorionic gonadotropin protein by reversed phase liquid chromatography coupled with high-resolution mass spectrometry. J Pharm Biomed Anal, submitted
27. Magnelli PE, Bielik AM, Guthrie EP (2011) Identification and characterization of protein glycosylation using specific endo- and exoglycosidases. J Vis Exp. doi: 10.3791/3749 28. Gam L-H, Latiff A (2005) SDS-PAGE electrophoretic property of human chorionic
gonadotropin (hCG) and its beta-subunit. Int J Biol Sci 1:103–109
29. Sutton JM (2004) Charge variants in serum and urine hCG. Clin Chim Acta 341:199–203 . doi: 10.1016/j.cccn.2003.12.006
25
30. Hoermann R, Spoettl G, Grossmann M, Saller B, Mann K (1993) Molecular heterogeneity of human chorionic gonadotropin in serum and urine from patients with trophoblastic tumors. Clin Investig 71: . doi: 10.1007/BF00185610
31. Rustandi RR, Washabaugh MW, Wang Y (2008) Applications of CE SDS gel in development of biopharmaceutical antibody-based products. Electrophoresis 29:3612–3620 . doi:
10.1002/elps.200700958
32. Zhu Z, Lu JJ, Liu S (2012) Protein separation by capillary gel electrophoresis: A review. Anal Chim Acta 709:21–31 . doi: 10.1016/j.aca.2011.10.022
33. Fonslow BR, Kang SA, Gestaut DR, Graczyk B, Davis TN, Sabatini DM, Yates III JR (2010) Native Capillary Isoelectric Focusing for the Separation of Protein Complex Isoforms and Subcomplexes. Anal Chem 82:6643–6651 . doi: 10.1021/ac101235k
34. Morbeck DE, Madden BJ, McCormick DJ (1994) Analysis of the microheterogeneity of the glycoprotein chorionic gonadotropin with high-performance capillary electrophoresis. J Chromatogr A 680:217–224 . doi: 10.1016/0021-9673(94)80070-7
35. Durgaryan A, Rundlöf T, Lavén M, Amini A (2016) Identification of human chorionic
gonadotropin hormone in illegally distributed products by MALDI-TOF mass spectrometry and double-injection capillary zone electrophoresis. Anal Methods 8:4188–4196 . doi:
10.1039/C6AY01078D
36. Laidler P., Cowan D. A., Hider R. C., Kicman A. T. (2011) Characterization of Human
Chorionic Gonadotropin Microheterogeneity by Capillary Electrophoresis: Potential Application for Quality Control in the Pharmaceutical Industry. Pharm Pharmacol Commun 3:487–491 . doi: 10.1111/j.2042-7158.1997.tb00479.x
37. Thakur D, Rejtar T, Karger BL, Washburn NJ, Bosques CJ, Gunay NS, Shriver Z, Venkataraman G (2009) Profiling the Glycoforms of the Intact α Subunit of Recombinant Human Chorionic Gonadotropin by High-Resolution Capillary Electrophoresis−Mass Spectrometry. Anal Chem 81:8900–8907 . doi: 10.1021/ac901506p
38. Berger P, Lapthorn AJ (2016) The molecular relationship between antigenic domains and epitopes on hCG. Mol Immunol 76:134–145 . doi: 10.1016/j.molimm.2016.06.015
39. Shen Y, Smith RD (2000) High-resolution capillary isoelectric focusing of proteins using highly hydrophilic-substituted cellulose-coated capillaries. J Microcolumn Sep 12:135–141 . doi: 10.1002/(SICI)1520-667X(2000)12:3<135::AID-MCS2>3.0.CO;2-5
40. Williams BA, Vigh G (1996) Fast, Accurate Mobility Determination Method for Capillary Electrophoresis. Anal Chem 68:1174–1180 . doi: 10.1021/ac950968r
41. Belder D, Deege A, Husmann H, Kohler F, Ludwig M (2001) Cross-linked poly(vinyl alcohol) as permanent hydrophilic column coating for capillary electrophoresis. Electrophoresis 22:3813– 3818 . doi: 10.1002/1522-2683(200109)22:17<3813::AID-ELPS3813>3.0.CO;2-D
42. Hoseby N-E, Mortensen B, Smedsrød B (1993) Clearance of circulating γ-glutamyltransferase by the hepatic galactose receptor. Variability in clearance rate due to carbohydrate heterogeneity of the enzyme. Biochim Biophys Acta BBA - Gen Subj 1156:283–287 . doi: 10.1016/0304-4165(93)90043-8
43. Berger P, Sturgeon C, Bidart JM, Paus E, Gerth R, Niang M, Bristow A, Birken S, Stenman UH (2002) The ISOBM TD-7 Workshop on hCG and related molecules. Towards user-oriented standardization of pregnancy and tumor diagnosis: assignment of epitopes to the
three-26
dimensional structure of diagnostically and commercially relevant monoclonal antibodies directed against human chorionic gonadotropin and derivatives. Tumour Biol J Int Soc Oncodevelopmental Biol Med 23:1–38 . doi: 48686
44. Haselberg R, de Jong GJ, Somsen GW (2013) CE-MS for the analysis of intact proteins 2010-2012: CE and CEC. Electrophoresis 34:99–112 . doi: 10.1002/elps.201200439
45. Staub A, Comte S, Rudaz S, Veuthey J-L, Schappler J (2010) Use of organic solvent to prevent protein adsorption in CE-MS experiments. Electrophoresis 31:3326–3333 . doi:
10.1002/elps.201000245
46. Balaguer E, Demelbauer U, Pelzing M, Sanz-Nebot V, Barbosa J, Neusüss C (2006) Glycoform characterization of erythropoietin combining glycan and intact protein analysis by capillary electrophoresis electrospray time-of-flight mass spectrometry. Electrophoresis 27:2638–2650 . doi: 10.1002/elps.200600075
47. Balaguer E, Neusüss C (2006) Glycoprotein Characterization Combining Intact Protein and Glycan Analysis by Capillary Electrophoresis-Electrospray Ionization-Mass Spectrometry. Anal Chem 78:5384–5393 . doi: 10.1021/ac060376g
48. Mokaddem M, Gareil P, Belgaied J-E, Varenne A (2008) A new insight into suction and dilution effects in capillary electrophoresis coupled to mass spectrometryvia an electrospray ionization interface. Part I-Suction effect. Electrophoresis 29:1957–1964 . doi: 10.1002/elps.200700880 49. Haselberg R, de Jong GJ, Somsen GW (2007) Capillary electrophoresis–mass spectrometry for
the analysis of intact proteins. J Chromatogr A 1159:81–109 . doi: 10.1016/j.chroma.2007.05.048