RESEARCH OUTPUTS / RÉSULTATS DE RECHERCHE
Author(s) - Auteur(s) :
Publication date - Date de publication :
Permanent link - Permalien :
Rights / License - Licence de droit d’auteur :
Bibliothèque Universitaire Moretus Plantin
Institutional Repository - Research Portal
Dépôt Institutionnel - Portail de la Recherche
researchportal.unamur.be
University of Namur
Monte Carlo calculation of radioimmunotherapy with 90Y-, 177Lu-, 131I-, 124I-, and
188Re-Nanoobjects: Choice of the best radionuclide for solid tumour treatment by
using TCP and NTCP concepts
Lucas, S.; Feron, O.; Gallez, B.; Masereel, B.; Michiels, C.; Vander Borght, T.
Published in:Computational and Mathematical Methods in Medicine
DOI:
10.1155/2015/284360 Publication date:
2015
Document Version
Publisher's PDF, also known as Version of record
Link to publication
Citation for pulished version (HARVARD):
Lucas, S, Feron, O, Gallez, B, Masereel, B, Michiels, C & Vander Borght, T 2015, 'Monte Carlo calculation of radioimmunotherapy with 90Y-, 177Lu-, 131I-, 124I-, and 188Re-Nanoobjects: Choice of the best radionuclide for solid tumour treatment by using TCP and NTCP concepts', Computational and Mathematical Methods in
Medicine, vol. 2015, 284360. https://doi.org/10.1155/2015/284360
General rights
Copyright and moral rights for the publications made accessible in the public portal are retained by the authors and/or other copyright owners and it is a condition of accessing publications that users recognise and abide by the legal requirements associated with these rights. • Users may download and print one copy of any publication from the public portal for the purpose of private study or research. • You may not further distribute the material or use it for any profit-making activity or commercial gain
• You may freely distribute the URL identifying the publication in the public portal ?
Take down policy
If you believe that this document breaches copyright please contact us providing details, and we will remove access to the work immediately and investigate your claim.
Research Article
Monte Carlo Calculation of Radioimmunotherapy with
90
Y-,
177
Lu-,
131
I-,
124
I-, and
188
Re-Nanoobjects: Choice of the Best
Radionuclide for Solid Tumour Treatment by Using TCP and
NTCP Concepts
S. Lucas,
1,2O. Feron,
3B. Gallez,
4B. Masereel,
2,5C. Michiels,
2,6and T. Vander Borght
2,71Research Centre for the Physics of Matter and Radiation (PMR), University of Namur, 61 Rue de Bruxelles, 5000 Namur, Belgium 2NAmur Research Institute for LIfe Sciences (NARILIS), University of Namur, 61 Rue de Bruxelles, 5000 Namur, Belgium 3Pharmacology and Therapeutics Unit (FATH), Institute of Experimental and Clinical Research (IREC),
Universit´e Catholique de Louvain (UCL), 53 Avenue Mounier, 1200 Brussels, Belgium
4Biomedical Magnetic Resonance Group (REMA), Louvain Drug Research Institute, Universit´e Catholique de Louvain (UCL),
73 Avenue Mounier, 1200 Brussels, Belgium
5Namur Medicine and Drug Innovation Center (NAMEDIC), University of Namur, 61 Rue de Bruxelles, 5000 Namur, Belgium 6Unit´e de Recherche en Biologie Cellulaire (URBC), University of Namur, 61 Rue de Bruxelles, 5000 Namur, Belgium
7Centre for Molecular Imaging, Radiotherapy and Oncology (MIRO), Institute of Experimental and Clinical Research (IREC),
Universit´e Catholique de Louvain (UCL), 1 Dr. G. Therasse, 5530 Yvoir, Belgium
Correspondence should be addressed to S. Lucas; [email protected]
Received 8 July 2014; Accepted 27 October 2014
Academic Editor: Mario Bernal
Copyright © 2015 S. Lucas et al. This is an open access article distributed under the Creative Commons Attribution License, which permits unrestricted use, distribution, and reproduction in any medium, provided the original work is properly cited.
Radioimmunotherapy has shown that the use of monoclonal antibodies combined with a radioisotope like131I or90Y still remains ineffective for solid and radioresistant tumour treatment. Previous simulations have revealed that an increase in the number of
90Y labelled to each antibody or nanoobject could be a solution to improve treatment output. It now seems important to assess the
treatment output and toxicity when radionuclides such as90Y,177Lu,131I,124I, and188Re are used. Tumour control probability (TCP) and normal tissue complication probability (NTCP) curves versus the number of radionuclides per nanoobject were computed with MCNPX to evaluate treatment efficacy for solid tumours and to predict the incidence of surrounding side effects. Analyses were carried out for two solid tumour sizes of 0.5 and 1.0 cm radius and for nanoobject (i.e., a radiolabelled antibody) distributed uniformly or nonuniformly throughout a solid tumour (e.g., Non-small-cell-lung cancer (NSCLC)).90Y and188Re are the best candidates for solid tumour treatment when only one radionuclide is coupled to one carrier. Furthermore, regardless of the radionuclide properties, high values of TCP can be reached without toxicity if the number of radionuclides per nanoobject increases.
1. Introduction
Radioimmunotherapy uses radionuclides labelling of mon-oclonal antibodies (mAbs) to deliver ionizing radiation to tumour cells. Efficacy and toxicity of the treatment are mainly influenced by the antibodies biokinetics and biodistribution but also by radionuclides physical properties. Today, various 𝛽-emitters coupled to mAbs are being tested and compared
to eradicate tumour tissues. If this technique is well adapted to treat radiosensitive hematopoietic malignancies, clinical studies have always shown poor therapeutic effects on solid and radioresistant tumours. Almost no clinical trials on patients with colorectal, ovarian, gastric, pancreatic, prostate, and breast cancer went beyond phase II [1]. This lack of success might be partly explained by the fact that these solid tumours are less sensitive to ionizing radiation and require
Volume 2015, Article ID 284360, 15 pages http://dx.doi.org/10.1155/2015/284360
doses larger than 60 Gy to be sterilised [2]. Today, numer-ous research studies are focused on optimizing radioim-munotherapy by increasing the absorbed doses through a better accumulation or a better penetration of radiolabelled antibodies. But doses still remain insufficient to trigger a good treatment response [3,4].
Another solution to maximize the deposited doses inside the solid tumour would be to increase the number of radionuclides coupled to each antibody. Today, the coupling is performed either by covalently binding the radionuclide directly to the antibody or by crosslinking through a chelating agent or chemical linker. These labelling procedures often lead to a variable amount of radionuclides per antibody and a too large number of radionuclides per mAb may impair the antibodies immunoreactivity, leading to lower tumour accumulation and higher liver uptake [5,6].
To preserve immunoreactivity, one could imagine to synthesize a nanoobject (NO) made of a nanoparticle (NP) containing a large number of radionuclides, which is coupled to each antibody. Indeed, it is now possible to assemble nonradioactive and radioactive atoms to form radioactive nanoparticles (NPs) [7–9]. In order to prevent their aggre-gation and to maintain their stability within a biological environment, the surface of these radioactive NPs can be coated with polymeric macromolecules such as plasma poly-merized allylamine (PPAA), polyethylene glycol (PEG), or polysaccharide glycoprotein (Arabic gum) [10, 11]. These types of macromolecules can also prevent radioactive atoms from leaching. Moreover, NPs offer a large surface capable of accommodating more than one antibody per particle, making enhancement of uptake of these NPs inside or around the tumour possible [11]. Another solution would be to synthesize another NO made of a biocompatible nanoparticle coupled to more than one radiolabelled antibody. Experiments using this kind of nanoobjects have recently shown that they could be used for efficient cancer treatment. Indeed, in vivo imaging on animals has proved that they are preferentially distributed in the tumour mass after injection and that they present an in vivo pharmacokinetic profile very similar to that of uncoupled antibodies [12,13].
In a first paper [14], absorbed doses (𝐷) deposited by NOs made of antibodies coupled with nanoparticles containing several 𝛽-emitters90Y were simulated by using the Monte Carlo particle transport code MCNPX (Monte Carlo N-Particle eXtended). Dose values were calculated according to a new model of spherical solid tumors in which the antibodies could be distributed uniformly, linearly, or exponentially inside the tumor volume. Preliminary results showed that viable tumor cells received absorbed doses larger than 50 Gy everywhere inside the tumor. In a second paper, the good therapeutic efficacy of these 90Y-NPs against non-small-cell lung cancer (NSCLC) was theoretically confirmed by determining the biological effective dose (BED) and tumor control probability (TCP) [15]. NSCLC is a good example of fast growing and radioresistant carcinoma with important hypoxic areas. BED and TCP values took into account the radiosensitivity of the targeted tissues, the doubling time of the cancer cells, the repair process of sublethal damage taking place between two irradiations, and the effect of hypoxia
for which the radiosensitivity changes according to whether cells are anoxic or well-oxygenated. Early stage NSCLC is usually treated surgically, although stereotactic body radia-tion therapy (SBRT) may represent a good alternative when inoperable [16–19]. Unfortunately, this fast growing tumour is often diagnosed when already disseminated.
The main objective of this paper is to model the thera-peutic efficacy and the complication risks of the surrounding tissue when the NOs are filled with other𝛽-emitters targeting tumour cells. The assumption is that the NOs are well targeting the metastases, but the energy deposition may be influenced by the distribution inside the tumour deposits as well as the NOs radioisotope concentration.
The first part of this paper will compare dose profiles for five different𝛽-emitters (90Y,188Re,177Lu,124I, and131I) to see which one is the most efficient for treatment when only one radionuclide is coupled to each antibody. The second part is to establish, for the five different 𝛽-emitters, the relationship between TCP and NTCP when the number of radioactive atoms per NO varies. TCP and NTCP curves were analyzed for three types of NO distributions (uniform, linear, and exponential), with a tumoral biological half-life of 6 days and for two tumour sizes (0.5 cm and 1.0 cm radii). For each TCP curve, the lowest number of radioactive atoms per NO required to obtain a maximum TCP of 100% will be determined, as well as the total doses deposited inside the tumours and deposited in the surrounding tissues.
It has to be noted that it is not the intention of this paper either to determine the amount of activity to administer to a patient or to establish a treatment planning (for that purpose, please see the review given by [20]). Instead, one has to consider our results as advised to researchers who want to develop NO-based radioimmunotherapy.
2. Material and Methods
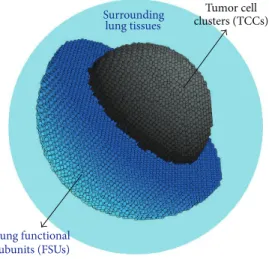
For our simulations with the MCNPX software, the NSCLC tumour is represented by a sphere subdivided into a set of 250𝜇m radius spherical tumour cell clusters (TCCs) arranged in a simple cubic lattice structure as represented inFigure 1 [15]. The surrounding lung tissue is described by a 4.0 cm thick spherical shell also subdivided into small 250𝜇m radius spherical functional subunits (FSUs) also arranged in a cubic lattice. The composition and density of each cell unit are taken from ICRU-44 soft tissue for the TCCs and from ICRU-44 lung tissue for the FSUs.
For our geometric model, we also assume that the FSU and TCC are surrounded by blood vessels which could be either a new blood network created through angiogenesis or simply the preexisting vasculature. Consequently the radiolabelled antibodies or the radioactive nanoobjects can penetrate within the lung tissues or the tumour and surround the different cell units. So, the surface of each TCC and each FSU becomes a potential source of radiation characterized by a probability of emission. The latter will be similar for all FSUs, meaning that the distribution of the NO in the spherical shell is uniform. Inversely, for the tumour, the probability of emission can be similar for all TCCs or can
Lung functional subunits (FSUs) Tumor cell clusters (TCCs) Surrounding lung tissues
Figure 1: Three-dimensional representation of a NSCLC tumour surrounded by lung shell. The tumour sphere is subdivided into 250𝜇m diameter spherical tumour cell clusters (TCCs) and the lung shell is subdivided into 250𝜇m diameter functional subunits (FSUs).
decrease linearly and exponentially from the surface towards the tumour centre. Finally, if the targeting function of the antibodies is preserved, the TCC emission probability should be higher than the FSU emission probability. According to the experimental results given by Wiseman et al. [21], for patients with non-Hodgkin’s lymphoma (NHL) treated with
90Y Zevalin, the mean tumour-to-lung deposited dose ratio
corresponded to 7, meaning that the doses absorbed by the tumours are seven times higher than the doses deposited in lung tissues. The mean tumour volume value was 42.5 cm3. So, for our simulations, we have assumed that the TCC emission probability is seven times more important than the lung FSU emission probability.
In this work, the treatment of small NSCLC tumours by RIT will be investigated for five different radionuclides according to MCNPX simulations: one pure𝛽-emitter (90Y), two 𝛽-emitters with a low-abundance 𝛾 (177Lu and 188Re), and two 𝛽-emitters with a higher 𝛾 abundance (131I and
124I).131I is the most extensively used radionuclide in RIT
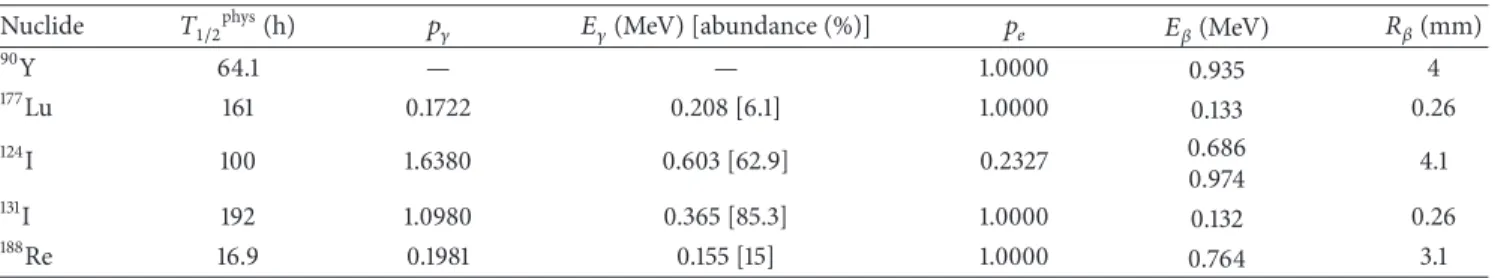
because of its availability, its ease for chemical conjugation, and its ability to perform 𝛾 imaging and 𝛽 therapeutic studies with the same biological vector.131I- and90Y-labelled mAbs are mainly used to treat patients with NHL. However, numerous phase I-II clinical trials have been reported for patients with solid tumours [22]. Despite the high-energy 𝛽-particles emitted by the188Re, the clinical trials done with this radionuclide only concern the treatment of patients with haematological malignancies [23,24]. Inversely, the efficacy of the low-energy𝛽-emitter177Lu was only assessed to treat solid tumours such as ovarian or prostate cancer [25–27]. More recently, numerous research studies into 124I have been investigated because this high-energy positron-emitting radionuclide is suitable for PET imaging and radioiodine therapy [28,29]. The main physical properties of these five radionuclides are detailed inTable 1. 𝑇1/2phys is the physical half-life of the five different radionuclides. 𝑝𝛾 and 𝑝𝑒 give,
respectively, the number of 𝛾 and electrons emitted per disintegration.𝐸𝛾 is the energy of the main𝛾 emission. 𝛾-energies and emission probabilities for177Lu,188Re,124I, and
131I were obtained from the website http://laraweb.free.fr/.
Positron emissions for 124I and their specific abundance were taken from reference [30]. 𝐸𝛽 represents the mean energy of particles emitted per disintegration. The 𝛽-spectra for the four different radionuclides were taken from the database on the RADAR site (http://www.doseinfo-radar .com/RADARDecay.html, October 2013). Finally, 𝑅𝛽 gives the mean𝛽-particle range in soft tissues.
While90Y is a pure𝛽-emitter, the four other radionuclides emit photons which can also interact with the biological matter inside the tumour to give birth to secondary electrons or𝛾 with smaller energies. The MCNPX code is capable of studying the electron transport through matter by taking into account the loss of energy, multiple scattering angles, and “bremsstrahlung.” All these physical processes are considered by using the photon-electron mode and the default PHYS cards for electron and photons. When the different types of radiations emitted per disintegration are taken into account, the total absorbed dose to medium was determined by formula(1)[31]: 𝐷 (𝑟) = 21.34 × 𝐸tot(𝑟) × 1 𝜌 × 𝐴 𝜆eff ; 𝐸tot= (∑ 𝑖 𝐸𝑖(𝑟) × 𝑝𝑖) , (1)
where𝐸tot(𝑟) is the total deposited energy per unit of volume
and per disintegration for the different distances “𝑟” from the tumour centre determined by using the SMESH tally from MCNPX. This tally builds virtual concentric spherical shells superimposed on the geometry of the tumour surrounded by healthy lung tissues and defines the average energy, in MeV/cm3, and per emitted particle (electron or gamma) deposited into each shell located at different distances “𝑟” from the tumour centre [14,15]. The shell thickness chosen for our simulations is 0.05 cm. For188Re,131I,124I, and177Lu, 𝐸tot(𝑟) was calculated by adding deposited energies, 𝐸𝑖(𝑟),
for𝛾 and 𝛽 decays. The number of particle histories (NPS) was chosen to obtain an energy deposition per shell volume with a statistical uncertainty below 5% (1 SD). All physical processes were taken into account by choosing the photon-electron mode (MODE P E) and the default PHYS cards with a lower cut-off value for electrons and photons at 0.005 MeV. 𝑝𝑖 are the total number of particles (electrons or gammas) emitted per disintegration. Values of𝑝𝑖for𝛽 and 𝛾 decays and for the different radionuclides are given inTable 1. The total energy deposited in each spherical shell must still be divided by the density (𝜌, in g/cm3) of the materials used to model the tumour or its surrounding healthy tissue to obtain the average energy per unit of mass and per emitted particle.𝜆eff
is the effective decay constant, assuming a monoexponential decay. This value is calculated by adding the physical decay constant (𝜆phys = ln(2)/𝑇1/2phys) and the biological clearance
Table 1: Physical characteristics of the different radionuclides studied in this work.
Nuclide 𝑇1/2phys(h) 𝑝
𝛾 𝐸𝛾(MeV) [abundance (%)] 𝑝𝑒 𝐸𝛽(MeV) 𝑅𝛽(mm)
90Y 64.1 — — 1.0000 0.935 4 177Lu 161 0.1722 0.208[6.1] 1.0000 0.133 0.26 124I 100 1.6380 0.603[62.9] 0.2327 0.686 0.974 4.1 131I 192 1.0980 0.365[85.3] 1.0000 0.132 0.26 188Re 16.9 0.1981 0.155[15] 1.0000 0.764 3.1
Table 2: Biological parameters used for TCP calculations for NSCLC tumour and healthy lung tissue.
Biological factors Tumour Healthy tissues
Tumoral tissues References Healthy tissues References 𝑇1/2 bio[d] 2–6 [21] 3 [21] 𝛼/𝛽 [Gy] 10 [38], [34,39,40] 3 [38], [34,39,40] 𝜇 [h−1] 1.39 [38,41] 0.46 [34,38,42] 𝛼 [Gy−1] 0.35 [39] 0.031 [43] Cellular density [#/cm3] 9.5 × 10⁷ [44] 9.5 × 10⁷ [44]
rate constant (𝜆bio = ln(2)/𝑇1/2biol). While the physical
half-life is well established (Table 1), the biological half-life of the radiolabelled antibodies is more difficult to determine (Table 2). The ratio A/𝜆effrepresents the cumulated activity
by assuming an instantaneous antibody uptake and clearance at a specific biological half-life𝑇bio. The total activity𝐴 inside
the tumours and surrounding healthy tissues is calculated according to the following expression:
𝐴 = 𝜆phys× 𝑛𝑢× 𝑛𝑎× 𝑛mAb, (2)
where𝑛𝑢represents the total number of cell clusters.𝑛mAb
corresponds to the maximal number of radiolabelled mon-oclonal antibodies capable of binding each cell cluster. Its value is determined by multiplying the surface of the cell unit by a mean 109mAb/cm2 covering fraction (surface antigen concentration). The latter is defined as the number of bound antibodies per tumour surface unit and its value usually varies between 108and 1010mAb/cm2[32]. Finally,𝑛𝑎is the number of radioactive atoms per NO if direct uptake is assumed.𝑛𝑎 equals 1 if one NO contains one single radioactive atom. Note, however, that𝑛𝑎in each NO could be reduced by applying the exponential radioactive decay law if we take into account that several days (about 2 days) are usually required for antibody maximum accumulation within the tumour [33].
To investigate how TCP and NTCP distributions evolve with an increasing number of radionuclide contained in each NO,𝐷(𝑟) is first converted into the biologically effective dose BED(𝑟) according to formula (3)previously published and based on the linear-quadratic model [15]:
BED(𝑟) = 𝐷 (𝑟) + 𝜆eff (𝜆eff+ 𝜇)
𝐷 (𝑟)2
𝛼/𝛽 , (3)
where𝜇, in h−1, is the exponential rate constant quantifying the rate of sublethal damage repair [34].𝛼 and 𝛽, expressed in Gy−1 and Gy−2, respectively, are cellular radiosensitivities
determined from cell survival curves. All biological param-eters required to determine TCP and NTCP are listed in Table 2. They are assumed uniform throughout the NSCLC tumour and the lung healthy tissues for our calculations.
TCP, defined as the probability that no tumour cell cluster inside the NSCLC tumour survives irradiation, is obtained by multiplying all the shell control probability values (SCP(𝑟)) from the tumour centre (𝑟 = 0) to the tumour surface (𝑟 = 𝑟𝑇)
TCP= 𝑟𝑇 ∏ 𝑟=0 SCP(𝑟) = 𝑟𝑇 ∏ 𝑟=0 (𝑝TCC(𝑟))𝐾𝑟, (4)
where SCP(𝑟) gives the probability that no tumour cell cluster inside each spherical mesh located at a distance𝑟 from the tumour centre survives irradiation.𝐾𝑟is the number of TCC within the concentric spherical shell located at a distance “𝑟” from the tumour centre and𝑃TCCis the probability to kill a
TCC determined by the Poisson expression:
𝑝TCC(𝑟) = exp {−𝑁Cells⋅ exp {−𝛼TCC⋅ BED (𝑟)}} , (5)
where𝛼 is the tumour cell radiosensitivity and 𝑁Cellsis the
number of tumour cells inside each TCC before irradiation obtained by multiplying the density𝜌 fromTable 2with the TCC volume.
To assess the risk of pneumonitis after RIT treatment, TCP curves will be compared to three different NTCP mod-els. The first one is the phenomenological Lyman-Kutcher-Burman (LKB) model expressed by
NTCPLKB= 1 √2𝜋∫ 𝑡 −∞𝑒 −𝑥2/2 𝑑𝑥 with 𝑡 = MLD𝑚 ⋅ TD− TD50 50 , (6) where TD50, in Gy, represents the dose for a 50% complica-tion rate,𝑚 controls the NTCP curves slope, and MLD gives the mean lung dose deposited into the pair of lungs. TD50 and 𝑚 have never been determined for RIT. So we chose
to use the values given by Seppenwoolde et al. for external radiotherapy, that is, a TD50= 30.8 Gy and𝑚 = 0.37 [35]. For the MLD, we assumed that the dose deposited into a 4.0 cm thick lung shell corresponded to the MLD deposited in both lungs.
The second NTCP model used in this paper for describing the risk of pneumonitis a few months after treatment is the relative seriality model (SER), initially proposed by K¨allman et al. [36,37]
NTCPSER= [1 − (1 − 𝑝FSU𝑠 )𝐾Lg] 1/𝑠
, (7)
where “𝑠” is the degree of seriality for the lung organ. Usually, its value is close to zero with𝑠 = 0.0061. 𝐾Lgequals 76 394 192
and represents the total number of FSUs in the whole lung. This value was obtained by dividing a mean lung volume of 5000 cm3by the volume of one FSU.𝑝FSUis the probability
of damaging one FSU, calculated with a similar expression to (5), except that𝑁Cellis the number of cells in one FSU before
its irradiation and𝛼 is the lung tissue radiosensitivity. 𝑁Cell
and𝛼 are given inTable 2. BED(𝑟) in expression(5)will also be replaced by a mean value of the BED within a 4.0 cm thick lung spherical shell.
Finally, TCP curves will also be compared to a third NTCP model for which a minimum number of FSUs (also called tissue rescue units, TRUs) exist and maintain the whole organ function. So, in this last model, we assume that complication rises when all TRUs within the lungs are killed:
NTCPTRU
=
𝑟Lg
∏
𝑟>𝑟𝑇
exp{−𝑁TRU(𝑟)⋅ exp {−𝛼FSU⋅ BED (𝑟) ⋅ V𝑐}} ,
(8)
where𝑁𝑟gives the initial number of TRU in each spherical shell located at a distance “𝑟” from the tumor center and 𝛼 describes FSU radiosensitivity; BED(𝑟) is the biological effective dose at a distance “𝑟” from the tumour centre; 𝑐 reflects the volume effects;V is the fractional partial volume defined by the ratio 𝑁tot/𝑁Lg (𝑁tot is the total number of
TRUs and 𝑁Lg is the number of TRUs within the pair of
lungs);𝑁𝑟is the number of TRUs at a distance “𝑟” from the tumour centre;𝑟Lgis the distance from the tumor center of
the last spherical lung tumor shell, and𝑐 = −0.98.
3. Results and Discussions
3.1.𝐷(𝑟) and SCP(𝑟) Calculations When One Radionuclide Is Labelled to Each Antibody. In this section, absorbed doses to
medium,𝐷(𝑟), and shell control probability, SCP(𝑟), as func-tions of the distance “𝑟” from the tumour centre have been compared for the five different radionuclides:90Y,177Lu,131I,
124I, and188Re. We assume here that only one radionuclide
is coupled to each antibody and that the five radionuclides are separately conjugated to antibodies with similar biological properties, such as binding affinity, covering fraction, and biological half-life. Results will be investigated to treat two small NSCLC tumour sizes (0.5 and 1.0 cm radii) filled with uniform, linear, or exponential antibody distribution. Rapid
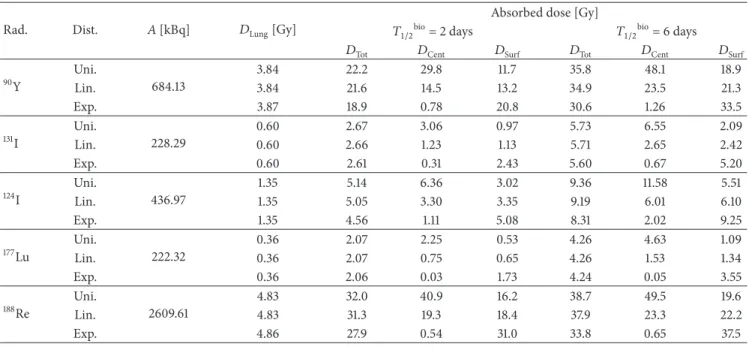
and slow antibody clearances from the tumour are taken into consideration by assuming two different biological half-lives of 2 and 6 days. Tables3and 4give the values of the total doses (𝐷Tot), in Gy, absorbed by the 0.5 and 1.0 cm
radii tumours, respectively. These total absorbed doses were obtained according to formula (1)for which the deposited energy 𝐸𝑖(𝑟) was calculated with the MCNPX software by considering a virtual sphere with a diameter equivalent to the tumour size. Deposited doses in the centre (𝐷Cent) and at the
surface (𝐷Surf) of the NSCLC tumour were also presented in
these tables.𝐷Lungrepresents the average dose deposited in
the 4.0 cm thick lung tissue shell around the tumour. This value enables treatment impact assessment on the healthy lung FSUs surrounding the tumour. By extension, we assume that it is the average dose deposited in the whole organ. This assumption probably overestimates the absorbed doses in lungs because the highest doses in RIT are mainly localized in the tumour vicinity. Finally, the three first columns of Tables 3and4specify the type of radionuclide (Rad.), the shape of antibody distribution (Dist.), and the activities (𝐴), in kBq, calculated according to formula (2) with a mean covering fraction of 109mAbs/cm2.
3.1.1. For 0.5 cm Radius Tumours. Doses deposited at
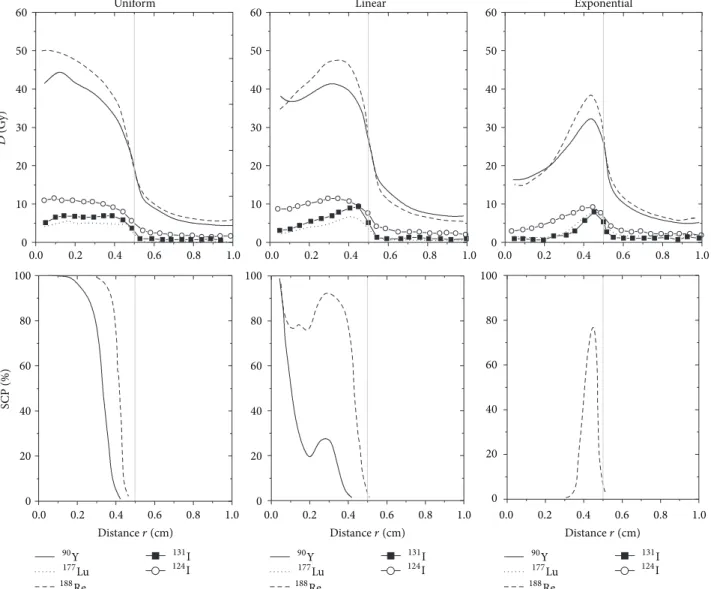
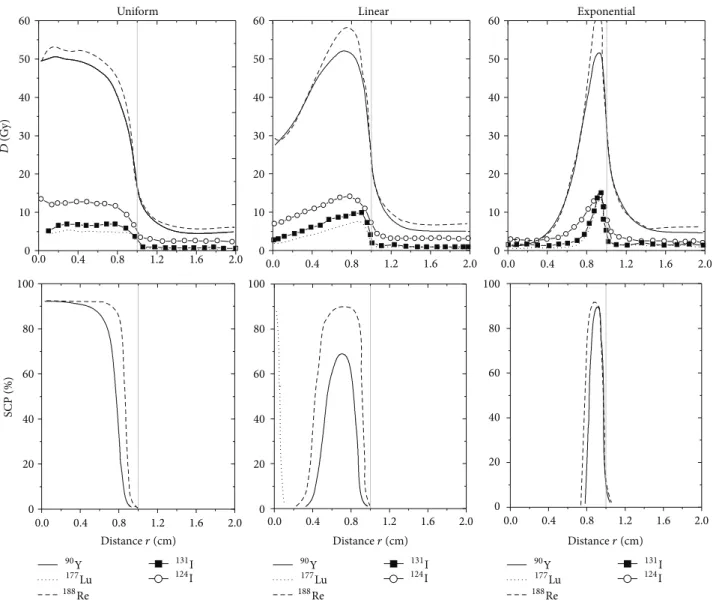
dif-ferent distances “𝑟” from the tumour centre for the five different radionuclides and for the three possible antibody distributions are represented inFigure 2when the biological half-life of the antibodies is set to 6 days. The highest values for deposited doses are found in the tumour centre when the antibody distribution is uniform, in the tumour middle when the antibodies are distributed linearly, and near the intratumoural surface for the exponential antibody distribu-tion. Furthermore, due to the crossfire effect, the deposited doses inside the tumour for a uniform distribution of90 Y-and 188Re-labelled antibodies increase from the surface to the tumour centre. Inversely, the plateau and the sharpness of the falloff near the tumour surface for the absorbed dose of177Lu or131I are due to shorter emission ranges in lung tissues. As shown inTable 3, larger doses are deposited inside the tumour for the five radionuclides when the time lapse before the radiolabelled antibodies clearance increases.
The lowest values of the deposited doses inside the tumour are located at the tumour surface or in the tumour centre, depending on the radionuclide and the mAb dis-tribution. If we look at Table 3, 𝐷Surf is lower than 𝐷Cent
when the five different radionuclides are distributed uni-formly throughout the tumour, meaning that the minimum deposited doses are found at the tumour surface. Inversely, 𝐷Cent is lower than𝐷Surf when the radiolabelled antibodies
are distributed exponentially within the tumour. The situa-tion is more complicated for linear mAb distribusitua-tion. Indeed, the minimum deposited doses are localized at the tumour surface for high-energy𝛽-emitters (90Y,188Re, and134I) and in the tumour centre for low-energy 𝛽-emitters (131I and
177Lu).
Whereas strong variations of 𝐷Cent and 𝐷Surf appear
between the three different antibody distributions,𝐷totseems
Table 3: Comparison of the total absorbed dose (𝐷Tot), absorbed doses in the centre (𝐷Cent), and absorbed doses at the surface (𝐷Surf) or
surrounding the tumour (𝐷Lung), in Gy, when90Y,177Lu,131I,124I, and188Re are separately linked to antibodies distributed uniformly, linearly,
and exponentially inside a 0.5 cm radius spherical tumour. Two different biological half-lives of 2 and 6 days are considered here.
Rad. Dist. 𝐴 [kBq] 𝐷Lung[Gy]
Absorbed dose [Gy] 𝑇1/2bio= 2 days 𝑇
1/2bio= 6 days
𝐷Tot 𝐷Cent 𝐷Surf 𝐷Tot 𝐷Cent 𝐷Surf
90Y Uni. 87.32 4.17 19.15 27.03 13.12 30.94 43.67 21.19 Lin. 4.18 18.41 18.69 13.98 29.75 30.20 22.59 Exp. 4.18 16.85 10.22 16.88 27.23 16.52 27.28 131I Uni. 29.23 0.64 2.67 3.16 1.63 5.73 6.78 3.49 Lin. 0.64 2.65 1.65 1.91 5.68 3.55 4.10 Exp. 0.64 2.58 0.42 3.14 5.53 0.90 6.72 124I Uni. 55.87 1.46 4.54 6.12 3.24 8.27 11.15 5.91 Lin. 1.46 4.39 4.17 3.47 8.00 7.60 6.32 Exp. 1.46 4.04 2.03 4.09 7.36 3.70 7.44 177Lu Uni. 0.94 0.38 2.16 2.61 1.22 4.44 5.37 2.52 Lin. 0.38 2.15 1.18 1.50 4.43 2.43 3.09 Exp. 0.38 2.12 0.16 2.70 4.35 0.34 5.55 188Re Uni. 34.78 5.22 28.87 40.32 19.15 34.90 48.74 23.15 Lin. 5.22 27.87 27.02 20.92 33.70 32.66 25.29 Exp. 5.23 25.49 12.90 26.05 30.82 15.60 31.49
Computed dose error is estimated to 5% (1 SD).
Table 4: Comparison of the total absorbed dose (𝐷Tot), absorbed doses in the centre (𝐷Cent), and absorbed doses at the surface (𝐷Surf) or
surrounding the tumour (𝐷Lung), in Gy, when90Y,177Lu,131I,124I, and188Re are separately linked to antibodies distributed uniformly, linearly,
and exponentially inside a 1.0 cm radius spherical tumour. Two different biological half-lives of 2 and 6 days are considered here.
Rad. Dist. 𝐴 [kBq] 𝐷Lung[Gy]
Absorbed dose [Gy] 𝑇1/2bio= 2 days 𝑇
1/2bio= 6 days
𝐷Tot 𝐷Cent 𝐷Surf 𝐷Tot 𝐷Cent 𝐷Surf
90Y Uni. 684.13 3.84 22.2 29.8 11.7 35.8 48.1 18.9 Lin. 3.84 21.6 14.5 13.2 34.9 23.5 21.3 Exp. 3.87 18.9 0.78 20.8 30.6 1.26 33.5 131I Uni. 228.29 0.60 2.67 3.06 0.97 5.73 6.55 2.09 Lin. 0.60 2.66 1.23 1.13 5.71 2.65 2.42 Exp. 0.60 2.61 0.31 2.43 5.60 0.67 5.20 124I Uni. 436.97 1.35 5.14 6.36 3.02 9.36 11.58 5.51 Lin. 1.35 5.05 3.30 3.35 9.19 6.01 6.10 Exp. 1.35 4.56 1.11 5.08 8.31 2.02 9.25 177Lu Uni. 222.32 0.36 2.07 2.25 0.53 4.26 4.63 1.09 Lin. 0.36 2.07 0.75 0.65 4.26 1.53 1.34 Exp. 0.36 2.06 0.03 1.73 4.24 0.05 3.55 188Re Uni. 2609.61 4.83 32.0 40.9 16.2 38.7 49.5 19.6 Lin. 4.83 31.3 19.3 18.4 37.9 23.3 22.2 Exp. 4.86 27.9 0.54 31.0 33.8 0.65 37.5
Computed dose error is estimated to 5% (1 SD).
values of𝐷tot strongly depend on the radionuclide choice
and not on the antibody distribution type. The largest𝐷Tot
is given for188Re-labelled antibodies. However, it does not exceed 35 Gy in the best conditions of treatment, that is, a long biological half-life of 6 days and a uniform antibody distribution throughout the tumour. Such a dose clearly remains insufficient to treat 0.5 cm radius NSCLC tumours.
Figure 2also shows values of SCP plotted against “𝑟” for the five different radionuclides. These curves give a repre-sentation of cell cluster-killing efficacy at different distances “𝑟” from the tumour centre and give an idea about NSCLC treatment output. For all types of antibody distributions, SCP values for177Lu, 124I, or131I at different distances “𝑟” from the tumour centre remain null, indicating that these
0.0 0.2 0.4 0.6 0.8 1.0 0.0 0.2 0.4 0.6 0.8 1.0 0.0 0.2 0.4 0.6 0.8 1.0 0.0 0.2 0.4 0.6 0.8 1.0 0.0 0.2 0.4 0.6 0.8 1.0 0.0 0.2 0.4 0.6 0.8 1.0 0 10 20 30 40 50 60 0 10 20 30 40 50 60 0 10 20 30 40 50 60 D (G y) SCP (%)
Distancer (cm) Distancer (cm) Distancer (cm)
Linear 0 20 40 60 80 100 0 20 40 60 80 100 0 20 40 60 80 100 90Y 177Lu 188Re 131I 124I 90Y 177Lu 188Re 131I 124I 90Y 177Lu 188Re 131I 124I Uniform Exponential
Figure 2: Comparison of𝐷(𝑟) and SCP(𝑟) profiles as a function of the distance “𝑟” from the tumour centre when single90Y,177Lu,188Re,
131I, and124I are coupled with antibodies distributed uniformly, linearly, and exponentially throughout a 0.5 cm radius tumour. The biological
half-life of antibodies within the tumour corresponds to 6 days.
three radionuclides are not adequate to treat this solid and vascularized 0.5 cm radius tumour. By looking at the SCP curves of188Re and90Y fromFigure 2, we also see that the spatial distribution of the antibodies plays an important role in the treatment outcome. For biological half-lives of 2 or 6 days,𝐷tot for uniform, linear, and exponential distribution
of188Re-labelled antibodies is almost the same whereas the shape of SCP curves varies strongly according to the type of antibody distribution. A similar conclusion can be drawn for 90Y-labelled antibodies. For both radionuclides, only a small difference of about 3 Gy is calculated between the total doses deposited by the radiolabelled antibodies distributed uniformly and exponentially, although strong differences appear in the shape of SCP curves. The slight decrease of 5 Gy when antibody distribution becomes more heterogeneous is explained by the fact that a part of the radiation is transferred from the tumour surface into healthy tissues by crossfire
effects. However, with values lower than 3 Gy for the different radionuclides (cf.Table 3), doses deposited in healthy tissues surrounding the tumour remain largely below the tolerated mean radiation dose of 20 Gy for the lung [35,45].
3.1.2. For 1.0 cm Radius Tumours. Figure 3presents deposited doses, in Gy, for different radial distances when the biological antibodies half-life is 6 days but this time we are studying a 1.0 cm radius tumour. As previously observed for smaller tumours of 0.5 cm radius, 𝐷Surf and 𝐷Cent strongly vary
with the radionuclide choice and the antibody distribution type. For uniform distribution of radiolabelled antibodies, maximal and minimal deposited doses are located in the tumour centre and at the tumour surface, respectively. For linear distribution, the highest deposited doses are found between the tumour centre and the tumour surface. The lowest deposited doses appear at the tumour surface, except
0.0 0.4 0.8 1.2 1.6 2.0 0.0 0.4 0.8 1.2 1.6 2.0 0.0 0.4 0.8 1.2 1.6 2.0 0.0 0.4 0.8 1.2 1.6 2.0 0.0 0.4 0.8 1.2 1.6 2.0 0.0 0.4 0.8 1.2 1.6 2.0 0 10 20 30 40 50 60 0 10 20 30 40 50 60 0 10 20 30 40 50 60 D (G y) SCP (%)
Distancer (cm) Distancer (cm) Distancer (cm)
Uniform 0 20 40 60 80 100 0 20 40 60 80 100 0 20 40 60 80 100 90Y 177Lu 188Re 131I 124I 90Y 177Lu 188Re 131I 124I 90Y 177Lu 188Re 131I 124I Linear Exponential
Figure 3: Comparison of𝐷(𝑟) and SCP(𝑟) profiles as a function of the distance ”𝑟" from the tumour centre when single90Y,177Lu,188Re,
131I, and124I are coupled with antibodies distributed uniformly, linearly, and exponentially throughout a 1.0 cm radius tumour. The biological
half-life of antibodies within the tumour corresponds to 6 days.
for the124I which presents similar values for𝐷Centand𝐷Surf.
Finally, deposited doses for exponential antibody distribution are lower than 1 Gy in the central part of the tumour and the highest doses are deposited near the tumour surface. These results still show that the shape of absorbed doses is strongly affected by the antibody distribution type. Inversely, for each radionuclide, very similar values for𝐷totand𝐷Lungbetween
uniform, linear, and exponential antibody distributions are given inTable 4. Only a small decrease of𝐷totappears when
the antibodies coupled with90Y,188Re, or124I are distributed exponentially rather than uniformly or linearly. Once again, this decrease can be justified by a crossfire effect which causes a radiation loss in the surrounding healthy tissues when the antibodies are preferentially located at the tumour surface.
As shown inTable 4, the highest total deposited doses of 39 Gy and 36 Gy were calculated for188Re- and90Y-labelled antibodies, respectively. However, these doses were obtained according to a long biological half-life of 6 days and a good
penetration to generate a uniform activity distribution inside the tumour. Note that a decrease of the antibody biological half-life within the tumor can cause a decrease of𝐷totwithin
the tumor. Higher total deposited doses are essential to eliminate the NSCLC tumour, provided that these doses remain lower than 20 Gy in the surrounding healthy tissues. For90Y and188Re, the largest doses deposited 4.0 cm beyond the tumour surface remain lower than 20 Gy, even with a biological half-life of 6 days and an exponential distribution of the antibodies.
As illustrated in Figure 3, SCP values for 131I, 124I, or
177Lu distributed uniformly, linearly, or exponentially equal
0% as previously observed for smaller 0.5 cm radius tumours. Inversely, the shape of the SCP curves for 90Y and 188Re radionuclides varies according to the antibody distribution type. For a𝑇bioof 6 days, SCP curves of188Re-labelled
anti-bodies present a plateau starting from the tumour centre and stopping before the tumour surface for uniform distribution,
Table 5: Total absorbed dose (𝐷Tot), absorbed doses at the surface (𝐷Surf), and absorbed doses at the centre (𝐷Cent) or surrounding the
tumour (𝐷Lung), in Gy, required to obtain a maximum TCP of 100% when nanoobjects containing90Y,131I,124I,177Lu, and188Re are coupled to
antibodies having a𝑇bioof 6 days and distributed uniformly, linearly, and exponentially inside a 0.5 cm radius spherical tumour.𝑁NO: number of radioactive atoms per nanoobjects required for TCP = 100%.
Rad. Dist. 𝐴 [kBq] 𝑁NO Dose
Direct uptake 2 days of uptake 𝐷Tot[Gy] 𝐷Cent[Gy] 𝐷Surf[Gy] 𝐷Lung[Gy]
90Y Uni. 370 2 4 77 108 52 10 Lin. 370 2 4 69 70 52 10 Exp. 370 3 5 79 48 79 12 131I Uni. 370 15 18 88 104 54 10 Lin. 370 17 20 95 59 68 11 Exp. 1850 61 72 336 55 409 39 124I Uni. 370 9 13 74 100 53 13 Lin. 370 8 12 67 64 53 12 Exp. 740 15 21 112 56 113 22 177Lu Uni. 740 21 26 95 114 54 8 Lin. 740 26 33 117 64 82 10 Exp. 6660 188 232 820 63 1046 72 188Re Uni. 740 2 15 72 101 48 11 Lin. 740 2 14 64 62 48 10 Exp. 1110 3 21 90 46 92 15
a large peak in the middle of the tumour for linear distribu-tion, and a narrow peak near the tumour surface for expo-nential distribution. Smaller and narrower SCP peaks appear for the90Y-labelled antibodies. This result suggests that188 Re-radiolabelled antibodies have an increased chance of killing NSCLC tumours, regardless of the mAbs distributions.
Consequently, when only one radionuclide is labelled to each antibody, the highest tumour-to-lung deposited dose ratios for both tumour sizes are achieved for low-energy 𝛽-emitter177Lu. However, the NSCLC treatment is favoured by using high-energy𝛽-emitters (90Y and, in particular,188Re) labelled to antibodies with a slow clearance (𝑇bio = 6 days)
and a good penetration (uniform distributions) within the tumour.
3.2. TCP Results for Nanoobjects Containing More Than One Radionuclide. Even with a covering fraction of
109mAbs/cm2, a long biological half-life of 6 days, and a good intratumoural penetration of the radiolabelled antibodies, results from Section 3.1 show that activity remains insufficient to obtain total absorbed doses up to 60– 70 Gy. The logical consequence is that all TCP values remain null for both 0.5 cm and 1.0 cm radii tumours, regardless of the radionuclide used for RIT treatment or the antibodies biokinetics and spatial distribution. However, deposited doses inside the tumour could be increased by synthesizing nanoobjects containing more than one radionuclide per NO. In this section, the impact on the therapeutic effectiveness will be studied when the previously analysed radionuclides coupled to each antibody are replaced by NO containing more than one radioactive atom of 90Y, 177Lu, 131I, 124I, and188Re. For this purpose, the tumour control probability (TCP) versus the number of radioactive atoms per NO will
be analysed. Its value represents the probability that a tumour will be locally controlled for a given dose of radiation. A TCP value of 0% implies that doses deposited inside the tumour remain insufficient, while a TCP value of 100% predicts that the tumour will be eradicated. Our TCP curves will then be compared to NTCP values. Indeed, the latter limits our ability to administrate the dose necessary to control the tumour.
Results reported in Tables 5 and 6investigate how the tumour size (0.5 and 1.0 cm radii) and the spatial distribution of antibodies modify the number of radioactive atoms per NO required for a maximum TCP of 100%. Both tables give values of the total doses absorbed by the tumour (𝐷Tot, in
Gy), doses in the tumour centre (𝐷Cent, in Gy), and doses
deposited at the tumour surface (𝐷surf, in Gy), required to
have a TCP value of 100%. An increase in the deposited doses inside tumours is often associated with an increase in toxicity for healthy tissues surrounding the tumour. To assess the negative effects these nanoobjects could have on the surrounding healthy tissues in 4.0 cm thick shells when TCP has reached 100%, the average doses deposited beyond the tumour surface (𝐷Lung) are calculated for each
radionuclide. To avoid lung diseases like pneumonitis, it is preferable that their values do not exceed the mean radiation dose of 20 Gy usually tolerated by healthy lung tissues. The fourth and fifth columns in Tables 5 and 6 give the number of radionuclides per antibody required to obtain a TCP of 100%. These numbers are directly scaled with a 109mAbs/cm2 covering fraction and an antibody biological half-life within the tumor of 6 days: a less specific antibody with a covering fraction of 108mAb/cm2 would require the number of radioactive atoms to be multiplied by ten to obtain the same TCP. The fourth and fifth columns indicate, respectively, the number of radionuclides when the uptake is
Table 6: Total absorbed dose (𝐷Tot), absorbed doses at the surface (𝐷Surf), and absorbed doses in the centre (𝐷Cent) or surrounding the
tumour (𝐷Lung), in Gy, required to obtain a maximum TCP of 100% when nanoobjects containing90Y,177Lu, and188Re are coupled with
antibodies having a𝑇bioof 6 days and distributed uniformly, linearly, and exponentially inside a 1.0 cm radius spherical tumour.𝑁NO: number of radioactive atoms per nanoobjects required for TCP = 100%.
Rad. Dist. 𝐴 [kBq] 𝑁NO Dose
Direct uptake 2 days of uptake 𝐷Tot[Gy] 𝐷Cent[Gy] 𝐷Surf[Gy] 𝐷Lung[Gy]
90Y Uni. 1850 3 5 106 142 56 11 Lin. 1850 3 4 92 62 56 10 Exp. 29600 43 73 1324 54 1450 167 131I Uni. 6290 27 33 157 180 57 16 Lin. 5550 24 28 135 63 57 14 Exp. 19240 85 101 474 56 440 51 124I Uni. 4440 10 14 96 119 57 14 Lin. 4070 9 13 86 56 57 13 Exp. 11470 26 36 216 52 240 35 177Lu Uni. 14430 52 65 224 243 57 19 Lin. 11470 43 52 182 65 57 16 Exp. 271210 996 1224 4220 53 3539 362 188Re Uni. 6660 3 19 101 129 51 13 Lin. 5920 2 16 87 54 51 11 Exp. 264920 102 726 3432 56 3805 494
supposed to be instantaneous (direct uptake) and the number of radionuclides when 2 days are required to obtain the maximum accumulation of radiolabelled antibodies within the tumour after intravenous administration (2 days uptake) [33]. For the treatment, it is evident that the more radioactive atoms per NO are required, the more difficult the synthesis of small size nanoparticles is. Finally, the three first columns of these tables, respectively, specified the type of radionuclide contained in the radioactive nanoobjects (Rad.), the type of the antibody distribution (Dist), and the tumour activity (𝐴) required to achieve a TCP of 100%.
3.2.1. For 0.5 cm Radius Tumours
𝐷𝑡𝑜𝑡 for a TCP of 100%. For 90Y, 188Re, and 124I, a total
deposited dose lower than 110 Gy inside the whole tumour is sufficient to achieve a TCP of 100%. This value further decreases when the antibodies are distributed linearly and uniformly throughout the tumour until about 65 and 70 Gy. With177Lu- or131I-nanoobjects, doses required to completely kill the tumour are higher for the three types of distribution. The total deposited doses required for a TCP of 100% remain unchanged when the biological half-life increases or decreases but the number of radioactive atoms per NO is different. The smaller the biological half-life is, the higher the required number of radioactive atoms per NO is.
Independently of antibody distribution, 188Re and 90Y require a lower number of radioactive atoms per NO to reach a maximal TCP of 100%. Note that if a direct uptake was assumed, the number of radionuclides per NO requested for a TCP of 100% would be slightly larger for 188Re than for90Y despite a lower mean energy of𝛽-particles emitted by the188Re. The situation is quite different if we consider
that 2 days are required to obtain a maximum accumulation of radiolabelled antibodies within the tumour (column 5 in Table 5). In this case, the number of188Re per NO is higher than the number of90Y per NO due to the shorter physical half-life of188Re. Although the radionuclide124I emits high-energy positrons, the number of atoms per NO required to achieve a TCP of 100% is larger compared to90Y or188Re. This increase of atoms per NO can be explained by a lower num-ber of 𝛽-particles emitted per disintegration (see Table 1). Finally, 177Lu and 131I emit low-energy 𝛽-particles with a range lower than the cell cluster diameter used for our tumour model, meaning that the crossfire effects should be limited. Consequently, the number of radionuclides per NO requested to reach a maximal TCP value of 100% drastically increases. For all radionuclides, the exponential antibody distribution requires a larger number of radioactive atoms per NO for similar treatment efficacy.
𝐷𝑆𝑢𝑟𝑓 and𝐷𝐶𝑒𝑛𝑡 for a TCP of 100%. For a NSCLC tumour
of 0.5 cm radius, we have previously shown that the lowest deposited dose values inside the tumour are located at the tumour surface or in the tumour centre, depending on anti-body distribution, biological half-life, and the radionuclide used for the treatment. As illustrated in columns 7 and 8 of Table 6, the minimum deposited doses for a TCP of 100% range from 46 Gy to 64 Gy. These results show that a minimum deposited dose of about 55 Gy everywhere inside the tumour is required to obtain a good NSCLC treatment outcome.
𝐷𝐿𝑢𝑛𝑔 for a TCP of 100%. Treatment efficacy depends not
solely on the dose absorbed by the tumour but also on the doses deposited by the nanoobjects in the surrounding
healthy tissues. As observed in Table 6, average doses deposited 4.0 cm beyond the tumour surface are lower than 13 Gy for the five different radionuclides distributed uniformly and linearly through the tumour, meaning that the nanoobjects should not have too many direct negative effects on the healthy tissues surrounding the tumour. Larger deposited doses in surrounding healthy tissues are calculated for the exponential distribution of 131I-, 124I-, and 177 Lu-nanoobjects. This result is explained by the high number of radionuclide per NO required for TCP = 100%.
Furthermore, the tumour-to-lung deposited dose ratios (𝐷Tot/𝐷Lung) calculated for the five different radionuclides
and the three antibody distributions are similar to those previously determined for a tumour when only one radionu-clide is coupled to each antibody. So, the largest values for the 𝐷Tot/𝐷Lung ratios are obtained for 177Lu-NPs, which
indicates that the treatment with177Lu-NOs maximizes the radiation dose to the tumour while minimizing normal tissues irradiation. However, as the number of radioactive atoms per NO is high and as177Lu has a longer physical half-life compared to90Y and188Re, it is very important to avoid high concentrations of these177Lu-nanoobjects accumulating in the nontargeted normal organs. Indeed, one isolated NO containing hundreds of atoms of177Lu is harmless for the patient but an accumulation of these nanoobjects in healthy radiosensitive organs such as the red marrow may be very dangerous.
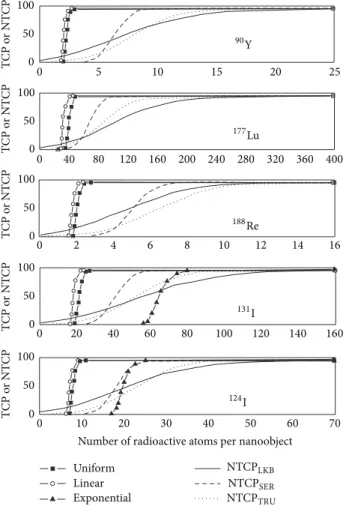
TCP Curves.Figure 4shows TCP curves, plotted for 0.5 cm
radius NSCLC, in relation to the number of radioactive atoms contained in each NO when a direct uptake is considered. TCP curves are represented for the five radionuclides 90Y,
177Lu,188Re,131I, and124I. For each radionuclide, the 3 types
of antibody distributions (uniform, linear, and exponential) and for a biological half-life of 6 days were considered. TCP curves differ according to the radionuclide used for RIT and the type of antibody distribution, showing that treatment efficacy depends on the choice of𝛽-emitters but also on the localization of the activity inside the tumour. NTCP curves were added to assess the risk of pneumonitis for RIT treatments. As illustrated in Figure 4, TCP curves which appear the farthest to the left on each graph are those for which the antibodies are distributed linearly or uniformly through the tumour. Small differences appear between these 2 distributions. When the nanoobjects are distributed exponentially throughout the tumour, the TCP curves shift to a higher number of radioactive atoms per NO. However, for90Y,188Re, and124I, a maximum TCP of 100% could still be reached without too many risks of pneumonitis. Inversely, for the two low-energy𝛽-emitters131I and177Lu, it is impossible to apply an effective treatment without causing strong lung complications. Indeed, TCP curves for both these radionuclides in Figure 4are predominantly located to the right of the NTCP curves and tumour control without a high incidence of complications is unlikely. Note that TCP curves shift to the right when the biological half-life of the antibodies decreases, allowing similar treatment efficacy with a higher number of radionuclides per NO. The shift to the
0 40 80 120 160 200 240 280 320 360 400 0 2 4 6 8 10 12 14 16 0 10 20 30 40 50 60 70 0 5 10 15 20 25 0 20 40 60 80 100 120 140 160 0 50 100 0 50 100 0 50 100 0 50 100 0 50 100 T CP o r NT CP T CP o r NT CP T CP o r NT CP T CP o r NT CP T CP o r NT CP
Number of radioactive atoms per nanoobject
90Y 124I 177Lu 131I 188Re Uniform Linear Exponential NTCPLKB NTCPSER NTCPTRU
Figure 4: TCP values for a 0.5 cm radius tumour, calculated in %, as a function of the number of radioactive atoms included in each NO when the covering fraction corresponds to 1010mAbs/cm2and 𝑇bio = 6 days. TCP curves are represented for90Y-NOs,177Lu-NOs, 188Re-NOs,131I-NOs, and124I-NOs distributed uniformly, linearly,
and exponentially throughout the tumour. For each graph, TCP curves are compared to NTCP curves to predict lung complications risks.
right is even more pronounced when radionuclides have a greater physical half-life such as177Lu and131I. Consequently, for 124I-nanoobjects distributed exponentially within the tumour, TCP and NTCP curves become too close to one another to insure safe treatment if the antibody biological half-life within the tumor decreases.
3.2.2. For 1.0 cm Radius Tumours
𝐷𝑡𝑜𝑡 for a TCP of 100%. By comparingTable 6withTable 5,
the total deposited doses to reach a maximum TCP of 100% are clearly higher when the tumour size increases. For uniform and linear antibody distributions, the total deposited doses for 124I, 188Re, and 90Y range from 86 and 106 Gy for a biological half-life of 6 days. Due to the low-energy of𝛽 emitted by131I, a minimum𝐷totof 135 Gy is required
to obtain a TCP of 100%. Such values can be explained by the lack of crossfire effect which implies a higher difficulty
to kill all the cell clusters located at the tumour surface. With values larger than 180 Gy, the total deposited dose to achieve a TCP of 100% when antibodies are distributed uniformly or linearly throughout the tumour still increases for177Lu, although this radionuclide has the same mean 𝛽-particle range in soft tissues as 131I. When the antibodies are distributed exponentially throughout the tumour, the deposited doses required for a TCP of 100% greatly increase, particularly for90Y,188Re, and177Lu which require a𝐷totup
to, respectively, 1320 Gy, 4220 Gy, and 3430 Gy. As previously seen in Section 3.1, the minimum deposited dose for 90Y,
131I,124I,188Re, and177Lu was located in the tumour centre
when antibodies are distributed exponentially throughout the 1.0 cm radius tumour. For the five radionuclides, doses in the tumour centre range from 52 to 56 Gy, meaning that a minimum dose of about 55 Gy is required everywhere inside the tumour to achieve a TCP of 100%. So, the important increase of𝐷totfor the three radionuclides 90Y,188Re, and 177Lu is mainly explained by the great difficulty to irradiate all
the cell clusters located in the tumour centre at about 55 Gy. Smaller increases of𝐷totare observed for124I and131I. This
probably results from the higher contribution of𝛾 emissions in the total deposited energy. Indeed, 𝛾-rays have a larger range in soft tissues compared to𝛽-particles and favour dose depositions at a greater distance from the radionuclide. In this way, all the cell clusters located in the tumour centre, as well as those located at the tumour surface, are easier to irradiate when the124I- or131I-nanoobjects are exponentially distributed within the tumour.
For uniform and linear distributions of high-energy 𝛽-emitters (90Y,188Re, and124I), the number of radionuclides per NO does not really vary compared to smaller tumours of 0.5 cm radius. The larger activities observed in Table 6 compared toTable 5are essentially due to a larger number of cell clusters around which the antibodies can be fixed. The number of radionuclides needed to achieve a TCP of 100% drastically increases when the90Y- and188Re-nanoobjects are coupled to antibodies distributed exponentially throughout the tumour. The strong activity increase calculated for expo-nential antibody distribution comes from a larger number of cell clusters within the tumour but also from a larger number of radioactive atoms per NO. Such a result could be explained by a great difficulty to irradiate all the cell clusters localized in the tumour centre. Consequently, the exponential distribution of both 188Re- and90Y-nanoobjects represents a disadvantage in the treatment of solid tumours with radii equal to or larger than 1.0 cm. The latter problem is even more striking when the low-energy 𝛽-emitter 177Lu is used for internal radiation. Independently of the antibody distribution type, the larger number of radionuclides per NO observed when the tumour size increases could be explained by a great difficulty to kill all the cell clusters located at the tumour surface. A problem for irradiating cell clusters located in the tumour centre also appears when antibodies are distributed exponentially. Compared with177Lu, the second low-energy 𝛽-emitter131I seems to be less affected by this increase in the
tumour size. Indeed, the shift towards larger values for the number of radionuclides per NO is smaller for131I than for
177Lu. When the antibody distribution becomes exponential,
this number even appears lower than that of 188Re. Such results are explained by a greater contribution of gamma rays for131I and show that, for our MCNPX simulations, it is really important to consider the total (𝛽 and 𝛾) energy deposition to determine TCP values. A similar conclusion is reached for the radionuclide124I for which the lowest number of radioactive atoms per NO required to get a good treatment output is calculated when the antibody distribution is exponential.
𝐷𝑆𝑢𝑟𝑓 and𝐷𝐶𝑒𝑛𝑡 for a TCP of 100%. For the three types of
antibody distributions, the minimum doses deposited in the tumour centre or at the tumour surface are quite similar to the results calculated for a 0.5 cm radius tumour. Their values ranged from 51 Gy to 57 Gy, meaning that, once again, a minimum value of 55 Gy everywhere inside the tumour is required to treat NSCLC correctly. To preserve such a dose in the tumour centre when antibodies are distributed exponen-tially throughout the 1.0 cm radius tumour,𝐷Surf drastically
increases to doses larger than 1450 Gy and 3800 Gy for high-energy 𝛽-emitters such as 90Y and188Re, respectively. For iodine radionuclides,𝐷Surfdecreases to lower values such as
240 Gy for124I and 440 Gy for131I.
𝐷𝐿𝑢𝑛𝑔 for a TCP of 100%. For the 5 different radionuclides,
the deposited doses in the surrounding lung tissues are higher than the values calculated for a 0.5 cm radius NSCLC tumour, independently of antibody distribution. However, for uni-form and linear antibody distributions,𝐷Lungremains lower
than 20 Gy. When the antibodies are distributed exponen-tially throughout a 1.0 cm radius NSCLC tumour, the doses deposited in lung tissues are too high and NSCLC tumours cannot be treated by a single injection of radiolabelled antibodies. The best result is obtained for the124I for which doses in lung tissues reached 35 Gy for a 6-day biological half-life. The surrounding healthy tissues are less affected by the radiation when the radioisotopes177Lu,124I, or131I are used despite a large amount of radioactive atoms per NO required for a TCP of 100%. However, the synthesis of nanoobjects able to assemble such an important number of radioactive atoms remains very difficult experimentally. Furthermore, this high number of radionuclides, mixed with other nonradioactive organic or inorganic atoms and surrounded by additional macromolecules, could form nanoobjects too large to prevent uptake by the reticuloendothelial system and to promote their diffusion throughout the target tissue. This problem would be even more important if the covering fraction is decreased.
TCP Curves. To analyze how tumour size may influence
the number of radioactive atoms per antibody required to maximize the treatment efficacy, TCP distributions have been plotted for 1.0 cm radius tumours. In Figure 5, TCP versus the number of radioactive atoms is represented for the five different radionuclides 90Y, 177Lu, 131I, 124I, and
188Re distributed uniformly and nonuniformly throughout
the tumour. As previously stated, a biological half-life of 6 days for antibodies located inside the tumour was considered. Firstly, we can see that uniform and linear distributions of
0 40 80 120 160 200 240 280 320 360 400 0 2 4 6 8 10 12 14 16 0 10 20 30 40 50 60 70 0 5 10 15 20 25 0 20 40 60 80 100 120 140 160 0 50 100 0 50 100 0 50 100 0 50 100 0 50 100 T CP o r NT CP T CP o r NT CP T CP o r NT CP T CP o r NT CP T CP o r NT CP
Number of radioactive atoms per nanoobject
90Y 124I 177Lu 131I 188Re Uniform Linear Exponential NTCPLKB NTCPSER NTCPTRU
Figure 5: TCP values for a 1.0 cm radius tumour, calculated in %, as a function of the number of radioactive atoms included in each NO when the covering fraction corresponds to 1010mAbs/cm2and 𝑇bio = 6 days. TCP curves are represented for90Y-NOs,177Lu-NOs, 188Re-NOs,131I-NOs, and124I-NOs distributed uniformly, linearly,
and exponentially throughout the tumour. For each graph, TCP curves are compared to NTCP curves to predict lung complications risks.
90Y-, 124I-, or 188Re-nanoobjects from Figure 5are almost
similar in shape and location as those plotted in Figure 4 for smaller tumours. Consequently, tumour size does not influence treatment efficacy. Inversely, TCP curves when the 90Y- and 188Re-nanoobjects are coupled to antibodies distributed exponentially throughout a 1.0 cm radius tumour are to the right of those for complications, whereas those for smaller tumours are to the left. Note that TCP curves are localized too far away from the left of the NTCP curves to be plotted on Figure 5. Even if the shift to the right is less important for the 124I-NPs radiolabelled antibodies distributed exponentially throughout the tumour, maximal TCP could not be reached without lung complications.
By comparingFigure 4withFigure 5for both low-energy 𝛽-emitters 131I and 177Lu, TCP curves for uniform and
linear distributions shift to the right whereas NTCP curves remain unchanged when the tumour size increases. This shift towards higher numbers of radionuclides still increases when
the biological half-life decreases, meaning that the risk of pneumonitis increases.
To conclude, the tumour-to-lung deposited dose ratios for both tumour sizes are similar to those obtained when only one radioactive atom is attached to each antibody. So, the highest 𝐷Tot/𝐷Lung is calculated for the 177Lu-NO,
independently of the antibody distribution or tumor size. However, after TCP and NTCP analyses,90Y and188Re seem the best candidates for the treatment of NSCLC tumour when antibodies are distributed uniformly or linearly. For expo-nential antibody distribution, the radionuclide124I becomes a more adequate candidate, especially for tumours equal to or larger than 1.0 cm radius.
4. Conclusion
This work presents the tumour control probability analysis for solid tumours when nanoobjects (e.g., radiolabelled mAB or mAb bioconjugated nanoparticle) contain one or several 𝛽-emitters which could be used in radioimmunotherapy. NSCLC was selected as tumour model as its biological param-eters are well reported in literature. TCP and NTCP were calculated according to tumour and normal surrounding tissue deposited doses resulting from MCNPX, a Monte Carlo electron, and photon and particles transport code. Dosimetric studies were performed for the five radioisotopes
90Y, 177Lu, 131I, 124I, and 188Re, for two spherical tumour
sizes of 0.5 and 1.0 cm radii and for two biological half-lives. Moreover, these nanoobjects can be distributed uniformly, linearly, or exponentially throughout the tumours according to a new vascularized tumour model previously developed for MCNPX.
When nanoobjects contain only one radionuclide, sim-ulations show that the dose absorbed by the solid tumour is insufficient for solid tumour treatment, regardless of the radionuclide used for RIT treatment or the biokinetics and spatial distributions of antibodies; even so188Re and90Y show the highest deposited doses within the solid tumour.
Higher total absorbed doses can easily be achieved when single radionuclides radiolabelled-mAbs are replaced by nanoobjects containing several𝛽-emitters. The required number of atoms per nanoobject to get TCP = 100% changes according to numerous radionuclide physical properties such as the physical half-life, abundance of 𝛾 emissions, and energies of the emitted𝛽-particles and 𝛾 particles, but also according to the biological properties of the nanoobjects such as their concentration inside the tumour, their spatial distribution, or their biological half-life. These results con-firm the importance of performing individual treatment for each patient. The total absorbed doses to obtain excellent tumour control vary between 60 Gy and more than 5000 Gy depending on the radionuclide choice, tumour size, and nanoobjects spatial distribution.90Y and188Re are the choice if one wants to minimize the number of radioisotopes per nanoobject.
Finally, higher absorbed doses are often synonymous with higher toxicity. Consequently, NTCP usually limits our ability to administer the doses required to control the tumour. For
small 0.5 cm radius tumours, simulations do not show any toxicity problems. In this case, 90Y and 188Re remain the best candidates because they require the lowest number of radionuclides per nanoobject to reach a TCP of 100%. On the other hand, for larger 1.0 cm radius tumours, toxicity to the surrounding healthy tissue is observed when the nanoobjects are distributed exponentially throughout the tumour. This toxicity increases strongly for high-energy𝛽-emitters and124I becomes more appropriate to cure solid tumours. Such results indicate the importance of finding new strategies to insure the penetration of nanoobjects inside tumours.
Conflict of Interests
None of the authors have any conflict of interests related to this study.
Acknowledgment
This research (Targan project & Theraplus project) is sup-ported by the Walloon Region (Belgium).
References
[1] J. L. J. Dearling and R. B. Pedley, “Technological advances in radioimmunotherapy,” Clinical Oncology, vol. 19, no. 6, pp. 457– 469, 2007.
[2] A. Gruaz-Guyon, O. Raguin, and J. Barbet, “Recent advances in pretargeted radioimmunotherapy,” Current Medicinal
Chem-istry, vol. 12, no. 3, pp. 319–338, 2005.
[3] W. A. Bethge and B. M. Sandmaier, “Targeted cancer therapy using radiolabeled monoclonal antibodies,” Technology in
Can-cer Research & Treatment, vol. 4, no. 4, pp. 393–405, 2005.
[4] S. V. Govindan, G. L. Griffiths, H. J. Hansen, I. D. Horak, and D. M. Goldenberg, “Cancer therapy with radiolabeled and drug/toxin-conjugated antibodies,” Technology in Cancer
Research & Treatment, vol. 4, no. 4, pp. 375–391, 2005.
[5] M. W. Brechbiel, O. A. Gansow, R. W. Atcher et al., “Syn-thesis of 1-(p-isothiocyanatobenzyl) derivatives of DTPA and EDTA. Antibody labeling and tumor-imaging studies,”
Inor-ganic Chemistry, vol. 25, no. 16, pp. 2772–2781, 1986.
[6] T. K. Nikula, M. Bocchia, M. J. Curcio et al., “Impact of the high tyrosine fraction in complementarity determining regions: measured and predicted effects of radioiodination on IgG immunoreactivity,” Molecular Immunology, vol. 32, no. 12, pp. 865–872, 1995.
[7] V. Bouchat, N. Moreau, V. Valembois et al., “On the use of radioisotopes to study the possible synthesis by magnetron sputtering of bimetallic nanoparticles,” Surface and Coatings
Technology, vol. 205, no. 21-22, pp. 4934–4940, 2011.
[8] K. V. Katti, R. Kannan, K. Katti et al., “Hybrid gold nanoparticles in molecular imaging and radiotherapy,” Czechoslovak Journal
of Physics, vol. 56, no. 4, pp. D23–D34, 2006.
[9] H. Wu, J. Wang, Z. Wang, D. R. Fisher, and Y. Lin, “Apoferritin-templated yttrium phosphate nanoparticle conjugates for radioimmunotherapy of cancers,” Journal of Nanoscience and
Nanotechnology, vol. 8, no. 5, pp. 2316–2322, 2008.
[10] R. Gref, M. L¨uck, P. Quellec et al., “‘Stealth’ corona-core nanoparticles surface modified by polyethylene glycol (PEG): Influences of the corona (PEG chain length and surface density)
and of the core composition on phagocytic uptake and plasma protein adsorption,” Colloids and Surfaces B: Biointerfaces, vol. 18, no. 3-4, pp. 301–313, 2000.
[11] D. E. Owens III and N. A. Peppas, “Opsonization, biodis-tribution, and pharmacokinetics of polymeric nanoparticles,”
International Journal of Pharmaceutics, vol. 307, no. 1, pp. 93–
102, 2006.
[12] L. Karmani, D. Labar, V. Valembois et al., “Antibody-functionalized nanoparticles for imaging cancer: influence of conjugation to gold nanoparticles on the biodistribution of 89Zr-labeled cetuximab in mice,” Contrast Media & Molecular
Imaging, vol. 8, no. 5, pp. 402–408, 2013.
[13] R. Marega, L. Karmani, L. Flamant et al., “Antibody-functionalized polymer-coated gold nanoparticles targeting cancer cells: an in vitro and in vivo study,” Journal of Materials
Chemistry, vol. 22, no. 39, pp. 21305–21312, 2012.
[14] V. Bouchat, V. E. Nuttens, S. Lucas et al., “Radioimmunotherapy with radioactive nanoparticles: first results of dosimetry for vascularized and necrosed solid tumors,” Medical Physics, vol. 34, no. 11, pp. 4504–4513, 2007.
[15] V. Bouchat, V. E. Nuttens, C. Michiels et al., “Radioim-munotherapy with radioactive nanoparticles: biological doses and treatment efficiency for vascularized tumors with or with-out a central hypoxic area,” Medical Physics, vol. 37, no. 4, pp. 1826–1839, 2010.
[16] Y. Nagata, K. Takayama, Y. Matsuo et al., “Clinical outcomes of a phase I/II study of 48 Gy of stereotactic body radiotherapy in 4 fractions for primary lung cancer using a stereotactic body frame,” International Journal of Radiation Oncology Biology
Physics, vol. 63, no. 5, pp. 1427–1431, 2005.
[17] J. Nyman, K.-A. Johansson, and U. Hult´en, “Stereotactic hypofractionated radiotherapy for stage I non-small cell lung cancer—mature results for medically inoperable patients,” Lung
Cancer, vol. 51, no. 1, pp. 97–103, 2006.
[18] F. J. Lagerwaard, C. J. Haasbeek, B. J. Slotman, and S. Senan, “Clinical results and toxicity after 4-dimensional stereotac-tic radiotherapy for early stage non-small cell lung cancer (NSCLC): B5-04,” Journal of Thoracic Oncology, vol. 2, no. 8, p. S348, 2007.
[19] R. Timmerman, R. McGarry, C. Yiannoutsos et al., “Excessive toxicity when treating central tumors in a phase II study of stereotactic body radiation therapy for medically inoperable early-stage lung cancer,” Journal of Clinical Oncology, vol. 24, no. 30, pp. 4833–4839, 2006.
[20] V. Glatting, M. Bardies, and M. Lassmann, “Treatment planning in molecular radiotherapy,” Zeitschrift f¨ur Medizinische Physik, vol. 23, no. 4, pp. 262–269, 2013.
[21] G. A. Wiseman, C. A. White, R. B. Sparks et al., “Biodistri-bution and dosimetry results from a phase III prospectively randomized controlled trial of Zevalin radioimmunotherapy for low-grade, follicular, or transformed B-cell non-Hodgkin’s lymphoma,” Critical Reviews in Oncology/Hematology, vol. 39, no. 1-2, pp. 181–194, 2001.
[22] J.-P. Pouget, I. Navarro-Teulon, M. Bardi`es et al., “Clini-cal radioimmunotherapy—the role of radiobiology,” Nature
Reviews Clinical Oncology, vol. 8, no. 12, pp. 720–734, 2011.
[23] A. Lauter, A. Strumpf, U. Platzbecker et al., “188Re anti-CD66 radioimmunotherapy combined with reduced-intensity condi-tioning and in-vivo T cell depletion in elderly patients under-going allogeneic haematopoietic cell transplantation: Research paper,” British Journal of Haematology, vol. 148, no. 6, pp. 910– 917, 2010.